Pennsylvania German vs Immigrants from Trinidad and Tobago Ambulatory Disability
COMPARE
Pennsylvania German
Immigrants from Trinidad and Tobago
Ambulatory Disability
Ambulatory Disability Comparison
Pennsylvania Germans
Immigrants from Trinidad and Tobago
6.8%
AMBULATORY DISABILITY
0.0/ 100
METRIC RATING
280th/ 347
METRIC RANK
6.7%
AMBULATORY DISABILITY
0.1/ 100
METRIC RATING
271st/ 347
METRIC RANK
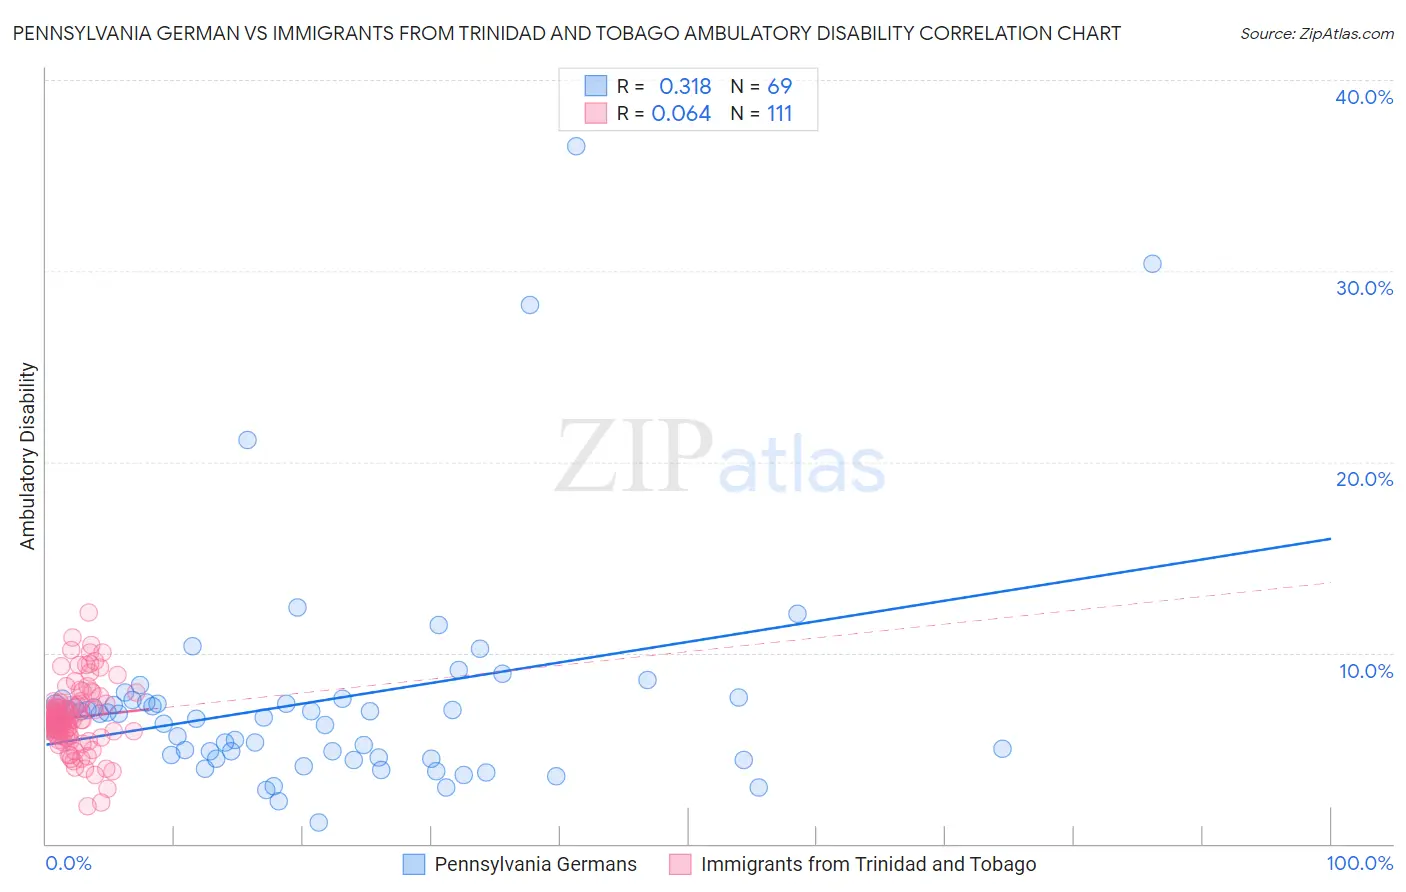
Pennsylvania German vs Immigrants from Trinidad and Tobago Ambulatory Disability Correlation Chart
The statistical analysis conducted on geographies consisting of 234,073,505 people shows a mild positive correlation between the proportion of Pennsylvania Germans and percentage of population with ambulatory disability in the United States with a correlation coefficient (R) of 0.318 and weighted average of 6.8%. Similarly, the statistical analysis conducted on geographies consisting of 223,483,943 people shows a slight positive correlation between the proportion of Immigrants from Trinidad and Tobago and percentage of population with ambulatory disability in the United States with a correlation coefficient (R) of 0.064 and weighted average of 6.7%, a difference of 1.3%.
Ambulatory Disability Correlation Summary
| Measurement | Pennsylvania German | Immigrants from Trinidad and Tobago |
| Minimum | 1.1% | 1.9% |
| Maximum | 36.5% | 12.1% |
| Range | 35.4% | 10.2% |
| Mean | 7.5% | 6.6% |
| Median | 6.8% | 6.5% |
| Interquartile 25% (IQ1) | 4.5% | 5.7% |
| Interquartile 75% (IQ3) | 7.5% | 7.3% |
| Interquartile Range (IQR) | 3.1% | 1.6% |
| Standard Deviation (Sample) | 6.0% | 1.7% |
| Standard Deviation (Population) | 5.9% | 1.7% |
Demographics Similar to Pennsylvania Germans and Immigrants from Trinidad and Tobago by Ambulatory Disability
In terms of ambulatory disability, the demographic groups most similar to Pennsylvania Germans are Yaqui (6.8%, a difference of 0.070%), Immigrants from Caribbean (6.7%, a difference of 0.10%), Barbadian (6.8%, a difference of 0.20%), Immigrants from Barbados (6.8%, a difference of 0.36%), and Immigrants from West Indies (6.7%, a difference of 0.41%). Similarly, the demographic groups most similar to Immigrants from Trinidad and Tobago are Slovak (6.7%, a difference of 0.10%), French (6.6%, a difference of 0.26%), French Canadian (6.7%, a difference of 0.36%), White/Caucasian (6.7%, a difference of 0.38%), and Spanish (6.6%, a difference of 0.56%).
| Demographics | Rating | Rank | Ambulatory Disability |
| Bahamians | 0.2 /100 | #265 | Tragic 6.6% |
| Guyanese | 0.2 /100 | #266 | Tragic 6.6% |
| Trinidadians and Tobagonians | 0.2 /100 | #267 | Tragic 6.6% |
| Spanish | 0.2 /100 | #268 | Tragic 6.6% |
| French | 0.1 /100 | #269 | Tragic 6.6% |
| Slovaks | 0.1 /100 | #270 | Tragic 6.7% |
| Immigrants | Trinidad and Tobago | 0.1 /100 | #271 | Tragic 6.7% |
| French Canadians | 0.1 /100 | #272 | Tragic 6.7% |
| Whites/Caucasians | 0.1 /100 | #273 | Tragic 6.7% |
| Sioux | 0.1 /100 | #274 | Tragic 6.7% |
| Immigrants | Guyana | 0.1 /100 | #275 | Tragic 6.7% |
| Celtics | 0.1 /100 | #276 | Tragic 6.7% |
| Jamaicans | 0.1 /100 | #277 | Tragic 6.7% |
| Immigrants | West Indies | 0.1 /100 | #278 | Tragic 6.7% |
| Immigrants | Caribbean | 0.0 /100 | #279 | Tragic 6.7% |
| Pennsylvania Germans | 0.0 /100 | #280 | Tragic 6.8% |
| Yaqui | 0.0 /100 | #281 | Tragic 6.8% |
| Barbadians | 0.0 /100 | #282 | Tragic 6.8% |
| Immigrants | Barbados | 0.0 /100 | #283 | Tragic 6.8% |
| Immigrants | Jamaica | 0.0 /100 | #284 | Tragic 6.8% |
| Fijians | 0.0 /100 | #285 | Tragic 6.8% |