Nonimmigrants vs Immigrants from Sudan Median Female Earnings
COMPARE
Nonimmigrants
Immigrants from Sudan
Median Female Earnings
Median Female Earnings Comparison
Nonimmigrants
Immigrants from Sudan
$37,024
MEDIAN FEMALE EARNINGS
0.4/ 100
METRIC RATING
267th/ 347
METRIC RANK
$38,511
MEDIAN FEMALE EARNINGS
7.8/ 100
METRIC RATING
223rd/ 347
METRIC RANK
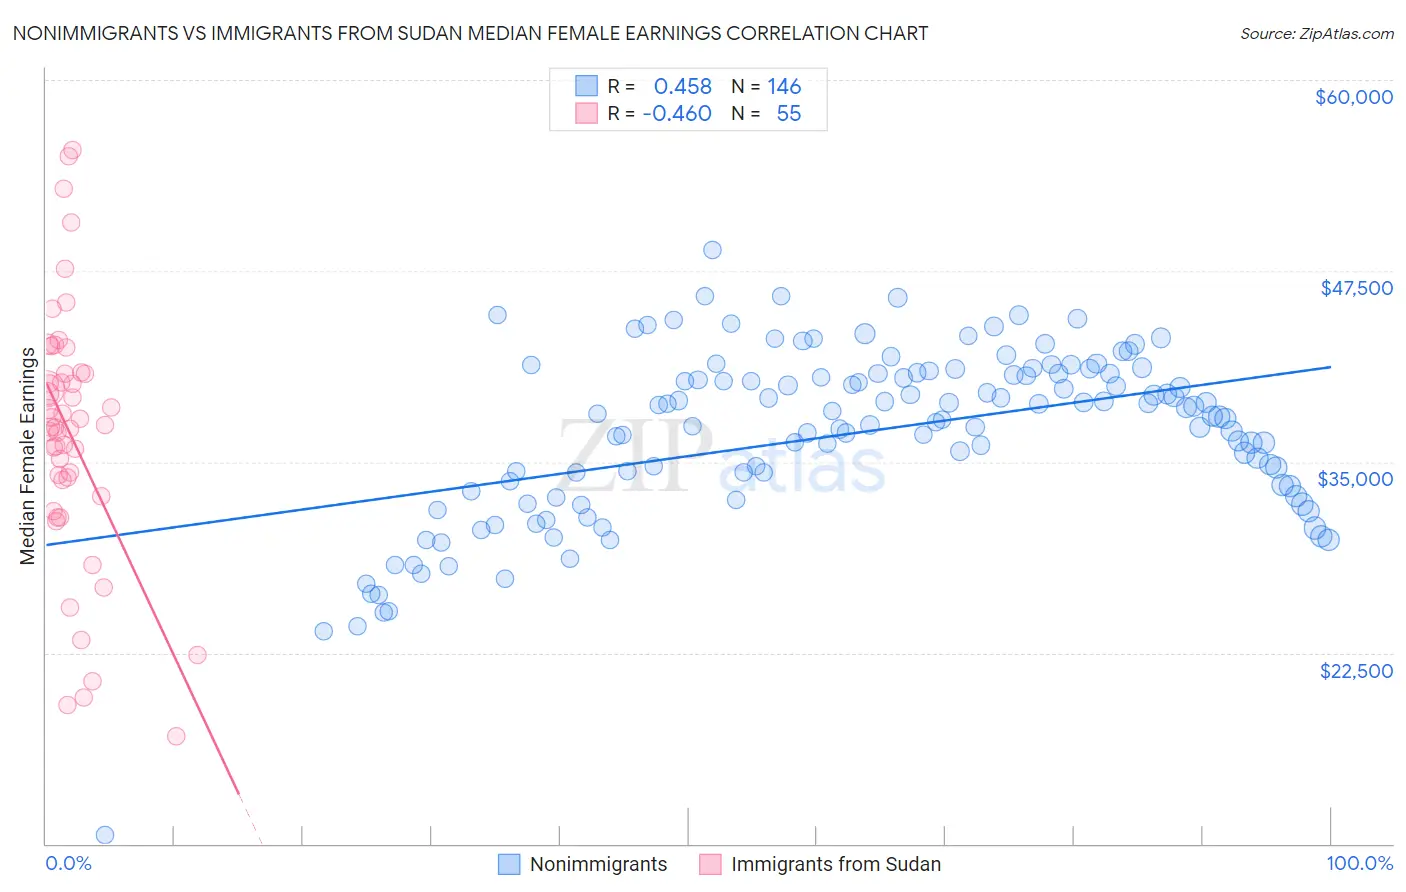
Nonimmigrants vs Immigrants from Sudan Median Female Earnings Correlation Chart
The statistical analysis conducted on geographies consisting of 581,449,824 people shows a moderate positive correlation between the proportion of Nonimmigrants and median female earnings in the United States with a correlation coefficient (R) of 0.458 and weighted average of $37,024. Similarly, the statistical analysis conducted on geographies consisting of 118,958,094 people shows a moderate negative correlation between the proportion of Immigrants from Sudan and median female earnings in the United States with a correlation coefficient (R) of -0.460 and weighted average of $38,511, a difference of 4.0%.
Median Female Earnings Correlation Summary
| Measurement | Nonimmigrants | Immigrants from Sudan |
| Minimum | $10,532 | $17,051 |
| Maximum | $48,847 | $55,449 |
| Range | $38,315 | $38,398 |
| Mean | $36,884 | $36,677 |
| Median | $38,067 | $37,284 |
| Interquartile 25% (IQ1) | $33,375 | $32,734 |
| Interquartile 75% (IQ3) | $40,787 | $40,805 |
| Interquartile Range (IQR) | $7,412 | $8,071 |
| Standard Deviation (Sample) | $5,653 | $8,385 |
| Standard Deviation (Population) | $5,634 | $8,308 |
Similar Demographics by Median Female Earnings
Demographics Similar to Nonimmigrants by Median Female Earnings
In terms of median female earnings, the demographic groups most similar to Nonimmigrants are Cree ($37,018, a difference of 0.010%), Dominican ($37,046, a difference of 0.060%), Immigrants from Venezuela ($37,003, a difference of 0.060%), Immigrants from Belize ($37,056, a difference of 0.090%), and Salvadoran ($37,083, a difference of 0.16%).
| Demographics | Rating | Rank | Median Female Earnings |
| Dutch | 0.7 /100 | #260 | Tragic $37,339 |
| Malaysians | 0.7 /100 | #261 | Tragic $37,298 |
| Venezuelans | 0.7 /100 | #262 | Tragic $37,282 |
| German Russians | 0.5 /100 | #263 | Tragic $37,105 |
| Salvadorans | 0.4 /100 | #264 | Tragic $37,083 |
| Immigrants | Belize | 0.4 /100 | #265 | Tragic $37,056 |
| Dominicans | 0.4 /100 | #266 | Tragic $37,046 |
| Immigrants | Nonimmigrants | 0.4 /100 | #267 | Tragic $37,024 |
| Cree | 0.4 /100 | #268 | Tragic $37,018 |
| Immigrants | Venezuela | 0.4 /100 | #269 | Tragic $37,003 |
| French American Indians | 0.3 /100 | #270 | Tragic $36,920 |
| Nicaraguans | 0.3 /100 | #271 | Tragic $36,904 |
| Immigrants | Dominican Republic | 0.3 /100 | #272 | Tragic $36,857 |
| Immigrants | Laos | 0.3 /100 | #273 | Tragic $36,841 |
| Immigrants | El Salvador | 0.2 /100 | #274 | Tragic $36,673 |
Demographics Similar to Immigrants from Sudan by Median Female Earnings
In terms of median female earnings, the demographic groups most similar to Immigrants from Sudan are Japanese ($38,528, a difference of 0.040%), Native Hawaiian ($38,461, a difference of 0.13%), French ($38,457, a difference of 0.14%), Yugoslavian ($38,573, a difference of 0.16%), and Immigrants from the Azores ($38,573, a difference of 0.16%).
| Demographics | Rating | Rank | Median Female Earnings |
| Immigrants | Ecuador | 10.1 /100 | #216 | Poor $38,644 |
| Immigrants | Jamaica | 9.7 /100 | #217 | Tragic $38,625 |
| Cape Verdeans | 9.5 /100 | #218 | Tragic $38,614 |
| Nepalese | 9.3 /100 | #219 | Tragic $38,603 |
| Yugoslavians | 8.8 /100 | #220 | Tragic $38,573 |
| Immigrants | Azores | 8.8 /100 | #221 | Tragic $38,573 |
| Japanese | 8.1 /100 | #222 | Tragic $38,528 |
| Immigrants | Sudan | 7.8 /100 | #223 | Tragic $38,511 |
| Native Hawaiians | 7.1 /100 | #224 | Tragic $38,461 |
| French | 7.0 /100 | #225 | Tragic $38,457 |
| French Canadians | 6.8 /100 | #226 | Tragic $38,436 |
| Scottish | 6.3 /100 | #227 | Tragic $38,397 |
| Sub-Saharan Africans | 6.2 /100 | #228 | Tragic $38,391 |
| Belgians | 6.1 /100 | #229 | Tragic $38,382 |
| Basques | 5.7 /100 | #230 | Tragic $38,352 |