Nonimmigrants vs Central American Indian Median Female Earnings
COMPARE
Nonimmigrants
Central American Indian
Median Female Earnings
Median Female Earnings Comparison
Nonimmigrants
Central American Indians
$37,024
MEDIAN FEMALE EARNINGS
0.4/ 100
METRIC RATING
267th/ 347
METRIC RANK
$35,930
MEDIAN FEMALE EARNINGS
0.0/ 100
METRIC RATING
290th/ 347
METRIC RANK
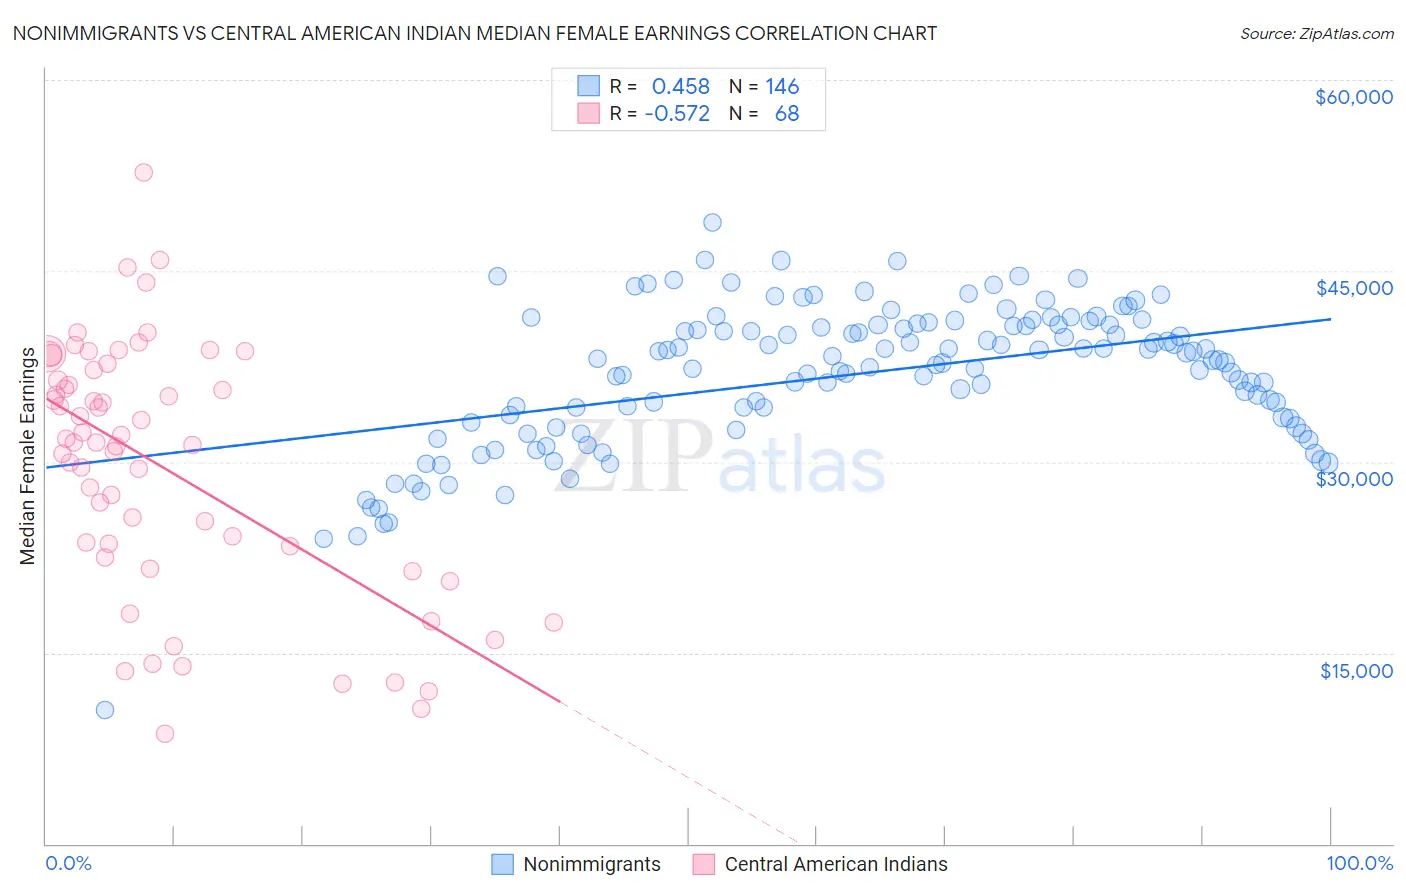
Nonimmigrants vs Central American Indian Median Female Earnings Correlation Chart
The statistical analysis conducted on geographies consisting of 581,449,824 people shows a moderate positive correlation between the proportion of Nonimmigrants and median female earnings in the United States with a correlation coefficient (R) of 0.458 and weighted average of $37,024. Similarly, the statistical analysis conducted on geographies consisting of 326,049,316 people shows a substantial negative correlation between the proportion of Central American Indians and median female earnings in the United States with a correlation coefficient (R) of -0.572 and weighted average of $35,930, a difference of 3.0%.
Median Female Earnings Correlation Summary
| Measurement | Nonimmigrants | Central American Indian |
| Minimum | $10,532 | $8,640 |
| Maximum | $48,847 | $52,708 |
| Range | $38,315 | $44,068 |
| Mean | $36,884 | $29,634 |
| Median | $38,067 | $31,554 |
| Interquartile 25% (IQ1) | $33,375 | $22,964 |
| Interquartile 75% (IQ3) | $40,787 | $36,801 |
| Interquartile Range (IQR) | $7,412 | $13,837 |
| Standard Deviation (Sample) | $5,653 | $9,825 |
| Standard Deviation (Population) | $5,634 | $9,752 |
Similar Demographics by Median Female Earnings
Demographics Similar to Nonimmigrants by Median Female Earnings
In terms of median female earnings, the demographic groups most similar to Nonimmigrants are Cree ($37,018, a difference of 0.010%), Dominican ($37,046, a difference of 0.060%), Immigrants from Venezuela ($37,003, a difference of 0.060%), Immigrants from Belize ($37,056, a difference of 0.090%), and Salvadoran ($37,083, a difference of 0.16%).
| Demographics | Rating | Rank | Median Female Earnings |
| Dutch | 0.7 /100 | #260 | Tragic $37,339 |
| Malaysians | 0.7 /100 | #261 | Tragic $37,298 |
| Venezuelans | 0.7 /100 | #262 | Tragic $37,282 |
| German Russians | 0.5 /100 | #263 | Tragic $37,105 |
| Salvadorans | 0.4 /100 | #264 | Tragic $37,083 |
| Immigrants | Belize | 0.4 /100 | #265 | Tragic $37,056 |
| Dominicans | 0.4 /100 | #266 | Tragic $37,046 |
| Immigrants | Nonimmigrants | 0.4 /100 | #267 | Tragic $37,024 |
| Cree | 0.4 /100 | #268 | Tragic $37,018 |
| Immigrants | Venezuela | 0.4 /100 | #269 | Tragic $37,003 |
| French American Indians | 0.3 /100 | #270 | Tragic $36,920 |
| Nicaraguans | 0.3 /100 | #271 | Tragic $36,904 |
| Immigrants | Dominican Republic | 0.3 /100 | #272 | Tragic $36,857 |
| Immigrants | Laos | 0.3 /100 | #273 | Tragic $36,841 |
| Immigrants | El Salvador | 0.2 /100 | #274 | Tragic $36,673 |
Demographics Similar to Central American Indians by Median Female Earnings
In terms of median female earnings, the demographic groups most similar to Central American Indians are Bangladeshi ($35,960, a difference of 0.080%), Blackfeet ($35,864, a difference of 0.18%), Immigrants from Zaire ($36,017, a difference of 0.24%), Immigrants from Nicaragua ($36,023, a difference of 0.26%), and Osage ($36,034, a difference of 0.29%).
| Demographics | Rating | Rank | Median Female Earnings |
| Immigrants | Haiti | 0.1 /100 | #283 | Tragic $36,203 |
| Indonesians | 0.1 /100 | #284 | Tragic $36,140 |
| Paiute | 0.1 /100 | #285 | Tragic $36,056 |
| Osage | 0.0 /100 | #286 | Tragic $36,034 |
| Immigrants | Nicaragua | 0.0 /100 | #287 | Tragic $36,023 |
| Immigrants | Zaire | 0.0 /100 | #288 | Tragic $36,017 |
| Bangladeshis | 0.0 /100 | #289 | Tragic $35,960 |
| Central American Indians | 0.0 /100 | #290 | Tragic $35,930 |
| Blackfeet | 0.0 /100 | #291 | Tragic $35,864 |
| Americans | 0.0 /100 | #292 | Tragic $35,777 |
| Guatemalans | 0.0 /100 | #293 | Tragic $35,695 |
| Cheyenne | 0.0 /100 | #294 | Tragic $35,673 |
| Comanche | 0.0 /100 | #295 | Tragic $35,661 |
| Mexican American Indians | 0.0 /100 | #296 | Tragic $35,629 |
| Hmong | 0.0 /100 | #297 | Tragic $35,498 |