Nigerian vs Venezuelan Householder Income Over 65 years
COMPARE
Nigerian
Venezuelan
Householder Income Over 65 years
Householder Income Over 65 years Comparison
Nigerians
Venezuelans
$58,992
HOUSEHOLDER INCOME OVER 65 YEARS
11.2/ 100
METRIC RATING
210th/ 347
METRIC RANK
$58,026
HOUSEHOLDER INCOME OVER 65 YEARS
4.4/ 100
METRIC RATING
225th/ 347
METRIC RANK
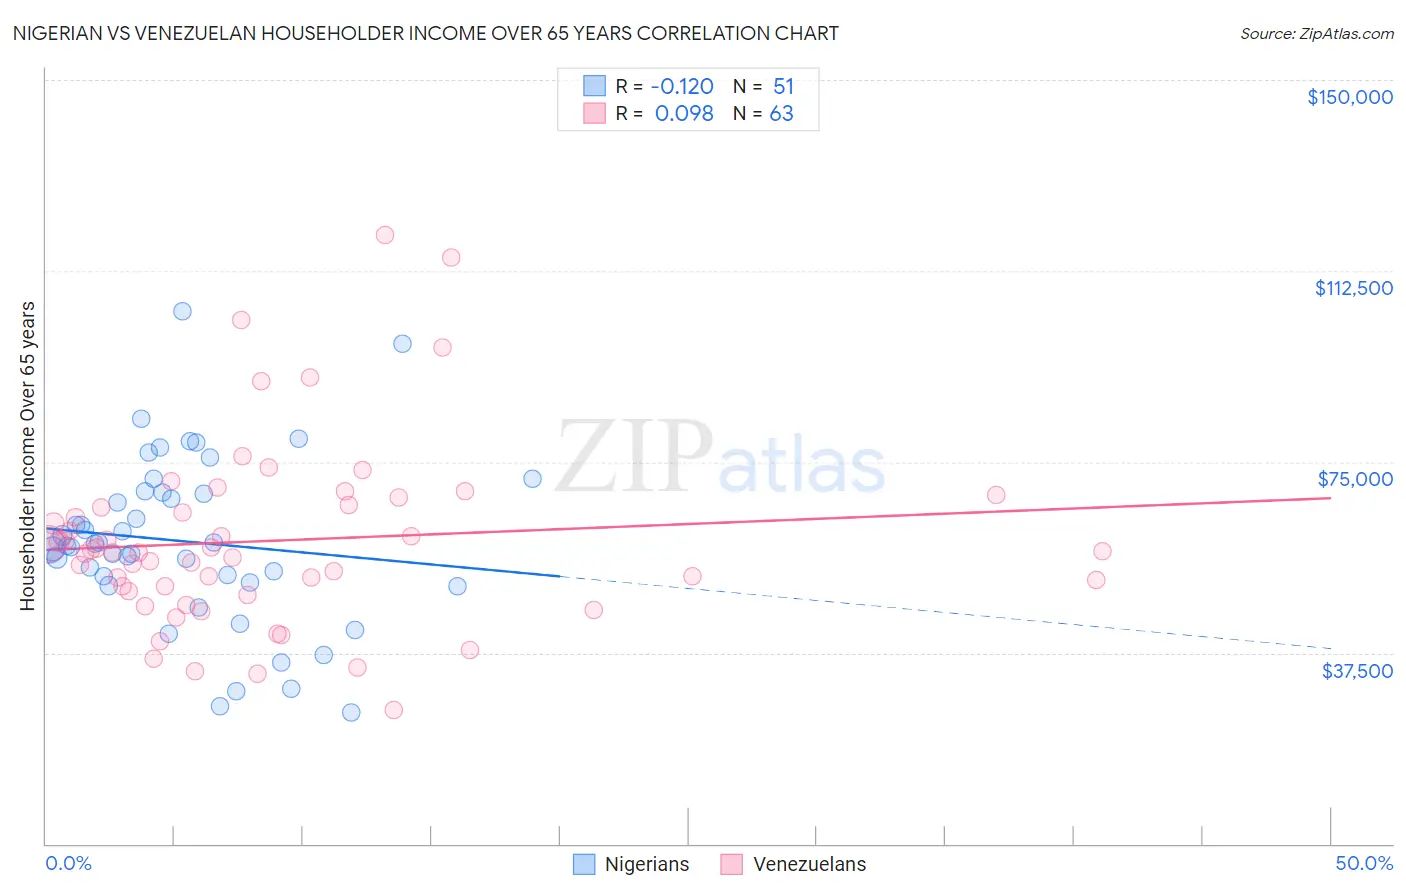
Nigerian vs Venezuelan Householder Income Over 65 years Correlation Chart
The statistical analysis conducted on geographies consisting of 331,517,190 people shows a poor negative correlation between the proportion of Nigerians and household income with householder over the age of 65 in the United States with a correlation coefficient (R) of -0.120 and weighted average of $58,992. Similarly, the statistical analysis conducted on geographies consisting of 305,429,725 people shows a slight positive correlation between the proportion of Venezuelans and household income with householder over the age of 65 in the United States with a correlation coefficient (R) of 0.098 and weighted average of $58,026, a difference of 1.7%.
Householder Income Over 65 years Correlation Summary
| Measurement | Nigerian | Venezuelan |
| Minimum | $25,694 | $26,376 |
| Maximum | $104,625 | $119,643 |
| Range | $78,931 | $93,267 |
| Mean | $59,394 | $59,526 |
| Median | $58,564 | $57,305 |
| Interquartile 25% (IQ1) | $51,335 | $49,696 |
| Interquartile 75% (IQ3) | $68,991 | $66,429 |
| Interquartile Range (IQR) | $17,656 | $16,733 |
| Standard Deviation (Sample) | $16,370 | $18,107 |
| Standard Deviation (Population) | $16,209 | $17,963 |
Demographics Similar to Nigerians and Venezuelans by Householder Income Over 65 years
In terms of householder income over 65 years, the demographic groups most similar to Nigerians are Slovak ($59,039, a difference of 0.080%), Immigrants from Nigeria ($58,942, a difference of 0.090%), Uruguayan ($59,090, a difference of 0.17%), Colombian ($58,851, a difference of 0.24%), and Salvadoran ($59,141, a difference of 0.25%). Similarly, the demographic groups most similar to Venezuelans are French Canadian ($57,975, a difference of 0.090%), Japanese ($57,919, a difference of 0.18%), Bermudan ($58,171, a difference of 0.25%), Tsimshian ($58,202, a difference of 0.30%), and Delaware ($58,214, a difference of 0.32%).
| Demographics | Rating | Rank | Householder Income Over 65 years |
| Salvadorans | 12.9 /100 | #207 | Poor $59,141 |
| Uruguayans | 12.3 /100 | #208 | Poor $59,090 |
| Slovaks | 11.7 /100 | #209 | Poor $59,039 |
| Nigerians | 11.2 /100 | #210 | Poor $58,992 |
| Immigrants | Nigeria | 10.7 /100 | #211 | Poor $58,942 |
| Colombians | 9.8 /100 | #212 | Tragic $58,851 |
| Whites/Caucasians | 9.8 /100 | #213 | Tragic $58,847 |
| Nepalese | 9.0 /100 | #214 | Tragic $58,761 |
| Immigrants | Ghana | 7.9 /100 | #215 | Tragic $58,624 |
| Immigrants | Middle Africa | 6.2 /100 | #216 | Tragic $58,375 |
| Sudanese | 5.7 /100 | #217 | Tragic $58,281 |
| Panamanians | 5.6 /100 | #218 | Tragic $58,266 |
| Malaysians | 5.5 /100 | #219 | Tragic $58,244 |
| Yugoslavians | 5.5 /100 | #220 | Tragic $58,243 |
| Immigrants | El Salvador | 5.4 /100 | #221 | Tragic $58,226 |
| Delaware | 5.3 /100 | #222 | Tragic $58,214 |
| Tsimshian | 5.2 /100 | #223 | Tragic $58,202 |
| Bermudans | 5.1 /100 | #224 | Tragic $58,171 |
| Venezuelans | 4.4 /100 | #225 | Tragic $58,026 |
| French Canadians | 4.2 /100 | #226 | Tragic $57,975 |
| Japanese | 3.9 /100 | #227 | Tragic $57,919 |