Immigrants from Eastern Asia vs Venezuelan Householder Income Over 65 years

COMPARE

Immigrants from Eastern Asia
Race
Ancestry
AfghanAfricanAlaska NativeAlaskan AthabascanAlbanianAleutAlsatianAmericanApacheArabArapahoArgentineanArmenianAssyrian/Chaldean/SyriacAustralianAustrianBahamianBangladeshiBarbadianBasqueBelgianBelizeanBermudanBhutaneseBlackfeetBolivianBrazilianBritishBritish West IndianBulgarianBurmeseCajunCambodianCanadianCape VerdeanCarpatho RusynCelticCentral AmericanCentral American IndianCherokeeCheyenneChickasawChileanChineseChippewaChoctawColombianColvilleComancheCosta RicanCreeCreekCroatianCrowCubanCypriotCzechCzechoslovakianDanishDelawareDominicanDutchDutch West IndianEastern EuropeanEcuadorianEgyptianEnglishEstonianEthiopianEuropeanFijianFilipinoFinnishFrenchFrench American IndianFrench CanadianGermanGerman RussianGhanaianGreekGuamanian/ChamorroGuatemalanGuyaneseHaitianHmongHonduranHopiHoumaHungarianIcelanderIndian (Asian)IndonesianInupiatIranianIraqiIrishIroquoisIsraeliItalianJamaicanJapaneseJordanianKenyanKiowaKoreanLaotianLatvianLebaneseLiberianLithuanianLumbeeLuxembourgerMacedonianMalaysianMalteseMarshalleseMenomineeMexicanMexican American IndianMongolianMoroccanNative HawaiianNavajoNepaleseNew ZealanderNicaraguanNigerianNorthern EuropeanNorwegianOkinawanOsageOttawaPaiutePakistaniPalestinianPanamanianParaguayanPennsylvania GermanPeruvianPimaPolishPortuguesePotawatomiPuebloPuerto RicanPuget Sound SalishRomanianRussianSalvadoranSamoanScandinavianScotch-IrishScottishSeminoleSenegaleseSerbianShoshoneSierra LeoneanSiouxSlavicSlovakSloveneSomaliSouth AfricanSouth AmericanSouth American IndianSoviet UnionSpaniardSpanishSpanish AmericanSpanish American IndianSri LankanSubsaharan AfricanSudaneseSwedishSwissSyrianTaiwaneseThaiTlingit-HaidaTohono O'OdhamTonganTrinidadian and TobagonianTsimshianTurkishU.S. Virgin IslanderUgandanUkrainianUruguayanUteVietnameseWelshWest IndianYakamaYaquiYugoslavianYumanYup'ikZimbabwean
Immigration
NonimmigrantsImmigrantsAfghanistanAfricaAlbaniaArgentinaArmeniaAsiaAustraliaAustriaBahamasBangladeshBarbadosBelarusBelgiumBelizeBoliviaBosnia and HerzegovinaBrazilBulgariaBurma/MyanmarCabo VerdeCambodiaCameroonCanadaCaribbeanCentral AmericaChileChinaColombiaCongoCosta RicaCroatiaCubaCzechoslovakiaDenmarkDominicaDominican RepublicEastern AfricaEastern AsiaEastern EuropeEcuadorEgyptEl SalvadorEnglandEritreaEthiopiaEuropeFijiFranceGermanyGhanaGreeceGrenadaGuatemalaGuyanaHaitiHondurasHong KongHungaryIndiaIndonesiaIranIraqIrelandIsraelItalyJamaicaJapanJordanKazakhstanKenyaKoreaKuwaitLaosLatin AmericaLatviaLebanonLiberiaLithuaniaMalaysiaMexicoMicronesiaMiddle AfricaMoldovaMoroccoNepalNetherlandsNicaraguaNigeriaNorth AmericaNorth MacedoniaNorthern AfricaNorthern EuropeNorwayOceaniaPakistanPanamaPeruPhilippinesPolandPortugalRomaniaRussiaSaudi ArabiaScotlandSenegalSerbiaSierra LeoneSingaporeSomaliaSouth AfricaSouth AmericaSouth Central AsiaSouth Eastern AsiaSouthern EuropeSpainSri LankaSt. Vincent and the GrenadinesSudanSwedenSwitzerlandSyriaTaiwanThailandTrinidad and TobagoTurkeyUgandaUkraineUruguayUzbekistanVenezuelaVietnamWest IndiesWestern AfricaWestern AsiaWestern EuropeYemenZaireZimbabweAzores
Venezuelan
Race
Ancestry
AfghanAfricanAlaska NativeAlaskan AthabascanAlbanianAleutAlsatianAmericanApacheArabArapahoArgentineanArmenianAssyrian/Chaldean/SyriacAustralianAustrianBahamianBangladeshiBarbadianBasqueBelgianBelizeanBermudanBhutaneseBlackfeetBolivianBrazilianBritishBritish West IndianBulgarianBurmeseCajunCambodianCanadianCape VerdeanCarpatho RusynCelticCentral AmericanCentral American IndianCherokeeCheyenneChickasawChileanChineseChippewaChoctawColombianColvilleComancheCosta RicanCreeCreekCroatianCrowCubanCypriotCzechCzechoslovakianDanishDelawareDominicanDutchDutch West IndianEastern EuropeanEcuadorianEgyptianEnglishEstonianEthiopianEuropeanFijianFilipinoFinnishFrenchFrench American IndianFrench CanadianGermanGerman RussianGhanaianGreekGuamanian/ChamorroGuatemalanGuyaneseHaitianHmongHonduranHopiHoumaHungarianIcelanderIndian (Asian)IndonesianInupiatIranianIraqiIrishIroquoisIsraeliItalianJamaicanJapaneseJordanianKenyanKiowaKoreanLaotianLatvianLebaneseLiberianLithuanianLumbeeLuxembourgerMacedonianMalaysianMalteseMarshalleseMenomineeMexicanMexican American IndianMongolianMoroccanNative HawaiianNavajoNepaleseNew ZealanderNicaraguanNigerianNorthern EuropeanNorwegianOkinawanOsageOttawaPaiutePakistaniPalestinianPanamanianParaguayanPennsylvania GermanPeruvianPimaPolishPortuguesePotawatomiPuebloPuerto RicanPuget Sound SalishRomanianRussianSalvadoranSamoanScandinavianScotch-IrishScottishSeminoleSenegaleseSerbianShoshoneSierra LeoneanSiouxSlavicSlovakSloveneSomaliSouth AfricanSouth AmericanSouth American IndianSoviet UnionSpaniardSpanishSpanish AmericanSpanish American IndianSri LankanSubsaharan AfricanSudaneseSwedishSwissSyrianTaiwaneseThaiTlingit-HaidaTohono O'OdhamTonganTrinidadian and TobagonianTsimshianTurkishU.S. Virgin IslanderUgandanUkrainianUruguayanUteVenezuelanVietnameseWelshWest IndianYakamaYaquiYugoslavianYumanYup'ikZimbabwean
Immigration
NonimmigrantsImmigrantsAfghanistanAfricaAlbaniaArgentinaArmeniaAsiaAustraliaAustriaBahamasBangladeshBarbadosBelarusBelgiumBelizeBoliviaBosnia and HerzegovinaBrazilBulgariaBurma/MyanmarCabo VerdeCambodiaCameroonCanadaCaribbeanCentral AmericaChileChinaColombiaCongoCosta RicaCroatiaCubaCzechoslovakiaDenmarkDominicaDominican RepublicEastern AfricaEastern EuropeEcuadorEgyptEl SalvadorEnglandEritreaEthiopiaEuropeFijiFranceGermanyGhanaGreeceGrenadaGuatemalaGuyanaHaitiHondurasHong KongHungaryIndiaIndonesiaIranIraqIrelandIsraelItalyJamaicaJapanJordanKazakhstanKenyaKoreaKuwaitLaosLatin AmericaLatviaLebanonLiberiaLithuaniaMalaysiaMexicoMicronesiaMiddle AfricaMoldovaMoroccoNepalNetherlandsNicaraguaNigeriaNorth AmericaNorth MacedoniaNorthern AfricaNorthern EuropeNorwayOceaniaPakistanPanamaPeruPhilippinesPolandPortugalRomaniaRussiaSaudi ArabiaScotlandSenegalSerbiaSierra LeoneSingaporeSomaliaSouth AfricaSouth AmericaSouth Central AsiaSouth Eastern AsiaSouthern EuropeSpainSri LankaSt. Vincent and the GrenadinesSudanSwedenSwitzerlandSyriaTaiwanThailandTrinidad and TobagoTurkeyUgandaUkraineUruguayUzbekistanVenezuelaVietnamWest IndiesWestern AfricaWestern AsiaWestern EuropeYemenZaireZimbabweAzores
Householder Income Over 65 years
Income
Poverty
Unemployment
Labor Participation
Family Structure
Vehicle Availability
Education Level
Disability

Householder Income Over 65 years Comparison

Immigrants from Eastern Asia

Venezuelans

Exceptional
Tragic
$69,872
HOUSEHOLDER INCOME OVER 65 YEARS
100.0/ 100
METRIC RATING
21st/ 347
METRIC RANK
$58,026
HOUSEHOLDER INCOME OVER 65 YEARS
4.4/ 100
METRIC RATING
225th/ 347
METRIC RANK

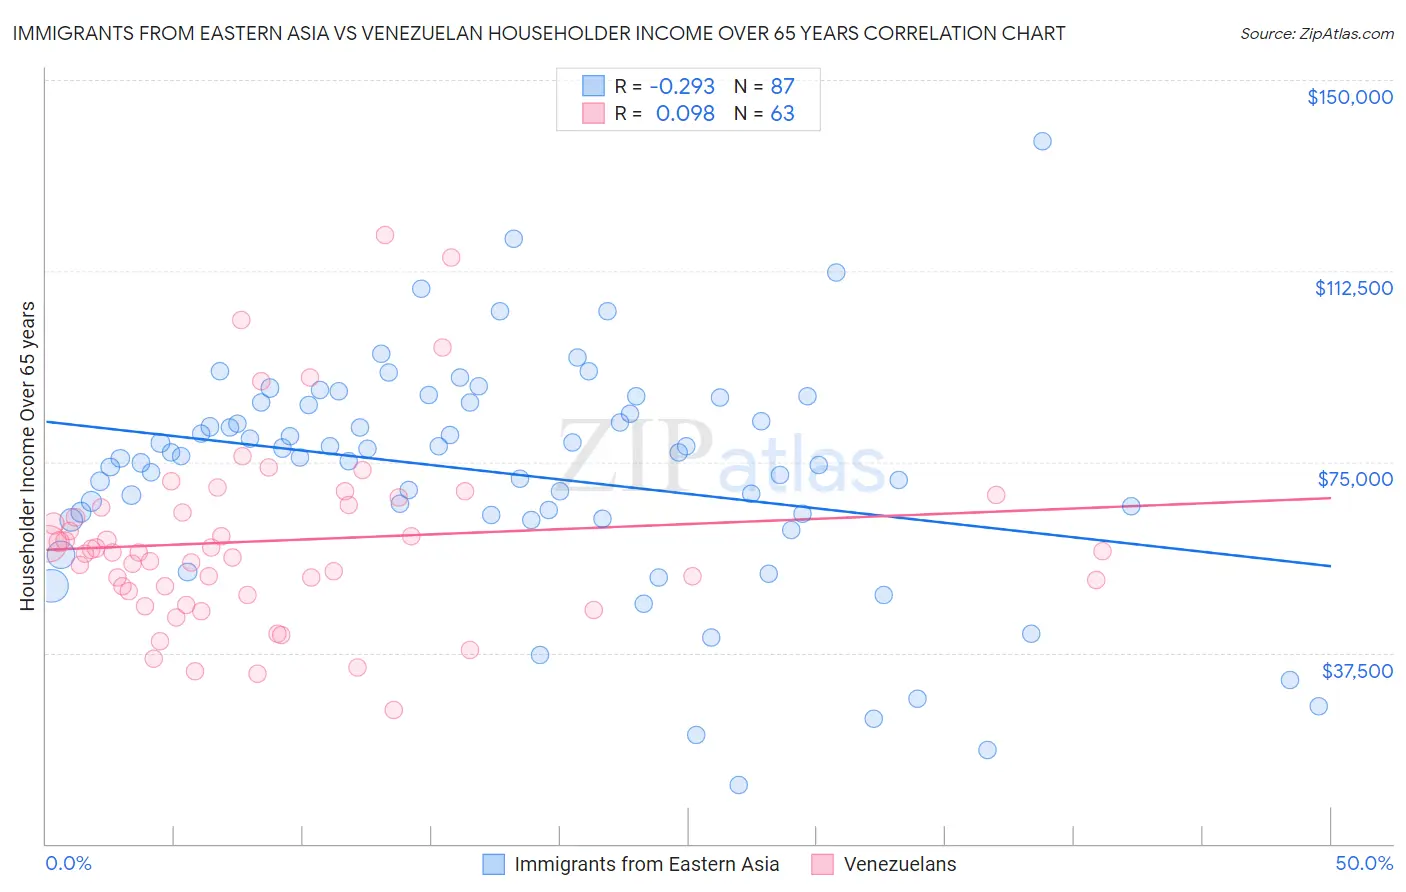
Immigrants from Eastern Asia vs Venezuelan Householder Income Over 65 years Correlation Chart

The statistical analysis conducted on geographies consisting of 497,045,213 people shows a weak negative correlation between the proportion of Immigrants from Eastern Asia and household income with householder over the age of 65 in the United States with a correlation coefficient (R) of -0.293 and weighted average of $69,872. Similarly, the statistical analysis conducted on geographies consisting of 305,429,725 people shows a slight positive correlation between the proportion of Venezuelans and household income with householder over the age of 65 in the United States with a correlation coefficient (R) of 0.098 and weighted average of $58,026, a difference of 20.4%.
Immigrants from Eastern Asia vs Venezuelan Householder Income Over 65 years

Householder Income Over 65 years Correlation Summary

MeasurementImmigrants from Eastern AsiaVenezuelan
Minimum$11,563$26,376
Maximum$137,919$119,643
Range$126,356$93,267
Mean$72,808$59,526
Median$76,112$57,305
Interquartile 25% (IQ1)$64,522$49,696
Interquartile 75% (IQ3)$86,562$66,429
Interquartile Range (IQR)$22,039$16,733
Standard Deviation (Sample)$22,168$18,107
Standard Deviation (Population)$22,041$17,963

Similar Demographics by Householder Income Over 65 years

Demographics Similar to Immigrants from Eastern Asia by Householder Income Over 65 years

In terms of householder income over 65 years, the demographic groups most similar to Immigrants from Eastern Asia are Immigrants from Israel ($69,857, a difference of 0.020%), Immigrants from Japan ($69,774, a difference of 0.14%), Immigrants from Sweden ($69,722, a difference of 0.22%), Immigrants from Belgium ($69,703, a difference of 0.24%), and Immigrants from South Central Asia ($70,103, a difference of 0.33%).
DemographicsRating | RankHouseholder Income Over 65 years
Burmese
100.0
/100
|
#14
Exceptional
$71,139
Native Hawaiians
100.0
/100
|
#15
Exceptional
$71,021
Okinawans
100.0
/100
|
#16
Exceptional
$70,846
Immigrants | Korea
100.0
/100
|
#17
Exceptional
$70,696
Eastern Europeans
100.0
/100
|
#18
Exceptional
$70,470
Indians (Asian)
100.0
/100
|
#19
Exceptional
$70,238
Immigrants | South Central Asia
100.0
/100
|
#20
Exceptional
$70,103
Immigrants | Eastern Asia
100.0
/100
|
#21
Exceptional
$69,872
Immigrants | Israel
100.0
/100
|
#22
Exceptional
$69,857
Immigrants | Japan
100.0
/100
|
#23
Exceptional
$69,774
Immigrants | Sweden
100.0
/100
|
#24
Exceptional
$69,722
Immigrants | Belgium
100.0
/100
|
#25
Exceptional
$69,703
Immigrants | Sri Lanka
100.0
/100
|
#26
Exceptional
$69,426
Immigrants | Switzerland
100.0
/100
|
#27
Exceptional
$69,343
Immigrants | China
100.0
/100
|
#28
Exceptional
$69,174

Demographics Similar to Venezuelans by Householder Income Over 65 years

In terms of householder income over 65 years, the demographic groups most similar to Venezuelans are French Canadian ($57,975, a difference of 0.090%), Japanese ($57,919, a difference of 0.18%), Bermudan ($58,171, a difference of 0.25%), Tsimshian ($58,202, a difference of 0.30%), and Delaware ($58,214, a difference of 0.32%).
DemographicsRating | RankHouseholder Income Over 65 years
Panamanians
5.6
/100
|
#218
Tragic
$58,266
Malaysians
5.5
/100
|
#219
Tragic
$58,244
Yugoslavians
5.5
/100
|
#220
Tragic
$58,243
Immigrants | El Salvador
5.4
/100
|
#221
Tragic
$58,226
Delaware
5.3
/100
|
#222
Tragic
$58,214
Tsimshian
5.2
/100
|
#223
Tragic
$58,202
Bermudans
5.1
/100
|
#224
Tragic
$58,171
Venezuelans
4.4
/100
|
#225
Tragic
$58,026
French Canadians
4.2
/100
|
#226
Tragic
$57,975
Japanese
3.9
/100
|
#227
Tragic
$57,919
Immigrants | Albania
3.6
/100
|
#228
Tragic
$57,828
Immigrants | Colombia
3.0
/100
|
#229
Tragic
$57,658
Immigrants | Cambodia
2.8
/100
|
#230
Tragic
$57,580
Immigrants | Nonimmigrants
2.4
/100
|
#231
Tragic
$57,426
Immigrants | Venezuela
2.3
/100
|
#232
Tragic
$57,371