Menominee vs Immigrants from Guyana Median Female Earnings
COMPARE
Menominee
Immigrants from Guyana
Median Female Earnings
Median Female Earnings Comparison
Menominee
Immigrants from Guyana
$33,894
MEDIAN FEMALE EARNINGS
0.0/ 100
METRIC RATING
330th/ 347
METRIC RANK
$40,773
MEDIAN FEMALE EARNINGS
90.3/ 100
METRIC RATING
130th/ 347
METRIC RANK
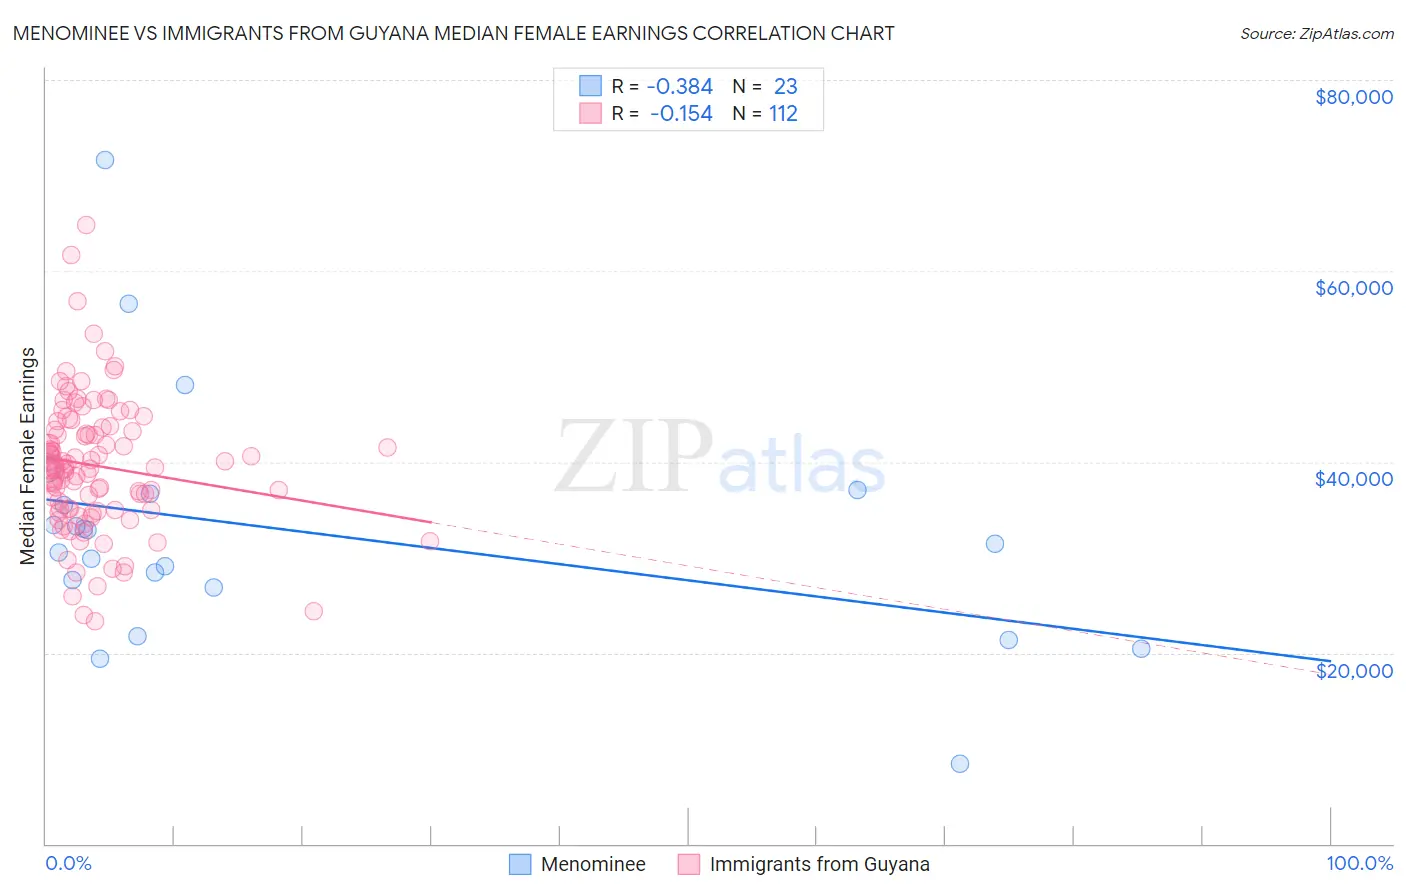
Menominee vs Immigrants from Guyana Median Female Earnings Correlation Chart
The statistical analysis conducted on geographies consisting of 45,775,261 people shows a mild negative correlation between the proportion of Menominee and median female earnings in the United States with a correlation coefficient (R) of -0.384 and weighted average of $33,894. Similarly, the statistical analysis conducted on geographies consisting of 183,689,123 people shows a poor negative correlation between the proportion of Immigrants from Guyana and median female earnings in the United States with a correlation coefficient (R) of -0.154 and weighted average of $40,773, a difference of 20.3%.
Median Female Earnings Correlation Summary
| Measurement | Menominee | Immigrants from Guyana |
| Minimum | $8,333 | $23,277 |
| Maximum | $71,591 | $64,779 |
| Range | $63,258 | $41,502 |
| Mean | $32,691 | $39,583 |
| Median | $31,453 | $39,337 |
| Interquartile 25% (IQ1) | $26,780 | $35,009 |
| Interquartile 75% (IQ3) | $36,632 | $43,513 |
| Interquartile Range (IQR) | $9,852 | $8,503 |
| Standard Deviation (Sample) | $12,945 | $7,079 |
| Standard Deviation (Population) | $12,660 | $7,048 |
Similar Demographics by Median Female Earnings
Demographics Similar to Menominee by Median Female Earnings
In terms of median female earnings, the demographic groups most similar to Menominee are Hopi ($33,932, a difference of 0.11%), Immigrants from Central America ($33,953, a difference of 0.17%), Native/Alaskan ($33,806, a difference of 0.26%), Choctaw ($33,775, a difference of 0.35%), and Cajun ($34,034, a difference of 0.41%).
| Demographics | Rating | Rank | Median Female Earnings |
| Seminole | 0.0 /100 | #323 | Tragic $34,385 |
| Immigrants | Congo | 0.0 /100 | #324 | Tragic $34,317 |
| Dutch West Indians | 0.0 /100 | #325 | Tragic $34,106 |
| Kiowa | 0.0 /100 | #326 | Tragic $34,074 |
| Cajuns | 0.0 /100 | #327 | Tragic $34,034 |
| Immigrants | Central America | 0.0 /100 | #328 | Tragic $33,953 |
| Hopi | 0.0 /100 | #329 | Tragic $33,932 |
| Menominee | 0.0 /100 | #330 | Tragic $33,894 |
| Natives/Alaskans | 0.0 /100 | #331 | Tragic $33,806 |
| Choctaw | 0.0 /100 | #332 | Tragic $33,775 |
| Mexicans | 0.0 /100 | #333 | Tragic $33,664 |
| Spanish American Indians | 0.0 /100 | #334 | Tragic $33,625 |
| Creek | 0.0 /100 | #335 | Tragic $33,437 |
| Ottawa | 0.0 /100 | #336 | Tragic $33,378 |
| Yakama | 0.0 /100 | #337 | Tragic $33,354 |
Demographics Similar to Immigrants from Guyana by Median Female Earnings
In terms of median female earnings, the demographic groups most similar to Immigrants from Guyana are Chilean ($40,757, a difference of 0.040%), Zimbabwean ($40,798, a difference of 0.060%), Immigrants from Uganda ($40,739, a difference of 0.080%), Syrian ($40,727, a difference of 0.11%), and Carpatho Rusyn ($40,825, a difference of 0.13%).
| Demographics | Rating | Rank | Median Female Earnings |
| Guyanese | 93.4 /100 | #123 | Exceptional $40,973 |
| Trinidadians and Tobagonians | 93.2 /100 | #124 | Exceptional $40,958 |
| Austrians | 92.7 /100 | #125 | Exceptional $40,923 |
| Immigrants | Trinidad and Tobago | 92.3 /100 | #126 | Exceptional $40,895 |
| Ugandans | 92.2 /100 | #127 | Exceptional $40,889 |
| Carpatho Rusyns | 91.2 /100 | #128 | Exceptional $40,825 |
| Zimbabweans | 90.8 /100 | #129 | Exceptional $40,798 |
| Immigrants | Guyana | 90.3 /100 | #130 | Exceptional $40,773 |
| Chileans | 90.0 /100 | #131 | Exceptional $40,757 |
| Immigrants | Uganda | 89.7 /100 | #132 | Excellent $40,739 |
| Syrians | 89.5 /100 | #133 | Excellent $40,727 |
| Arabs | 89.3 /100 | #134 | Excellent $40,718 |
| Immigrants | Nepal | 89.0 /100 | #135 | Excellent $40,704 |
| Immigrants | Eastern Africa | 87.7 /100 | #136 | Excellent $40,644 |
| Pakistanis | 86.6 /100 | #137 | Excellent $40,596 |