Israeli vs Immigrants from Venezuela Median Household Income
COMPARE
Israeli
Immigrants from Venezuela
Median Household Income
Median Household Income Comparison
Israelis
Immigrants from Venezuela
$96,552
MEDIAN HOUSEHOLD INCOME
99.9/ 100
METRIC RATING
45th/ 347
METRIC RANK
$81,506
MEDIAN HOUSEHOLD INCOME
9.0/ 100
METRIC RATING
220th/ 347
METRIC RANK
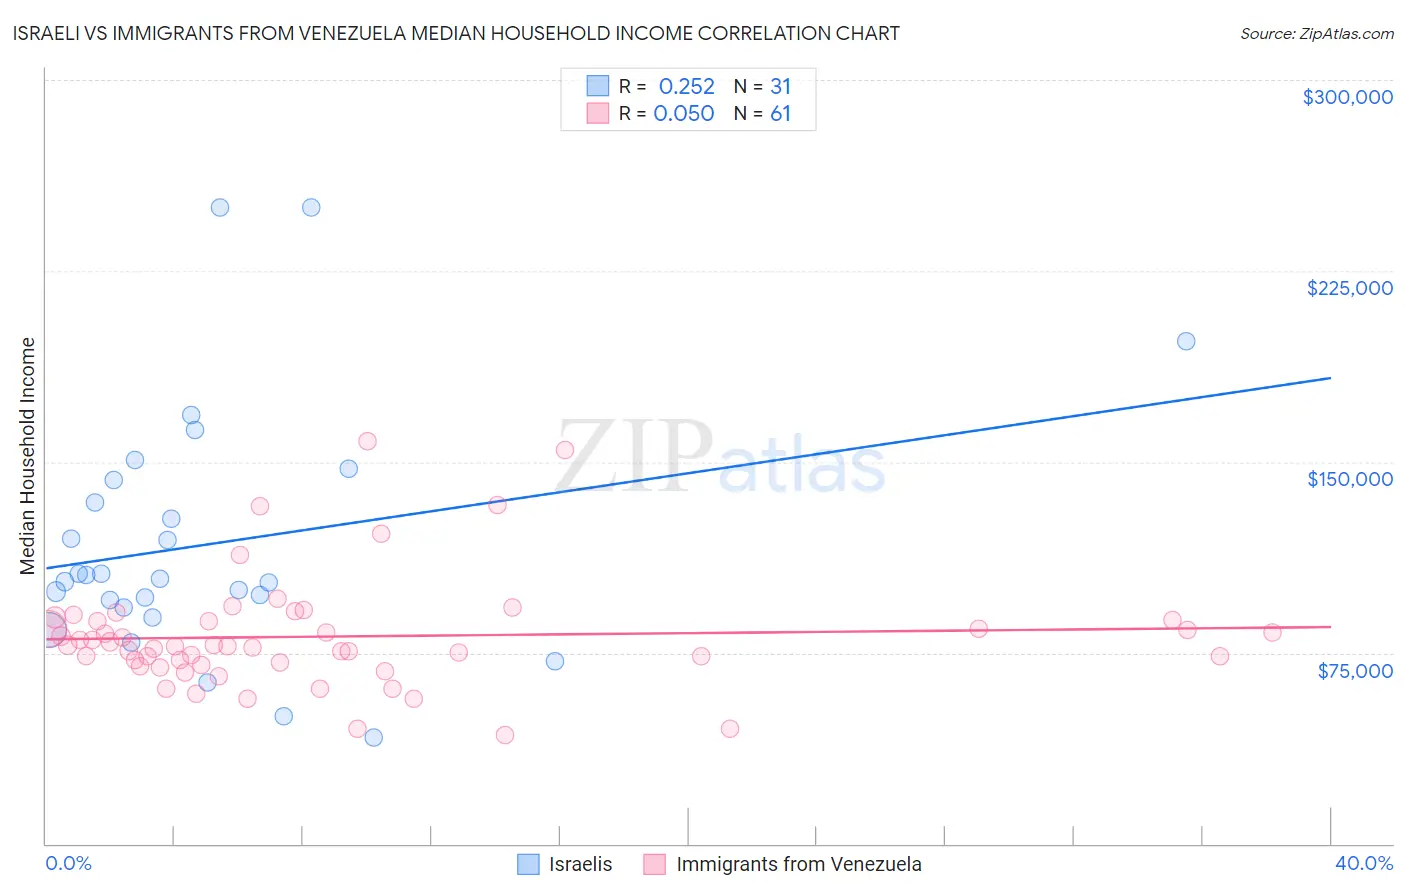
Israeli vs Immigrants from Venezuela Median Household Income Correlation Chart
The statistical analysis conducted on geographies consisting of 210,971,551 people shows a weak positive correlation between the proportion of Israelis and median household income in the United States with a correlation coefficient (R) of 0.252 and weighted average of $96,552. Similarly, the statistical analysis conducted on geographies consisting of 287,748,058 people shows a slight positive correlation between the proportion of Immigrants from Venezuela and median household income in the United States with a correlation coefficient (R) of 0.050 and weighted average of $81,506, a difference of 18.5%.
Median Household Income Correlation Summary
| Measurement | Israeli | Immigrants from Venezuela |
| Minimum | $41,875 | $42,664 |
| Maximum | $250,001 | $158,184 |
| Range | $208,126 | $115,520 |
| Mean | $117,996 | $81,402 |
| Median | $104,190 | $77,762 |
| Interquartile 25% (IQ1) | $92,986 | $70,867 |
| Interquartile 75% (IQ3) | $142,824 | $87,517 |
| Interquartile Range (IQR) | $49,838 | $16,650 |
| Standard Deviation (Sample) | $48,790 | $22,039 |
| Standard Deviation (Population) | $47,997 | $21,858 |
Similar Demographics by Median Household Income
Demographics Similar to Israelis by Median Household Income
In terms of median household income, the demographic groups most similar to Israelis are Australian ($96,490, a difference of 0.060%), Immigrants from Greece ($96,675, a difference of 0.13%), Immigrants from Russia ($96,378, a difference of 0.18%), Immigrants from France ($96,743, a difference of 0.20%), and Cambodian ($96,324, a difference of 0.24%).
| Demographics | Rating | Rank | Median Household Income |
| Immigrants | Indonesia | 100.0 /100 | #38 | Exceptional $97,297 |
| Afghans | 100.0 /100 | #39 | Exceptional $97,026 |
| Maltese | 100.0 /100 | #40 | Exceptional $97,015 |
| Immigrants | Turkey | 100.0 /100 | #41 | Exceptional $96,964 |
| Immigrants | Lithuania | 99.9 /100 | #42 | Exceptional $96,836 |
| Immigrants | France | 99.9 /100 | #43 | Exceptional $96,743 |
| Immigrants | Greece | 99.9 /100 | #44 | Exceptional $96,675 |
| Israelis | 99.9 /100 | #45 | Exceptional $96,552 |
| Australians | 99.9 /100 | #46 | Exceptional $96,490 |
| Immigrants | Russia | 99.9 /100 | #47 | Exceptional $96,378 |
| Cambodians | 99.9 /100 | #48 | Exceptional $96,324 |
| Immigrants | Malaysia | 99.9 /100 | #49 | Exceptional $96,292 |
| Bulgarians | 99.9 /100 | #50 | Exceptional $96,290 |
| Estonians | 99.9 /100 | #51 | Exceptional $95,930 |
| Immigrants | South Africa | 99.9 /100 | #52 | Exceptional $95,800 |
Demographics Similar to Immigrants from Venezuela by Median Household Income
In terms of median household income, the demographic groups most similar to Immigrants from Venezuela are Immigrants from Ghana ($81,489, a difference of 0.020%), Nigerian ($81,725, a difference of 0.27%), Immigrants from Nigeria ($81,236, a difference of 0.33%), Immigrants from El Salvador ($81,213, a difference of 0.36%), and Malaysian ($81,064, a difference of 0.54%).
| Demographics | Rating | Rank | Median Household Income |
| Nepalese | 15.1 /100 | #213 | Poor $82,410 |
| Panamanians | 14.0 /100 | #214 | Poor $82,272 |
| Vietnamese | 13.8 /100 | #215 | Poor $82,248 |
| Yugoslavians | 13.3 /100 | #216 | Poor $82,186 |
| Ecuadorians | 12.5 /100 | #217 | Poor $82,070 |
| Whites/Caucasians | 12.2 /100 | #218 | Poor $82,029 |
| Nigerians | 10.3 /100 | #219 | Poor $81,725 |
| Immigrants | Venezuela | 9.0 /100 | #220 | Tragic $81,506 |
| Immigrants | Ghana | 9.0 /100 | #221 | Tragic $81,489 |
| Immigrants | Nigeria | 7.7 /100 | #222 | Tragic $81,236 |
| Immigrants | El Salvador | 7.6 /100 | #223 | Tragic $81,213 |
| Malaysians | 7.0 /100 | #224 | Tragic $81,064 |
| Scotch-Irish | 6.6 /100 | #225 | Tragic $80,972 |
| Immigrants | Panama | 6.2 /100 | #226 | Tragic $80,873 |
| Guyanese | 5.7 /100 | #227 | Tragic $80,734 |