Inupiat vs Immigrants from Portugal Median Household Income
COMPARE
Inupiat
Immigrants from Portugal
Median Household Income
Median Household Income Comparison
Inupiat
Immigrants from Portugal
$78,841
MEDIAN HOUSEHOLD INCOME
1.8/ 100
METRIC RATING
245th/ 347
METRIC RANK
$84,740
MEDIAN HOUSEHOLD INCOME
44.2/ 100
METRIC RATING
180th/ 347
METRIC RANK
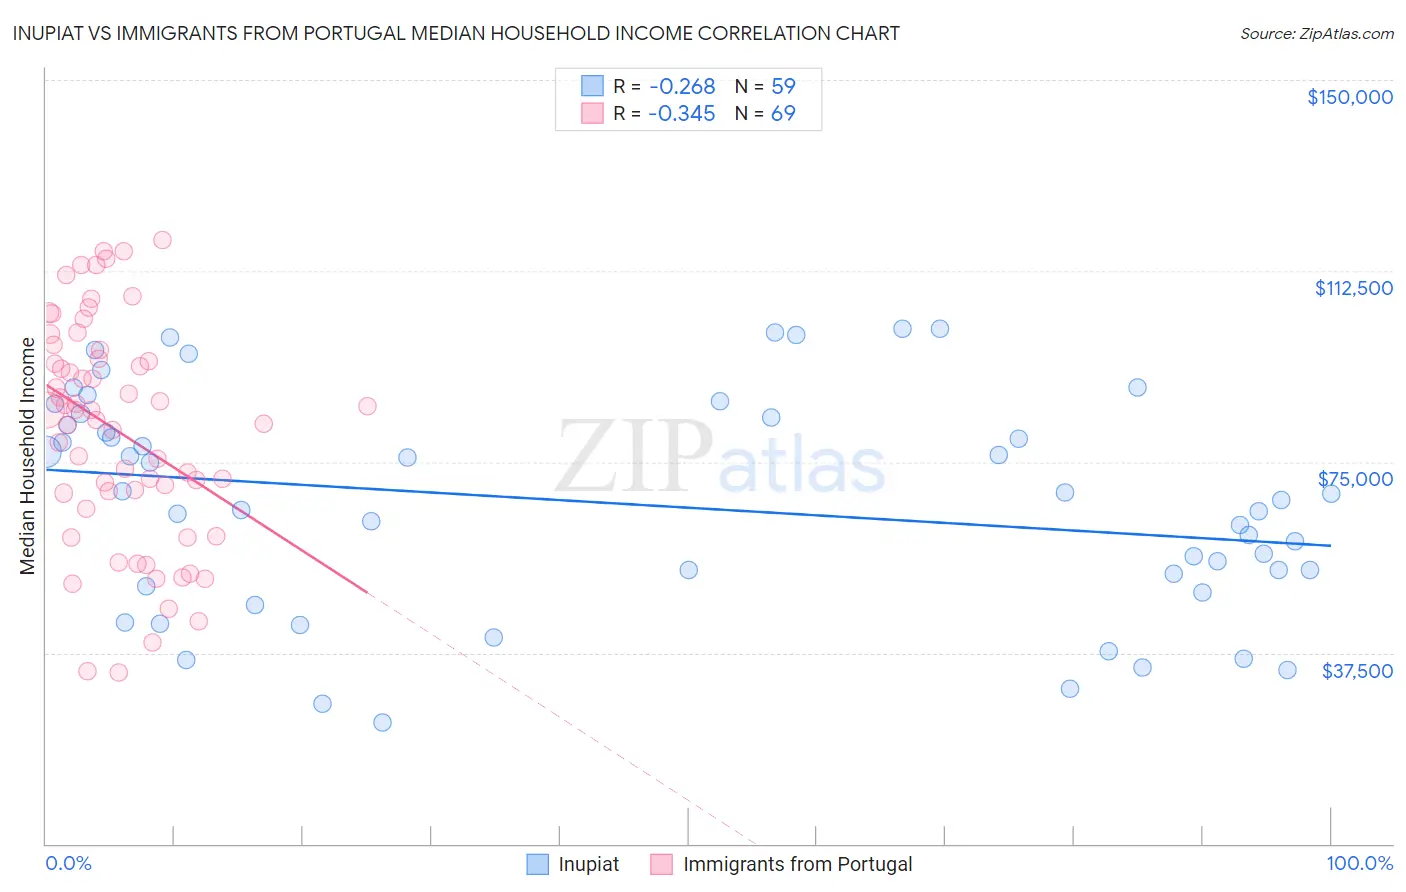
Inupiat vs Immigrants from Portugal Median Household Income Correlation Chart
The statistical analysis conducted on geographies consisting of 96,314,941 people shows a weak negative correlation between the proportion of Inupiat and median household income in the United States with a correlation coefficient (R) of -0.268 and weighted average of $78,841. Similarly, the statistical analysis conducted on geographies consisting of 174,758,543 people shows a mild negative correlation between the proportion of Immigrants from Portugal and median household income in the United States with a correlation coefficient (R) of -0.345 and weighted average of $84,740, a difference of 7.5%.
Median Household Income Correlation Summary
| Measurement | Inupiat | Immigrants from Portugal |
| Minimum | $23,889 | $33,750 |
| Maximum | $101,071 | $118,667 |
| Range | $77,182 | $84,917 |
| Mean | $66,659 | $80,926 |
| Median | $67,500 | $85,116 |
| Interquartile 25% (IQ1) | $50,572 | $67,289 |
| Interquartile 75% (IQ3) | $83,750 | $96,142 |
| Interquartile Range (IQR) | $33,178 | $28,853 |
| Standard Deviation (Sample) | $21,353 | $21,750 |
| Standard Deviation (Population) | $21,171 | $21,592 |
Similar Demographics by Median Household Income
Demographics Similar to Inupiat by Median Household Income
In terms of median household income, the demographic groups most similar to Inupiat are Central American ($78,803, a difference of 0.050%), Marshallese ($78,930, a difference of 0.11%), Immigrants from Barbados ($78,989, a difference of 0.19%), Immigrants from Burma/Myanmar ($78,682, a difference of 0.20%), and Immigrants from Sudan ($79,103, a difference of 0.33%).
| Demographics | Rating | Rank | Median Household Income |
| Barbadians | 3.0 /100 | #238 | Tragic $79,664 |
| Alaska Natives | 2.7 /100 | #239 | Tragic $79,509 |
| Immigrants | Western Africa | 2.7 /100 | #240 | Tragic $79,490 |
| Immigrants | Nonimmigrants | 2.6 /100 | #241 | Tragic $79,429 |
| Immigrants | Sudan | 2.1 /100 | #242 | Tragic $79,103 |
| Immigrants | Barbados | 1.9 /100 | #243 | Tragic $78,989 |
| Marshallese | 1.9 /100 | #244 | Tragic $78,930 |
| Inupiat | 1.8 /100 | #245 | Tragic $78,841 |
| Central Americans | 1.7 /100 | #246 | Tragic $78,803 |
| Immigrants | Burma/Myanmar | 1.6 /100 | #247 | Tragic $78,682 |
| Sudanese | 1.5 /100 | #248 | Tragic $78,529 |
| West Indians | 1.4 /100 | #249 | Tragic $78,455 |
| Immigrants | Laos | 1.3 /100 | #250 | Tragic $78,327 |
| Mexican American Indians | 1.2 /100 | #251 | Tragic $78,166 |
| Immigrants | West Indies | 1.0 /100 | #252 | Tragic $77,956 |
Demographics Similar to Immigrants from Portugal by Median Household Income
In terms of median household income, the demographic groups most similar to Immigrants from Portugal are Hawaiian ($84,729, a difference of 0.010%), Uruguayan ($84,691, a difference of 0.060%), Spaniard ($84,644, a difference of 0.11%), English ($84,915, a difference of 0.21%), and Czechoslovakian ($84,965, a difference of 0.27%).
| Demographics | Rating | Rank | Median Household Income |
| Immigrants | Cameroon | 53.4 /100 | #173 | Average $85,314 |
| Scottish | 50.0 /100 | #174 | Average $85,101 |
| Immigrants | Costa Rica | 49.2 /100 | #175 | Average $85,054 |
| Alsatians | 49.2 /100 | #176 | Average $85,053 |
| Immigrants | Eritrea | 48.8 /100 | #177 | Average $85,025 |
| Czechoslovakians | 47.8 /100 | #178 | Average $84,965 |
| English | 47.0 /100 | #179 | Average $84,915 |
| Immigrants | Portugal | 44.2 /100 | #180 | Average $84,740 |
| Hawaiians | 44.1 /100 | #181 | Average $84,729 |
| Uruguayans | 43.5 /100 | #182 | Average $84,691 |
| Spaniards | 42.7 /100 | #183 | Average $84,644 |
| Immigrants | Eastern Africa | 37.4 /100 | #184 | Fair $84,299 |
| Kenyans | 34.2 /100 | #185 | Fair $84,085 |
| Puget Sound Salish | 33.2 /100 | #186 | Fair $84,011 |
| Belgians | 33.2 /100 | #187 | Fair $84,008 |