Inupiat vs Immigrants from Dominica Median Household Income
COMPARE
Inupiat
Immigrants from Dominica
Median Household Income
Median Household Income Comparison
Inupiat
Immigrants from Dominica
$78,841
MEDIAN HOUSEHOLD INCOME
1.8/ 100
METRIC RATING
245th/ 347
METRIC RANK
$72,760
MEDIAN HOUSEHOLD INCOME
0.0/ 100
METRIC RATING
300th/ 347
METRIC RANK
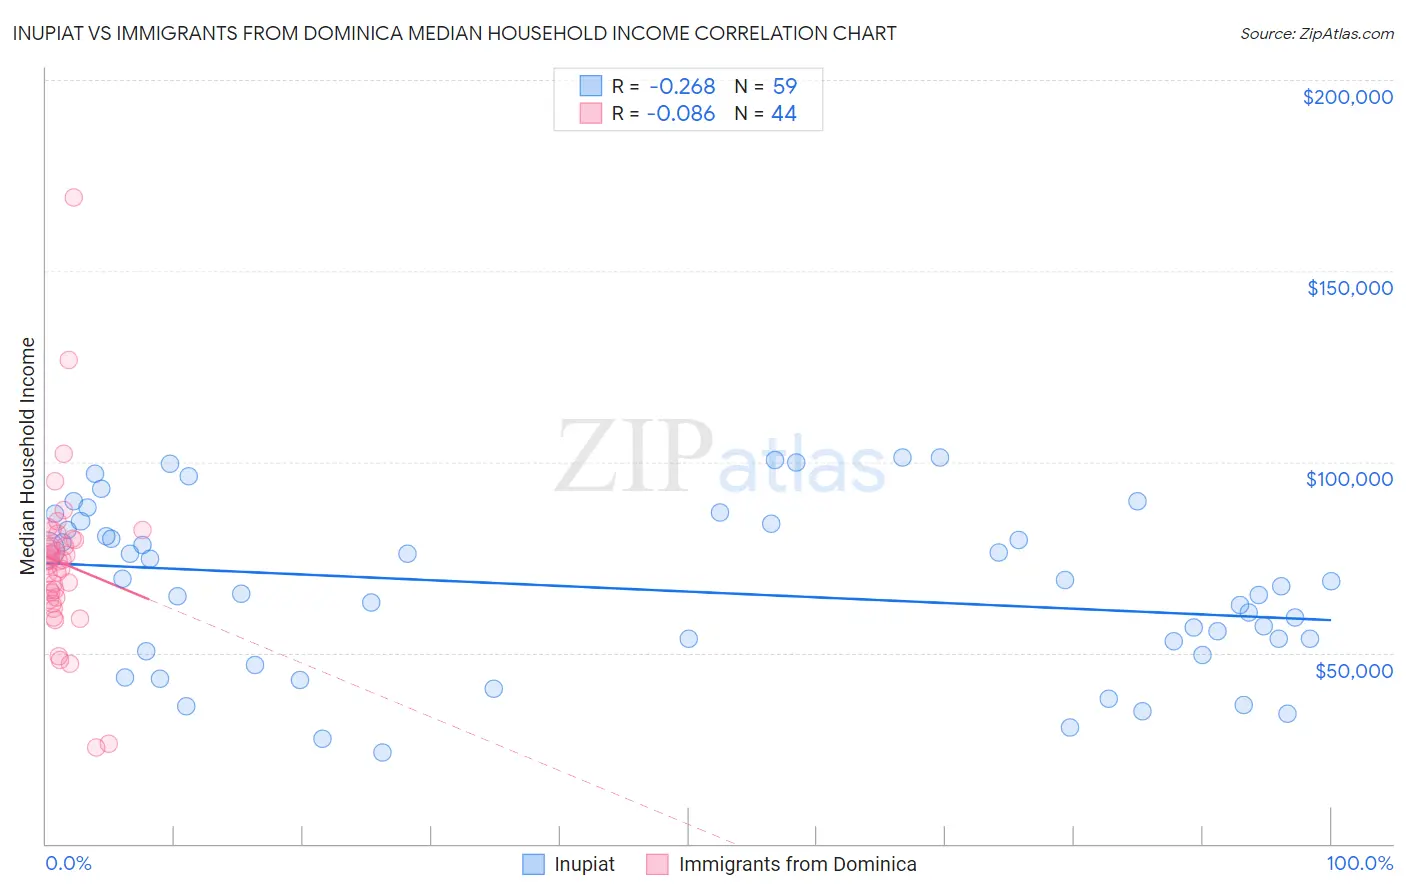
Inupiat vs Immigrants from Dominica Median Household Income Correlation Chart
The statistical analysis conducted on geographies consisting of 96,314,941 people shows a weak negative correlation between the proportion of Inupiat and median household income in the United States with a correlation coefficient (R) of -0.268 and weighted average of $78,841. Similarly, the statistical analysis conducted on geographies consisting of 83,788,429 people shows a slight negative correlation between the proportion of Immigrants from Dominica and median household income in the United States with a correlation coefficient (R) of -0.086 and weighted average of $72,760, a difference of 8.4%.
Median Household Income Correlation Summary
| Measurement | Inupiat | Immigrants from Dominica |
| Minimum | $23,889 | $25,050 |
| Maximum | $101,071 | $169,141 |
| Range | $77,182 | $144,091 |
| Mean | $66,659 | $73,512 |
| Median | $67,500 | $74,253 |
| Interquartile 25% (IQ1) | $50,572 | $64,327 |
| Interquartile 75% (IQ3) | $83,750 | $79,686 |
| Interquartile Range (IQR) | $33,178 | $15,359 |
| Standard Deviation (Sample) | $21,353 | $22,542 |
| Standard Deviation (Population) | $21,171 | $22,284 |
Similar Demographics by Median Household Income
Demographics Similar to Inupiat by Median Household Income
In terms of median household income, the demographic groups most similar to Inupiat are Central American ($78,803, a difference of 0.050%), Marshallese ($78,930, a difference of 0.11%), Immigrants from Barbados ($78,989, a difference of 0.19%), Immigrants from Burma/Myanmar ($78,682, a difference of 0.20%), and Immigrants from Sudan ($79,103, a difference of 0.33%).
| Demographics | Rating | Rank | Median Household Income |
| Barbadians | 3.0 /100 | #238 | Tragic $79,664 |
| Alaska Natives | 2.7 /100 | #239 | Tragic $79,509 |
| Immigrants | Western Africa | 2.7 /100 | #240 | Tragic $79,490 |
| Immigrants | Nonimmigrants | 2.6 /100 | #241 | Tragic $79,429 |
| Immigrants | Sudan | 2.1 /100 | #242 | Tragic $79,103 |
| Immigrants | Barbados | 1.9 /100 | #243 | Tragic $78,989 |
| Marshallese | 1.9 /100 | #244 | Tragic $78,930 |
| Inupiat | 1.8 /100 | #245 | Tragic $78,841 |
| Central Americans | 1.7 /100 | #246 | Tragic $78,803 |
| Immigrants | Burma/Myanmar | 1.6 /100 | #247 | Tragic $78,682 |
| Sudanese | 1.5 /100 | #248 | Tragic $78,529 |
| West Indians | 1.4 /100 | #249 | Tragic $78,455 |
| Immigrants | Laos | 1.3 /100 | #250 | Tragic $78,327 |
| Mexican American Indians | 1.2 /100 | #251 | Tragic $78,166 |
| Immigrants | West Indies | 1.0 /100 | #252 | Tragic $77,956 |
Demographics Similar to Immigrants from Dominica by Median Household Income
In terms of median household income, the demographic groups most similar to Immigrants from Dominica are Cherokee ($72,682, a difference of 0.11%), Indonesian ($72,856, a difference of 0.13%), Shoshone ($72,660, a difference of 0.14%), African ($72,650, a difference of 0.15%), and Immigrants from Haiti ($72,599, a difference of 0.22%).
| Demographics | Rating | Rank | Median Household Income |
| Immigrants | Cabo Verde | 0.1 /100 | #293 | Tragic $73,515 |
| Blackfeet | 0.1 /100 | #294 | Tragic $73,509 |
| Cubans | 0.1 /100 | #295 | Tragic $73,392 |
| Haitians | 0.1 /100 | #296 | Tragic $73,306 |
| Immigrants | Mexico | 0.0 /100 | #297 | Tragic $73,160 |
| Paiute | 0.0 /100 | #298 | Tragic $72,959 |
| Indonesians | 0.0 /100 | #299 | Tragic $72,856 |
| Immigrants | Dominica | 0.0 /100 | #300 | Tragic $72,760 |
| Cherokee | 0.0 /100 | #301 | Tragic $72,682 |
| Shoshone | 0.0 /100 | #302 | Tragic $72,660 |
| Africans | 0.0 /100 | #303 | Tragic $72,650 |
| Immigrants | Haiti | 0.0 /100 | #304 | Tragic $72,599 |
| Hondurans | 0.0 /100 | #305 | Tragic $72,588 |
| Potawatomi | 0.0 /100 | #306 | Tragic $72,576 |
| Ute | 0.0 /100 | #307 | Tragic $72,402 |