Indian (Asian) vs Pueblo Median Household Income

COMPARE

Indian (Asian)
Race
Ancestry
AfghanAfricanAlaska NativeAlaskan AthabascanAlbanianAleutAlsatianAmericanApacheArabArapahoArgentineanArmenianAssyrian/Chaldean/SyriacAustralianAustrianBahamianBangladeshiBarbadianBasqueBelgianBelizeanBermudanBhutaneseBlackfeetBolivianBrazilianBritishBritish West IndianBulgarianBurmeseCajunCambodianCanadianCape VerdeanCarpatho RusynCelticCentral AmericanCentral American IndianCherokeeCheyenneChickasawChileanChineseChippewaChoctawColombianColvilleComancheCosta RicanCreeCreekCroatianCrowCubanCypriotCzechCzechoslovakianDanishDelawareDominicanDutchDutch West IndianEastern EuropeanEcuadorianEgyptianEnglishEstonianEthiopianEuropeanFijianFilipinoFinnishFrenchFrench American IndianFrench CanadianGermanGerman RussianGhanaianGreekGuamanian/ChamorroGuatemalanGuyaneseHaitianHmongHonduranHopiHoumaHungarianIcelanderIndian (Asian)IndonesianInupiatIranianIraqiIrishIroquoisIsraeliItalianJamaicanJapaneseJordanianKenyanKiowaKoreanLaotianLatvianLebaneseLiberianLithuanianLumbeeLuxembourgerMacedonianMalaysianMalteseMarshalleseMenomineeMexicanMexican American IndianMongolianMoroccanNative HawaiianNavajoNepaleseNew ZealanderNicaraguanNigerianNorthern EuropeanNorwegianOkinawanOsageOttawaPaiutePakistaniPalestinianPanamanianParaguayanPennsylvania GermanPeruvianPimaPolishPortuguesePotawatomiPuerto RicanPuget Sound SalishRomanianRussianSalvadoranSamoanScandinavianScotch-IrishScottishSeminoleSenegaleseSerbianShoshoneSierra LeoneanSiouxSlavicSlovakSloveneSomaliSouth AfricanSouth AmericanSouth American IndianSoviet UnionSpaniardSpanishSpanish AmericanSpanish American IndianSri LankanSubsaharan AfricanSudaneseSwedishSwissSyrianTaiwaneseThaiTlingit-HaidaTohono O'OdhamTonganTrinidadian and TobagonianTsimshianTurkishU.S. Virgin IslanderUgandanUkrainianUruguayanUteVenezuelanVietnameseWelshWest IndianYakamaYaquiYugoslavianYumanYup'ikZimbabwean
Immigration
NonimmigrantsImmigrantsAfghanistanAfricaAlbaniaArgentinaArmeniaAsiaAustraliaAustriaBahamasBangladeshBarbadosBelarusBelgiumBelizeBoliviaBosnia and HerzegovinaBrazilBulgariaBurma/MyanmarCabo VerdeCambodiaCameroonCanadaCaribbeanCentral AmericaChileChinaColombiaCongoCosta RicaCroatiaCubaCzechoslovakiaDenmarkDominicaDominican RepublicEastern AfricaEastern AsiaEastern EuropeEcuadorEgyptEl SalvadorEnglandEritreaEthiopiaEuropeFijiFranceGermanyGhanaGreeceGrenadaGuatemalaGuyanaHaitiHondurasHong KongHungaryIndiaIndonesiaIranIraqIrelandIsraelItalyJamaicaJapanJordanKazakhstanKenyaKoreaKuwaitLaosLatin AmericaLatviaLebanonLiberiaLithuaniaMalaysiaMexicoMicronesiaMiddle AfricaMoldovaMoroccoNepalNetherlandsNicaraguaNigeriaNorth AmericaNorth MacedoniaNorthern AfricaNorthern EuropeNorwayOceaniaPakistanPanamaPeruPhilippinesPolandPortugalRomaniaRussiaSaudi ArabiaScotlandSenegalSerbiaSierra LeoneSingaporeSomaliaSouth AfricaSouth AmericaSouth Central AsiaSouth Eastern AsiaSouthern EuropeSpainSri LankaSt. Vincent and the GrenadinesSudanSwedenSwitzerlandSyriaTaiwanThailandTrinidad and TobagoTurkeyUgandaUkraineUruguayUzbekistanVenezuelaVietnamWest IndiesWestern AfricaWestern AsiaWestern EuropeYemenZaireZimbabweAzores
Pueblo
Race
Ancestry
AfghanAfricanAlaska NativeAlaskan AthabascanAlbanianAleutAlsatianAmericanApacheArabArapahoArgentineanArmenianAssyrian/Chaldean/SyriacAustralianAustrianBahamianBangladeshiBarbadianBasqueBelgianBelizeanBermudanBhutaneseBlackfeetBolivianBrazilianBritishBritish West IndianBulgarianBurmeseCajunCambodianCanadianCape VerdeanCarpatho RusynCelticCentral AmericanCentral American IndianCherokeeCheyenneChickasawChileanChineseChippewaChoctawColombianColvilleComancheCosta RicanCreeCreekCroatianCrowCubanCypriotCzechCzechoslovakianDanishDelawareDominicanDutchDutch West IndianEastern EuropeanEcuadorianEgyptianEnglishEstonianEthiopianEuropeanFijianFilipinoFinnishFrenchFrench American IndianFrench CanadianGermanGerman RussianGhanaianGreekGuamanian/ChamorroGuatemalanGuyaneseHaitianHmongHonduranHopiHoumaHungarianIcelanderIndonesianInupiatIranianIraqiIrishIroquoisIsraeliItalianJamaicanJapaneseJordanianKenyanKiowaKoreanLaotianLatvianLebaneseLiberianLithuanianLumbeeLuxembourgerMacedonianMalaysianMalteseMarshalleseMenomineeMexicanMexican American IndianMongolianMoroccanNative HawaiianNavajoNepaleseNew ZealanderNicaraguanNigerianNorthern EuropeanNorwegianOkinawanOsageOttawaPaiutePakistaniPalestinianPanamanianParaguayanPennsylvania GermanPeruvianPimaPolishPortuguesePotawatomiPuebloPuerto RicanPuget Sound SalishRomanianRussianSalvadoranSamoanScandinavianScotch-IrishScottishSeminoleSenegaleseSerbianShoshoneSierra LeoneanSiouxSlavicSlovakSloveneSomaliSouth AfricanSouth AmericanSouth American IndianSoviet UnionSpaniardSpanishSpanish AmericanSpanish American IndianSri LankanSubsaharan AfricanSudaneseSwedishSwissSyrianTaiwaneseThaiTlingit-HaidaTohono O'OdhamTonganTrinidadian and TobagonianTsimshianTurkishU.S. Virgin IslanderUgandanUkrainianUruguayanUteVenezuelanVietnameseWelshWest IndianYakamaYaquiYugoslavianYumanYup'ikZimbabwean
Immigration
NonimmigrantsImmigrantsAfghanistanAfricaAlbaniaArgentinaArmeniaAsiaAustraliaAustriaBahamasBangladeshBarbadosBelarusBelgiumBelizeBoliviaBosnia and HerzegovinaBrazilBulgariaBurma/MyanmarCabo VerdeCambodiaCameroonCanadaCaribbeanCentral AmericaChileChinaColombiaCongoCosta RicaCroatiaCubaCzechoslovakiaDenmarkDominicaDominican RepublicEastern AfricaEastern AsiaEastern EuropeEcuadorEgyptEl SalvadorEnglandEritreaEthiopiaEuropeFijiFranceGermanyGhanaGreeceGrenadaGuatemalaGuyanaHaitiHondurasHong KongHungaryIndiaIndonesiaIranIraqIrelandIsraelItalyJamaicaJapanJordanKazakhstanKenyaKoreaKuwaitLaosLatin AmericaLatviaLebanonLiberiaLithuaniaMalaysiaMexicoMicronesiaMiddle AfricaMoldovaMoroccoNepalNetherlandsNicaraguaNigeriaNorth AmericaNorth MacedoniaNorthern AfricaNorthern EuropeNorwayOceaniaPakistanPanamaPeruPhilippinesPolandPortugalRomaniaRussiaSaudi ArabiaScotlandSenegalSerbiaSierra LeoneSingaporeSomaliaSouth AfricaSouth AmericaSouth Central AsiaSouth Eastern AsiaSouthern EuropeSpainSri LankaSt. Vincent and the GrenadinesSudanSwedenSwitzerlandSyriaTaiwanThailandTrinidad and TobagoTurkeyUgandaUkraineUruguayUzbekistanVenezuelaVietnamWest IndiesWestern AfricaWestern AsiaWestern EuropeYemenZaireZimbabweAzores
Median Household Income
Income
Poverty
Unemployment
Labor Participation
Family Structure
Vehicle Availability
Education Level
Disability

Median Household Income Comparison

Indians (Asian)

Pueblo

Exceptional
Tragic
$105,262
MEDIAN HOUSEHOLD INCOME
100.0/ 100
METRIC RATING
12th/ 347
METRIC RANK
$64,692
MEDIAN HOUSEHOLD INCOME
0.0/ 100
METRIC RATING
340th/ 347
METRIC RANK

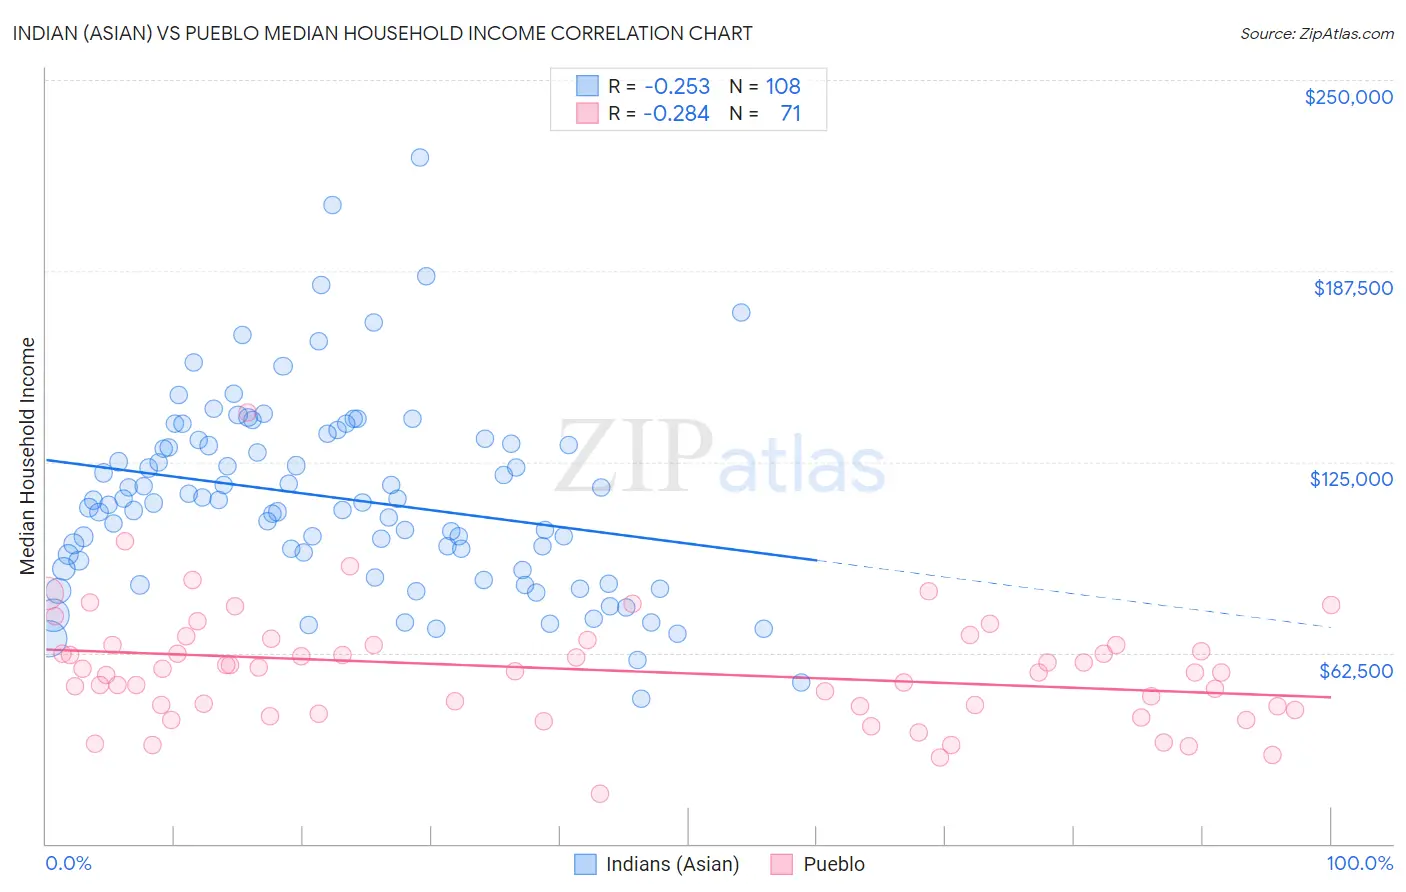
Indian (Asian) vs Pueblo Median Household Income Correlation Chart

The statistical analysis conducted on geographies consisting of 494,532,621 people shows a weak negative correlation between the proportion of Indians (Asian) and median household income in the United States with a correlation coefficient (R) of -0.253 and weighted average of $105,262. Similarly, the statistical analysis conducted on geographies consisting of 120,058,820 people shows a weak negative correlation between the proportion of Pueblo and median household income in the United States with a correlation coefficient (R) of -0.284 and weighted average of $64,692, a difference of 62.7%.
Indian (Asian) vs Pueblo Median Household Income

Median Household Income Correlation Summary

MeasurementIndian (Asian)Pueblo
Minimum$47,386$16,250
Maximum$224,427$141,139
Range$177,041$124,889
Mean$113,272$56,992
Median$111,615$56,397
Interquartile 25% (IQ1)$91,317$44,868
Interquartile 75% (IQ3)$131,580$65,216
Interquartile Range (IQR)$40,263$20,348
Standard Deviation (Sample)$31,514$19,041
Standard Deviation (Population)$31,368$18,906

Similar Demographics by Median Household Income

Demographics Similar to Indians (Asian) by Median Household Income

In terms of median household income, the demographic groups most similar to Indians (Asian) are Immigrants from China ($105,335, a difference of 0.070%), Immigrants from Eastern Asia ($104,796, a difference of 0.45%), Immigrants from Ireland ($104,692, a difference of 0.54%), Immigrants from South Central Asia ($106,057, a difference of 0.76%), and Immigrants from Israel ($104,090, a difference of 1.1%).
DemographicsRating | RankMedian Household Income
Thais
100.0
/100
|
#5
Exceptional
$110,648
Immigrants | Singapore
100.0
/100
|
#6
Exceptional
$110,428
Iranians
100.0
/100
|
#7
Exceptional
$109,835
Immigrants | Iran
100.0
/100
|
#8
Exceptional
$108,055
Okinawans
100.0
/100
|
#9
Exceptional
$106,624
Immigrants | South Central Asia
100.0
/100
|
#10
Exceptional
$106,057
Immigrants | China
100.0
/100
|
#11
Exceptional
$105,335
Indians (Asian)
100.0
/100
|
#12
Exceptional
$105,262
Immigrants | Eastern Asia
100.0
/100
|
#13
Exceptional
$104,796
Immigrants | Ireland
100.0
/100
|
#14
Exceptional
$104,692
Immigrants | Israel
100.0
/100
|
#15
Exceptional
$104,090
Burmese
100.0
/100
|
#16
Exceptional
$103,145
Immigrants | Korea
100.0
/100
|
#17
Exceptional
$102,962
Cypriots
100.0
/100
|
#18
Exceptional
$102,843
Immigrants | Australia
100.0
/100
|
#19
Exceptional
$102,562

Demographics Similar to Pueblo by Median Household Income

In terms of median household income, the demographic groups most similar to Pueblo are Hopi ($65,043, a difference of 0.54%), Immigrants from Yemen ($65,194, a difference of 0.78%), Crow ($63,681, a difference of 1.6%), Kiowa ($65,914, a difference of 1.9%), and Pima ($63,262, a difference of 2.3%).
DemographicsRating | RankMedian Household Income
Creek
0.0
/100
|
#333
Tragic
$67,715
Blacks/African Americans
0.0
/100
|
#334
Tragic
$67,573
Cheyenne
0.0
/100
|
#335
Tragic
$66,974
Immigrants | Congo
0.0
/100
|
#336
Tragic
$66,768
Kiowa
0.0
/100
|
#337
Tragic
$65,914
Immigrants | Yemen
0.0
/100
|
#338
Tragic
$65,194
Hopi
0.0
/100
|
#339
Tragic
$65,043
Pueblo
0.0
/100
|
#340
Tragic
$64,692
Crow
0.0
/100
|
#341
Tragic
$63,681
Pima
0.0
/100
|
#342
Tragic
$63,262
Houma
0.0
/100
|
#343
Tragic
$62,575
Tohono O'odham
0.0
/100
|
#344
Tragic
$61,663
Puerto Ricans
0.0
/100
|
#345
Tragic
$59,197
Navajo
0.0
/100
|
#346
Tragic
$59,159
Lumbee
0.0
/100
|
#347
Tragic
$54,644