Immigrants from Thailand vs Albanian Householder Income Ages 25 - 44 years

COMPARE

Immigrants from Thailand
Race
Ancestry
AfghanAfricanAlaska NativeAlaskan AthabascanAleutAlsatianAmericanApacheArabArapahoArgentineanArmenianAssyrian/Chaldean/SyriacAustralianAustrianBahamianBangladeshiBarbadianBasqueBelgianBelizeanBermudanBhutaneseBlackfeetBolivianBrazilianBritishBritish West IndianBulgarianBurmeseCajunCambodianCanadianCape VerdeanCarpatho RusynCelticCentral AmericanCentral American IndianCherokeeCheyenneChickasawChileanChineseChippewaChoctawColombianColvilleComancheCosta RicanCreeCreekCroatianCrowCubanCypriotCzechCzechoslovakianDanishDelawareDominicanDutchDutch West IndianEastern EuropeanEcuadorianEgyptianEnglishEstonianEthiopianEuropeanFijianFilipinoFinnishFrenchFrench American IndianFrench CanadianGermanGerman RussianGhanaianGreekGuamanian/ChamorroGuatemalanGuyaneseHaitianHmongHonduranHopiHoumaHungarianIcelanderIndian (Asian)IndonesianInupiatIranianIraqiIrishIroquoisIsraeliItalianJamaicanJapaneseJordanianKenyanKiowaKoreanLaotianLatvianLebaneseLiberianLithuanianLumbeeLuxembourgerMacedonianMalaysianMalteseMarshalleseMenomineeMexicanMexican American IndianMongolianMoroccanNative HawaiianNavajoNepaleseNew ZealanderNicaraguanNigerianNorthern EuropeanNorwegianOkinawanOsageOttawaPaiutePakistaniPalestinianPanamanianParaguayanPennsylvania GermanPeruvianPimaPolishPortuguesePotawatomiPuebloPuerto RicanPuget Sound SalishRomanianRussianSalvadoranSamoanScandinavianScotch-IrishScottishSeminoleSenegaleseSerbianShoshoneSierra LeoneanSiouxSlavicSlovakSloveneSomaliSouth AfricanSouth AmericanSouth American IndianSoviet UnionSpaniardSpanishSpanish AmericanSpanish American IndianSri LankanSubsaharan AfricanSudaneseSwedishSwissSyrianTaiwaneseThaiTlingit-HaidaTohono O'OdhamTonganTrinidadian and TobagonianTsimshianTurkishU.S. Virgin IslanderUgandanUkrainianUruguayanUteVenezuelanVietnameseWelshWest IndianYakamaYaquiYugoslavianYumanYup'ikZimbabwean
Immigration
NonimmigrantsImmigrantsAfghanistanAfricaAlbaniaArgentinaArmeniaAsiaAustraliaAustriaBahamasBangladeshBarbadosBelarusBelgiumBelizeBoliviaBosnia and HerzegovinaBrazilBulgariaBurma/MyanmarCabo VerdeCambodiaCameroonCanadaCaribbeanCentral AmericaChileChinaColombiaCongoCosta RicaCroatiaCubaCzechoslovakiaDenmarkDominicaDominican RepublicEastern AfricaEastern AsiaEastern EuropeEcuadorEgyptEl SalvadorEnglandEritreaEthiopiaEuropeFijiFranceGermanyGhanaGreeceGrenadaGuatemalaGuyanaHaitiHondurasHong KongHungaryIndiaIndonesiaIranIraqIrelandIsraelItalyJamaicaJapanJordanKazakhstanKenyaKoreaKuwaitLaosLatin AmericaLatviaLebanonLiberiaLithuaniaMalaysiaMexicoMicronesiaMiddle AfricaMoldovaMoroccoNepalNetherlandsNicaraguaNigeriaNorth AmericaNorth MacedoniaNorthern AfricaNorthern EuropeNorwayOceaniaPakistanPanamaPeruPhilippinesPolandPortugalRomaniaRussiaSaudi ArabiaScotlandSenegalSerbiaSierra LeoneSingaporeSomaliaSouth AfricaSouth AmericaSouth Central AsiaSouth Eastern AsiaSouthern EuropeSpainSri LankaSt. Vincent and the GrenadinesSudanSwedenSwitzerlandSyriaTaiwanThailandTrinidad and TobagoTurkeyUgandaUkraineUruguayUzbekistanVenezuelaVietnamWest IndiesWestern AfricaWestern AsiaWestern EuropeYemenZaireZimbabweAzores
Albanian
Race
Ancestry
AfghanAfricanAlaska NativeAlaskan AthabascanAlbanianAleutAlsatianAmericanApacheArabArapahoArgentineanArmenianAssyrian/Chaldean/SyriacAustralianAustrianBahamianBangladeshiBarbadianBasqueBelgianBelizeanBermudanBhutaneseBlackfeetBolivianBrazilianBritishBritish West IndianBulgarianBurmeseCajunCambodianCanadianCape VerdeanCarpatho RusynCelticCentral AmericanCentral American IndianCherokeeCheyenneChickasawChileanChineseChippewaChoctawColombianColvilleComancheCosta RicanCreeCreekCroatianCrowCubanCypriotCzechCzechoslovakianDanishDelawareDominicanDutchDutch West IndianEastern EuropeanEcuadorianEgyptianEnglishEstonianEthiopianEuropeanFijianFilipinoFinnishFrenchFrench American IndianFrench CanadianGermanGerman RussianGhanaianGreekGuamanian/ChamorroGuatemalanGuyaneseHaitianHmongHonduranHopiHoumaHungarianIcelanderIndian (Asian)IndonesianInupiatIranianIraqiIrishIroquoisIsraeliItalianJamaicanJapaneseJordanianKenyanKiowaKoreanLaotianLatvianLebaneseLiberianLithuanianLumbeeLuxembourgerMacedonianMalaysianMalteseMarshalleseMenomineeMexicanMexican American IndianMongolianMoroccanNative HawaiianNavajoNepaleseNew ZealanderNicaraguanNigerianNorthern EuropeanNorwegianOkinawanOsageOttawaPaiutePakistaniPalestinianPanamanianParaguayanPennsylvania GermanPeruvianPimaPolishPortuguesePotawatomiPuebloPuerto RicanPuget Sound SalishRomanianRussianSalvadoranSamoanScandinavianScotch-IrishScottishSeminoleSenegaleseSerbianShoshoneSierra LeoneanSiouxSlavicSlovakSloveneSomaliSouth AfricanSouth AmericanSouth American IndianSoviet UnionSpaniardSpanishSpanish AmericanSpanish American IndianSri LankanSubsaharan AfricanSudaneseSwedishSwissSyrianTaiwaneseThaiTlingit-HaidaTohono O'OdhamTonganTrinidadian and TobagonianTsimshianTurkishU.S. Virgin IslanderUgandanUkrainianUruguayanUteVenezuelanVietnameseWelshWest IndianYakamaYaquiYugoslavianYumanYup'ikZimbabwean
Immigration
NonimmigrantsImmigrantsAfghanistanAfricaAlbaniaArgentinaArmeniaAsiaAustraliaAustriaBahamasBangladeshBarbadosBelarusBelgiumBelizeBoliviaBosnia and HerzegovinaBrazilBulgariaBurma/MyanmarCabo VerdeCambodiaCameroonCanadaCaribbeanCentral AmericaChileChinaColombiaCongoCosta RicaCroatiaCubaCzechoslovakiaDenmarkDominicaDominican RepublicEastern AfricaEastern AsiaEastern EuropeEcuadorEgyptEl SalvadorEnglandEritreaEthiopiaEuropeFijiFranceGermanyGhanaGreeceGrenadaGuatemalaGuyanaHaitiHondurasHong KongHungaryIndiaIndonesiaIranIraqIrelandIsraelItalyJamaicaJapanJordanKazakhstanKenyaKoreaKuwaitLaosLatin AmericaLatviaLebanonLiberiaLithuaniaMalaysiaMexicoMicronesiaMiddle AfricaMoldovaMoroccoNepalNetherlandsNicaraguaNigeriaNorth AmericaNorth MacedoniaNorthern AfricaNorthern EuropeNorwayOceaniaPakistanPanamaPeruPhilippinesPolandPortugalRomaniaRussiaSaudi ArabiaScotlandSenegalSerbiaSierra LeoneSingaporeSomaliaSouth AfricaSouth AmericaSouth Central AsiaSouth Eastern AsiaSouthern EuropeSpainSri LankaSt. Vincent and the GrenadinesSudanSwedenSwitzerlandSyriaTaiwanTrinidad and TobagoTurkeyUgandaUkraineUruguayUzbekistanVenezuelaVietnamWest IndiesWestern AfricaWestern AsiaWestern EuropeYemenZaireZimbabweAzores
Householder Income Ages 25 - 44 years
Income
Poverty
Unemployment
Labor Participation
Family Structure
Vehicle Availability
Education Level
Disability

Householder Income Ages 25 - 44 years Comparison

Immigrants from Thailand

Albanians

Poor
Exceptional
$91,337
HOUSEHOLDER INCOME AGES 25 - 44 YEARS
14.3/ 100
METRIC RATING
208th/ 347
METRIC RANK
$101,367
HOUSEHOLDER INCOME AGES 25 - 44 YEARS
97.8/ 100
METRIC RATING
101st/ 347
METRIC RANK

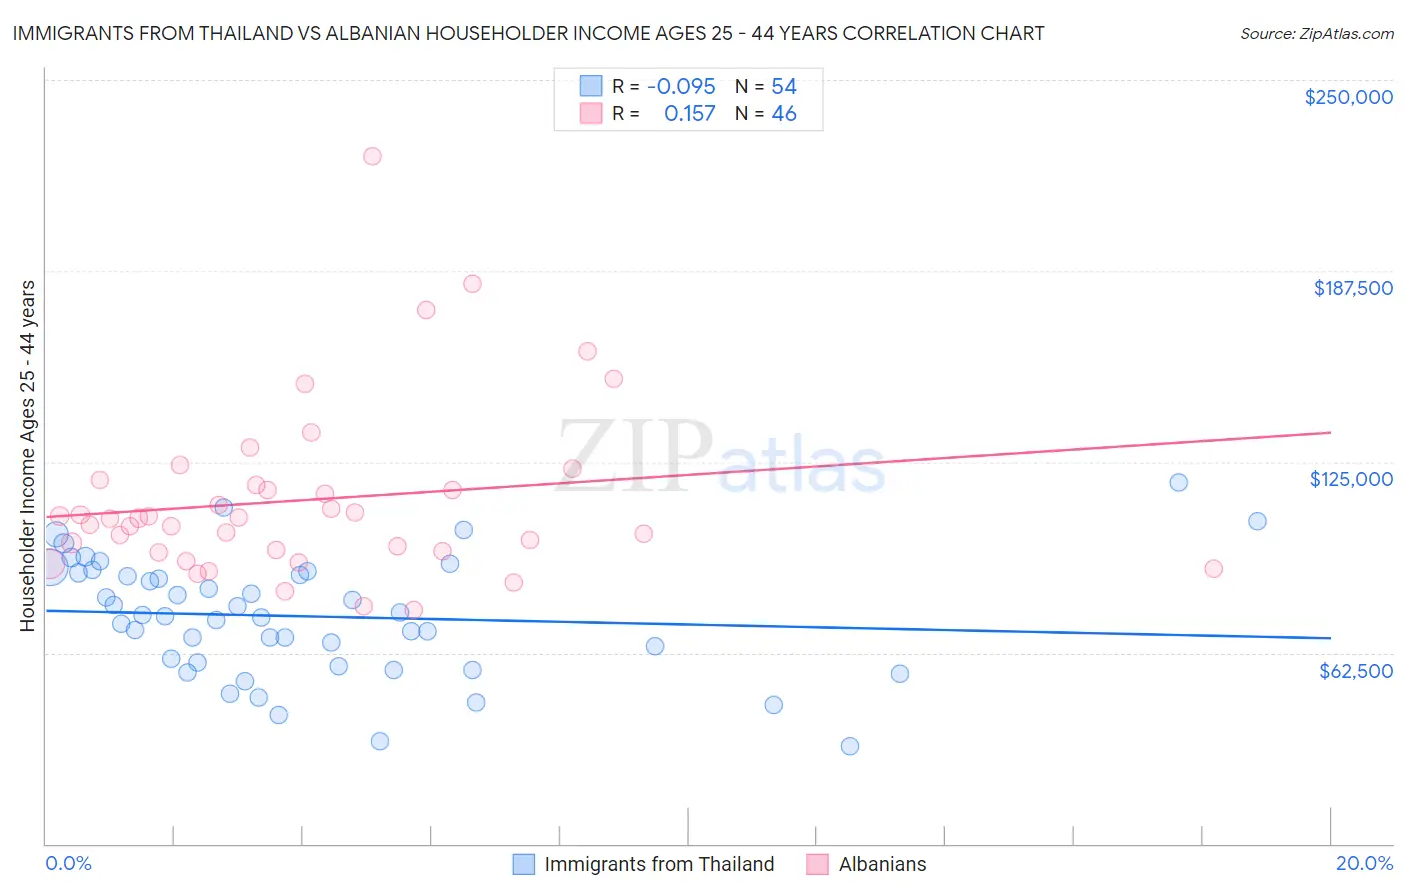
Immigrants from Thailand vs Albanian Householder Income Ages 25 - 44 years Correlation Chart

The statistical analysis conducted on geographies consisting of 316,454,000 people shows a slight negative correlation between the proportion of Immigrants from Thailand and household income with householder between the ages 25 and 44 in the United States with a correlation coefficient (R) of -0.095 and weighted average of $91,337. Similarly, the statistical analysis conducted on geographies consisting of 193,076,288 people shows a poor positive correlation between the proportion of Albanians and household income with householder between the ages 25 and 44 in the United States with a correlation coefficient (R) of 0.157 and weighted average of $101,367, a difference of 11.0%.
Immigrants from Thailand vs Albanian Householder Income Ages 25 - 44 years

Householder Income Ages 25 - 44 years Correlation Summary

MeasurementImmigrants from ThailandAlbanian
Minimum$32,083$76,718
Maximum$118,125$225,000
Range$86,042$148,282
Mean$74,382$112,576
Median$74,631$106,494
Interquartile 25% (IQ1)$59,491$95,901
Interquartile 75% (IQ3)$88,604$117,313
Interquartile Range (IQR)$29,112$21,412
Standard Deviation (Sample)$19,277$28,766
Standard Deviation (Population)$19,098$28,452

Similar Demographics by Householder Income Ages 25 - 44 years

Demographics Similar to Immigrants from Thailand by Householder Income Ages 25 - 44 years

In terms of householder income ages 25 - 44 years, the demographic groups most similar to Immigrants from Thailand are Yugoslavian ($91,368, a difference of 0.030%), Aleut ($91,370, a difference of 0.040%), Immigrants from Eastern Africa ($91,458, a difference of 0.13%), Nepalese ($91,498, a difference of 0.18%), and Immigrants from Uruguay ($91,171, a difference of 0.18%).
DemographicsRating | RankHouseholder Income Ages 25 - 44 years
Japanese
16.4
/100
|
#201
Poor
$91,624
Ecuadorians
16.0
/100
|
#202
Poor
$91,574
Immigrants | Cambodia
15.7
/100
|
#203
Poor
$91,533
Nepalese
15.4
/100
|
#204
Poor
$91,498
Immigrants | Eastern Africa
15.2
/100
|
#205
Poor
$91,458
Aleuts
14.5
/100
|
#206
Poor
$91,370
Yugoslavians
14.5
/100
|
#207
Poor
$91,368
Immigrants | Thailand
14.3
/100
|
#208
Poor
$91,337
Immigrants | Uruguay
13.2
/100
|
#209
Poor
$91,171
Immigrants | Kenya
10.9
/100
|
#210
Poor
$90,767
Iraqis
10.8
/100
|
#211
Poor
$90,764
Hawaiians
10.6
/100
|
#212
Poor
$90,722
Immigrants | Bangladesh
9.3
/100
|
#213
Tragic
$90,448
Immigrants | Africa
8.9
/100
|
#214
Tragic
$90,372
Panamanians
8.1
/100
|
#215
Tragic
$90,193

Demographics Similar to Albanians by Householder Income Ages 25 - 44 years

In terms of householder income ages 25 - 44 years, the demographic groups most similar to Albanians are Immigrants from Argentina ($101,415, a difference of 0.050%), Taiwanese ($101,492, a difference of 0.12%), Immigrants from Lebanon ($101,124, a difference of 0.24%), Immigrants from Moldova ($101,091, a difference of 0.27%), and Immigrants from Poland ($101,065, a difference of 0.30%).
DemographicsRating | RankHouseholder Income Ages 25 - 44 years
Sri Lankans
98.4
/100
|
#94
Exceptional
$101,960
Assyrians/Chaldeans/Syriacs
98.3
/100
|
#95
Exceptional
$101,936
Macedonians
98.3
/100
|
#96
Exceptional
$101,882
Austrians
98.3
/100
|
#97
Exceptional
$101,842
Immigrants | Kazakhstan
98.1
/100
|
#98
Exceptional
$101,727
Taiwanese
97.9
/100
|
#99
Exceptional
$101,492
Immigrants | Argentina
97.8
/100
|
#100
Exceptional
$101,415
Albanians
97.8
/100
|
#101
Exceptional
$101,367
Immigrants | Lebanon
97.4
/100
|
#102
Exceptional
$101,124
Immigrants | Moldova
97.4
/100
|
#103
Exceptional
$101,091
Immigrants | Poland
97.4
/100
|
#104
Exceptional
$101,065
Immigrants | Vietnam
96.5
/100
|
#105
Exceptional
$100,535
Immigrants | Brazil
96.5
/100
|
#106
Exceptional
$100,534
Northern Europeans
96.3
/100
|
#107
Exceptional
$100,457
Immigrants | South Eastern Asia
96.0
/100
|
#108
Exceptional
$100,283