Immigrants from South Eastern Asia vs Albanian Householder Income Ages 25 - 44 years
COMPARE
Immigrants from South Eastern Asia
Albanian
Householder Income Ages 25 - 44 years
Householder Income Ages 25 - 44 years Comparison
Immigrants from South Eastern Asia
Albanians
$100,283
HOUSEHOLDER INCOME AGES 25 - 44 YEARS
96.0/ 100
METRIC RATING
108th/ 347
METRIC RANK
$101,367
HOUSEHOLDER INCOME AGES 25 - 44 YEARS
97.8/ 100
METRIC RATING
101st/ 347
METRIC RANK
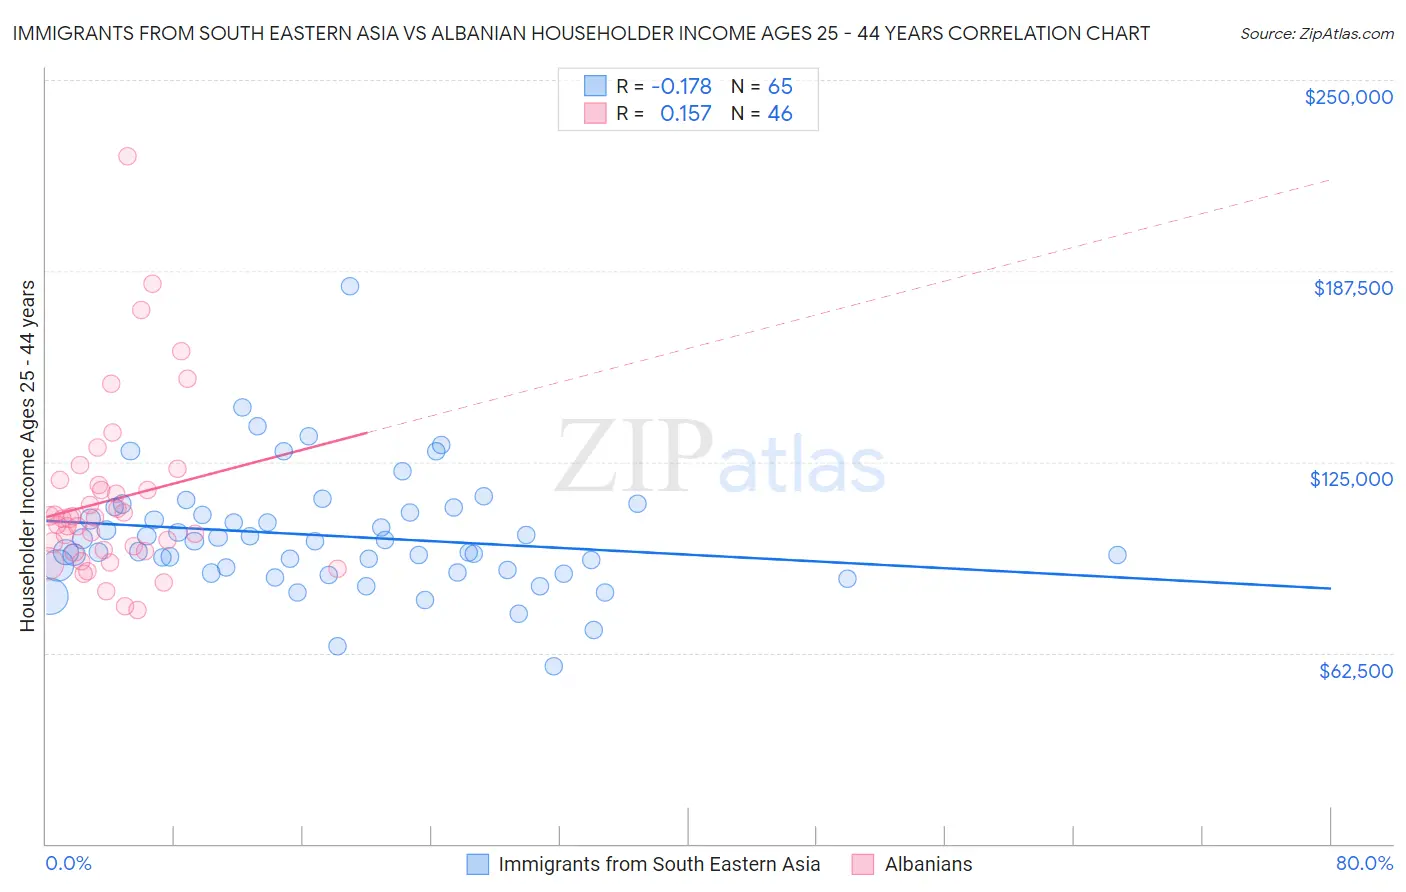
Immigrants from South Eastern Asia vs Albanian Householder Income Ages 25 - 44 years Correlation Chart
The statistical analysis conducted on geographies consisting of 510,148,738 people shows a poor negative correlation between the proportion of Immigrants from South Eastern Asia and household income with householder between the ages 25 and 44 in the United States with a correlation coefficient (R) of -0.178 and weighted average of $100,283. Similarly, the statistical analysis conducted on geographies consisting of 193,076,288 people shows a poor positive correlation between the proportion of Albanians and household income with householder between the ages 25 and 44 in the United States with a correlation coefficient (R) of 0.157 and weighted average of $101,367, a difference of 1.1%.
Householder Income Ages 25 - 44 years Correlation Summary
| Measurement | Immigrants from South Eastern Asia | Albanian |
| Minimum | $57,917 | $76,718 |
| Maximum | $182,472 | $225,000 |
| Range | $124,555 | $148,282 |
| Mean | $100,791 | $112,576 |
| Median | $98,946 | $106,494 |
| Interquartile 25% (IQ1) | $89,392 | $95,901 |
| Interquartile 75% (IQ3) | $109,276 | $117,313 |
| Interquartile Range (IQR) | $19,885 | $21,412 |
| Standard Deviation (Sample) | $19,414 | $28,766 |
| Standard Deviation (Population) | $19,264 | $28,452 |
Demographics Similar to Immigrants from South Eastern Asia and Albanians by Householder Income Ages 25 - 44 years
In terms of householder income ages 25 - 44 years, the demographic groups most similar to Immigrants from South Eastern Asia are Northern European ($100,457, a difference of 0.17%), Immigrants from North Macedonia ($100,101, a difference of 0.18%), Immigrants from Vietnam ($100,535, a difference of 0.25%), Immigrants from Brazil ($100,534, a difference of 0.25%), and Immigrants from Afghanistan ($99,977, a difference of 0.31%). Similarly, the demographic groups most similar to Albanians are Immigrants from Argentina ($101,415, a difference of 0.050%), Taiwanese ($101,492, a difference of 0.12%), Immigrants from Lebanon ($101,124, a difference of 0.24%), Immigrants from Moldova ($101,091, a difference of 0.27%), and Immigrants from Poland ($101,065, a difference of 0.30%).
| Demographics | Rating | Rank | Householder Income Ages 25 - 44 years |
| Sri Lankans | 98.4 /100 | #94 | Exceptional $101,960 |
| Assyrians/Chaldeans/Syriacs | 98.3 /100 | #95 | Exceptional $101,936 |
| Macedonians | 98.3 /100 | #96 | Exceptional $101,882 |
| Austrians | 98.3 /100 | #97 | Exceptional $101,842 |
| Immigrants | Kazakhstan | 98.1 /100 | #98 | Exceptional $101,727 |
| Taiwanese | 97.9 /100 | #99 | Exceptional $101,492 |
| Immigrants | Argentina | 97.8 /100 | #100 | Exceptional $101,415 |
| Albanians | 97.8 /100 | #101 | Exceptional $101,367 |
| Immigrants | Lebanon | 97.4 /100 | #102 | Exceptional $101,124 |
| Immigrants | Moldova | 97.4 /100 | #103 | Exceptional $101,091 |
| Immigrants | Poland | 97.4 /100 | #104 | Exceptional $101,065 |
| Immigrants | Vietnam | 96.5 /100 | #105 | Exceptional $100,535 |
| Immigrants | Brazil | 96.5 /100 | #106 | Exceptional $100,534 |
| Northern Europeans | 96.3 /100 | #107 | Exceptional $100,457 |
| Immigrants | South Eastern Asia | 96.0 /100 | #108 | Exceptional $100,283 |
| Immigrants | North Macedonia | 95.6 /100 | #109 | Exceptional $100,101 |
| Immigrants | Afghanistan | 95.3 /100 | #110 | Exceptional $99,977 |
| Chileans | 95.1 /100 | #111 | Exceptional $99,900 |
| Poles | 94.5 /100 | #112 | Exceptional $99,685 |
| Tongans | 94.2 /100 | #113 | Exceptional $99,604 |
| Immigrants | Western Asia | 94.0 /100 | #114 | Exceptional $99,516 |