Immigrants from Oceania vs Immigrants Median Female Earnings
COMPARE
Immigrants from Oceania
Immigrants
Median Female Earnings
Median Female Earnings Comparison
Immigrants from Oceania
Immigrants
$40,297
MEDIAN FEMALE EARNINGS
77.6/ 100
METRIC RATING
154th/ 347
METRIC RANK
$39,328
MEDIAN FEMALE EARNINGS
31.7/ 100
METRIC RATING
192nd/ 347
METRIC RANK
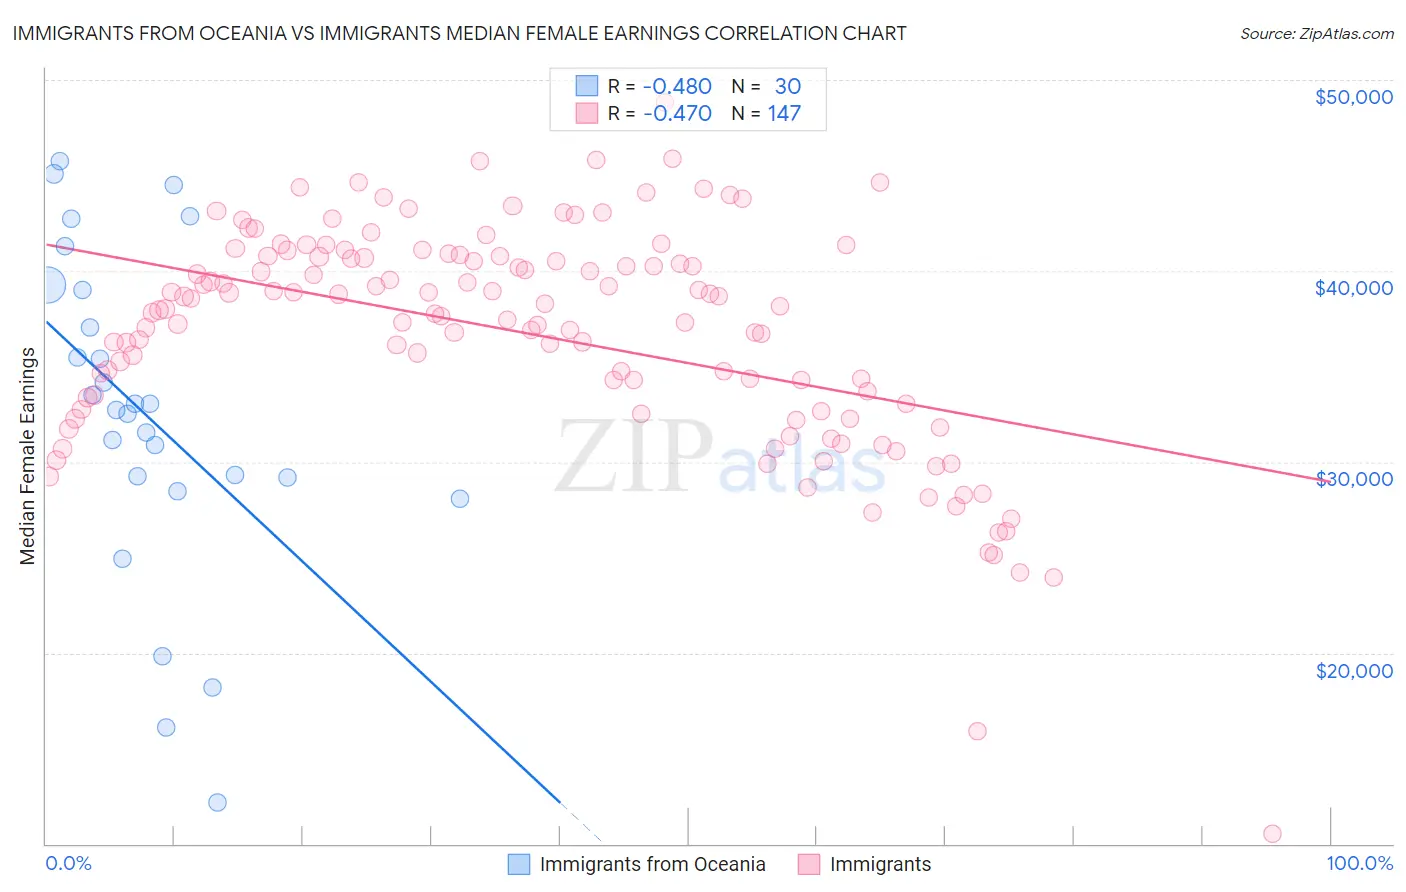
Immigrants from Oceania vs Immigrants Median Female Earnings Correlation Chart
The statistical analysis conducted on geographies consisting of 305,406,455 people shows a moderate negative correlation between the proportion of Immigrants from Oceania and median female earnings in the United States with a correlation coefficient (R) of -0.480 and weighted average of $40,297. Similarly, the statistical analysis conducted on geographies consisting of 575,241,597 people shows a moderate negative correlation between the proportion of Immigrants and median female earnings in the United States with a correlation coefficient (R) of -0.470 and weighted average of $39,328, a difference of 2.5%.
Median Female Earnings Correlation Summary
| Measurement | Immigrants from Oceania | Immigrants |
| Minimum | $12,128 | $10,532 |
| Maximum | $45,730 | $48,847 |
| Range | $33,602 | $38,315 |
| Mean | $32,539 | $36,737 |
| Median | $32,878 | $38,007 |
| Interquartile 25% (IQ1) | $29,179 | $33,067 |
| Interquartile 75% (IQ3) | $38,985 | $40,787 |
| Interquartile Range (IQR) | $9,806 | $7,720 |
| Standard Deviation (Sample) | $8,467 | $5,900 |
| Standard Deviation (Population) | $8,325 | $5,880 |
Similar Demographics by Median Female Earnings
Demographics Similar to Immigrants from Oceania by Median Female Earnings
In terms of median female earnings, the demographic groups most similar to Immigrants from Oceania are British West Indian ($40,299, a difference of 0.010%), West Indian ($40,317, a difference of 0.050%), Immigrants from Africa ($40,257, a difference of 0.10%), Immigrants from Armenia ($40,340, a difference of 0.11%), and Immigrants from Cameroon ($40,354, a difference of 0.14%).
| Demographics | Rating | Rank | Median Female Earnings |
| Vietnamese | 80.4 /100 | #147 | Excellent $40,377 |
| Poles | 80.2 /100 | #148 | Excellent $40,371 |
| Immigrants | Cameroon | 79.7 /100 | #149 | Good $40,354 |
| Immigrants | Chile | 79.6 /100 | #150 | Good $40,353 |
| Immigrants | Armenia | 79.2 /100 | #151 | Good $40,340 |
| West Indians | 78.4 /100 | #152 | Good $40,317 |
| British West Indians | 77.7 /100 | #153 | Good $40,299 |
| Immigrants | Oceania | 77.6 /100 | #154 | Good $40,297 |
| Immigrants | Africa | 76.2 /100 | #155 | Good $40,257 |
| Peruvians | 75.3 /100 | #156 | Good $40,234 |
| Portuguese | 73.0 /100 | #157 | Good $40,177 |
| Immigrants | Senegal | 72.2 /100 | #158 | Good $40,157 |
| Immigrants | Vietnam | 72.0 /100 | #159 | Good $40,153 |
| Inupiat | 68.9 /100 | #160 | Good $40,080 |
| Alsatians | 68.0 /100 | #161 | Good $40,060 |
Demographics Similar to Immigrants by Median Female Earnings
In terms of median female earnings, the demographic groups most similar to Immigrants are Immigrants from Western Africa ($39,351, a difference of 0.060%), Immigrants from Nigeria ($39,294, a difference of 0.090%), Irish ($39,291, a difference of 0.090%), Puget Sound Salish ($39,376, a difference of 0.12%), and Senegalese ($39,384, a difference of 0.14%).
| Demographics | Rating | Rank | Median Female Earnings |
| Immigrants | West Indies | 36.9 /100 | #185 | Fair $39,441 |
| Colombians | 36.9 /100 | #186 | Fair $39,439 |
| Swedes | 36.0 /100 | #187 | Fair $39,421 |
| Bermudans | 35.9 /100 | #188 | Fair $39,418 |
| Senegalese | 34.2 /100 | #189 | Fair $39,384 |
| Puget Sound Salish | 33.9 /100 | #190 | Fair $39,376 |
| Immigrants | Western Africa | 32.7 /100 | #191 | Fair $39,351 |
| Immigrants | Immigrants | 31.7 /100 | #192 | Fair $39,328 |
| Immigrants | Nigeria | 30.2 /100 | #193 | Fair $39,294 |
| Irish | 30.0 /100 | #194 | Fair $39,291 |
| Uruguayans | 27.3 /100 | #195 | Fair $39,228 |
| Immigrants | Costa Rica | 25.6 /100 | #196 | Fair $39,186 |
| Assyrians/Chaldeans/Syriacs | 24.6 /100 | #197 | Fair $39,159 |
| Ecuadorians | 23.0 /100 | #198 | Fair $39,117 |
| Icelanders | 22.7 /100 | #199 | Fair $39,109 |