Immigrants from Moldova vs Carpatho Rusyn Per Capita Income
COMPARE
Immigrants from Moldova
Carpatho Rusyn
Per Capita Income
Per Capita Income Comparison
Immigrants from Moldova
Carpatho Rusyns
$47,489
PER CAPITA INCOME
98.7/ 100
METRIC RATING
92nd/ 347
METRIC RANK
$47,248
PER CAPITA INCOME
98.2/ 100
METRIC RATING
97th/ 347
METRIC RANK
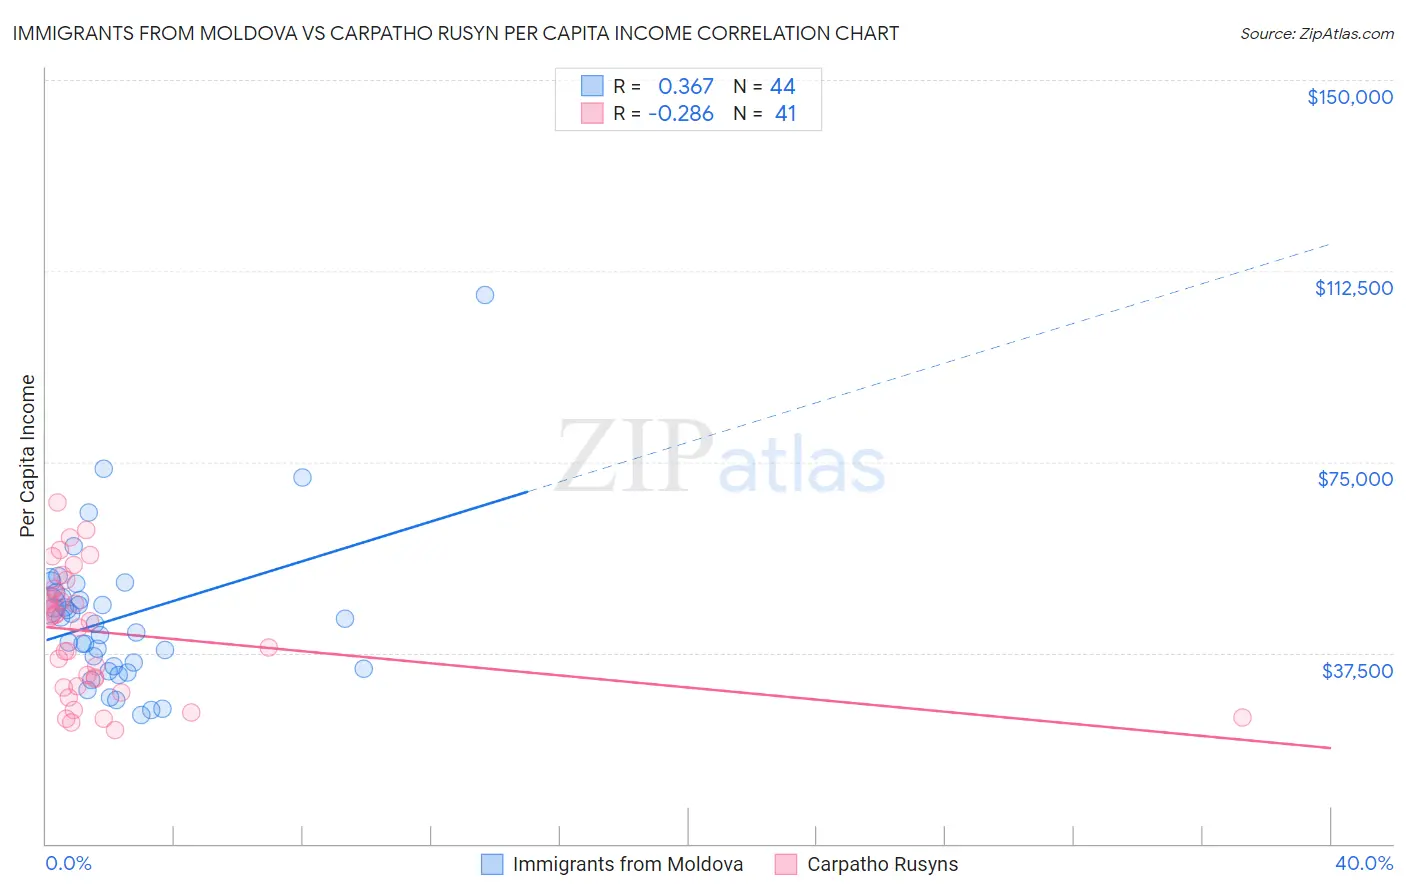
Immigrants from Moldova vs Carpatho Rusyn Per Capita Income Correlation Chart
The statistical analysis conducted on geographies consisting of 124,402,409 people shows a mild positive correlation between the proportion of Immigrants from Moldova and per capita income in the United States with a correlation coefficient (R) of 0.367 and weighted average of $47,489. Similarly, the statistical analysis conducted on geographies consisting of 58,866,831 people shows a weak negative correlation between the proportion of Carpatho Rusyns and per capita income in the United States with a correlation coefficient (R) of -0.286 and weighted average of $47,248, a difference of 0.51%.
Per Capita Income Correlation Summary
| Measurement | Immigrants from Moldova | Carpatho Rusyn |
| Minimum | $25,195 | $22,343 |
| Maximum | $107,889 | $67,093 |
| Range | $82,694 | $44,750 |
| Mean | $44,404 | $41,437 |
| Median | $43,721 | $43,602 |
| Interquartile 25% (IQ1) | $34,656 | $30,789 |
| Interquartile 75% (IQ3) | $48,923 | $49,474 |
| Interquartile Range (IQR) | $14,267 | $18,684 |
| Standard Deviation (Sample) | $14,744 | $12,046 |
| Standard Deviation (Population) | $14,575 | $11,898 |
Demographics Similar to Immigrants from Moldova and Carpatho Rusyns by Per Capita Income
In terms of per capita income, the demographic groups most similar to Immigrants from Moldova are Italian ($47,574, a difference of 0.18%), Macedonian ($47,573, a difference of 0.18%), Immigrants from Zimbabwe ($47,394, a difference of 0.20%), Albanian ($47,379, a difference of 0.23%), and Immigrants from Egypt ($47,361, a difference of 0.27%). Similarly, the demographic groups most similar to Carpatho Rusyns are Alsatian ($47,284, a difference of 0.080%), Immigrants from Egypt ($47,361, a difference of 0.24%), Albanian ($47,379, a difference of 0.28%), Immigrants from Zimbabwe ($47,394, a difference of 0.31%), and Immigrants from Pakistan ($47,084, a difference of 0.35%).
| Demographics | Rating | Rank | Per Capita Income |
| Immigrants | Ukraine | 99.3 /100 | #84 | Exceptional $48,134 |
| Austrians | 99.3 /100 | #85 | Exceptional $48,116 |
| Immigrants | Southern Europe | 99.3 /100 | #86 | Exceptional $48,027 |
| Ukrainians | 99.3 /100 | #87 | Exceptional $48,014 |
| Croatians | 99.0 /100 | #88 | Exceptional $47,742 |
| Northern Europeans | 98.9 /100 | #89 | Exceptional $47,698 |
| Italians | 98.8 /100 | #90 | Exceptional $47,574 |
| Macedonians | 98.8 /100 | #91 | Exceptional $47,573 |
| Immigrants | Moldova | 98.7 /100 | #92 | Exceptional $47,489 |
| Immigrants | Zimbabwe | 98.5 /100 | #93 | Exceptional $47,394 |
| Albanians | 98.5 /100 | #94 | Exceptional $47,379 |
| Immigrants | Egypt | 98.5 /100 | #95 | Exceptional $47,361 |
| Alsatians | 98.3 /100 | #96 | Exceptional $47,284 |
| Carpatho Rusyns | 98.2 /100 | #97 | Exceptional $47,248 |
| Immigrants | Pakistan | 97.9 /100 | #98 | Exceptional $47,084 |
| Laotians | 97.8 /100 | #99 | Exceptional $47,041 |
| Immigrants | Lebanon | 97.5 /100 | #100 | Exceptional $46,938 |
| Immigrants | Uzbekistan | 97.5 /100 | #101 | Exceptional $46,929 |
| Immigrants | Western Asia | 97.4 /100 | #102 | Exceptional $46,876 |
| Syrians | 97.2 /100 | #103 | Exceptional $46,837 |
| Brazilians | 96.8 /100 | #104 | Exceptional $46,700 |