Immigrants from Lithuania vs Iroquois Median Earnings
COMPARE
Immigrants from Lithuania
Iroquois
Median Earnings
Median Earnings Comparison
Immigrants from Lithuania
Iroquois
$52,769
MEDIAN EARNINGS
100.0/ 100
METRIC RATING
41st/ 347
METRIC RANK
$42,430
MEDIAN EARNINGS
0.4/ 100
METRIC RATING
272nd/ 347
METRIC RANK
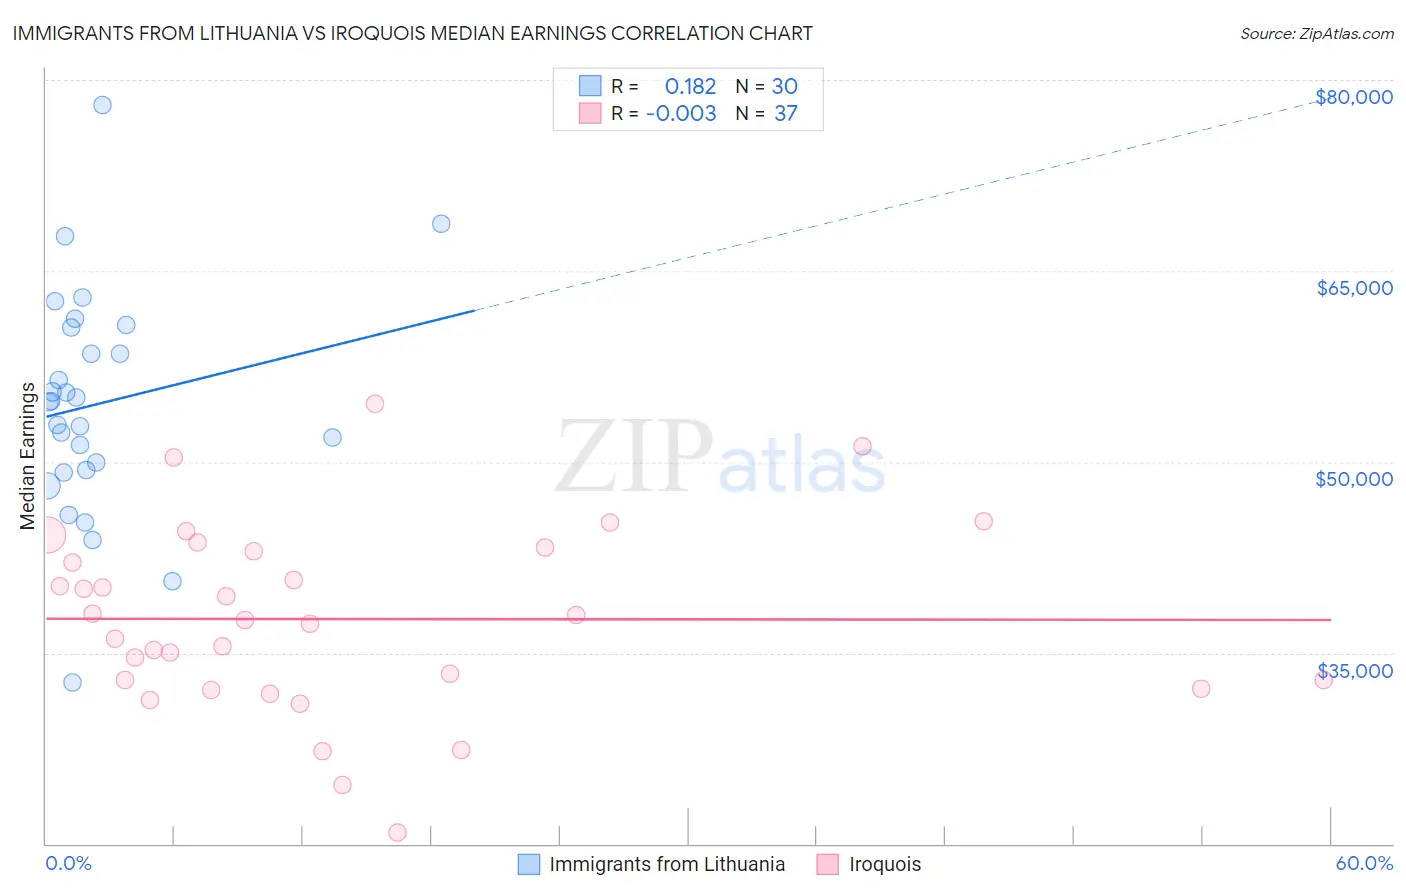
Immigrants from Lithuania vs Iroquois Median Earnings Correlation Chart
The statistical analysis conducted on geographies consisting of 117,724,669 people shows a poor positive correlation between the proportion of Immigrants from Lithuania and median earnings in the United States with a correlation coefficient (R) of 0.182 and weighted average of $52,769. Similarly, the statistical analysis conducted on geographies consisting of 207,284,609 people shows no correlation between the proportion of Iroquois and median earnings in the United States with a correlation coefficient (R) of -0.003 and weighted average of $42,430, a difference of 24.4%.
Median Earnings Correlation Summary
| Measurement | Immigrants from Lithuania | Iroquois |
| Minimum | $32,646 | $20,893 |
| Maximum | $78,046 | $54,543 |
| Range | $45,400 | $33,650 |
| Mean | $54,582 | $37,652 |
| Median | $54,749 | $37,608 |
| Interquartile 25% (IQ1) | $49,388 | $32,548 |
| Interquartile 75% (IQ3) | $60,605 | $43,095 |
| Interquartile Range (IQR) | $11,217 | $10,547 |
| Standard Deviation (Sample) | $8,932 | $7,302 |
| Standard Deviation (Population) | $8,782 | $7,203 |
Similar Demographics by Median Earnings
Demographics Similar to Immigrants from Lithuania by Median Earnings
In terms of median earnings, the demographic groups most similar to Immigrants from Lithuania are Israeli ($52,937, a difference of 0.32%), Immigrants from Turkey ($52,960, a difference of 0.36%), Latvian ($53,001, a difference of 0.44%), Maltese ($52,526, a difference of 0.46%), and Immigrants from Malaysia ($52,514, a difference of 0.49%).
| Demographics | Rating | Rank | Median Earnings |
| Immigrants | Sri Lanka | 100.0 /100 | #34 | Exceptional $53,268 |
| Immigrants | Switzerland | 100.0 /100 | #35 | Exceptional $53,211 |
| Immigrants | Denmark | 100.0 /100 | #36 | Exceptional $53,186 |
| Immigrants | Belarus | 100.0 /100 | #37 | Exceptional $53,043 |
| Latvians | 100.0 /100 | #38 | Exceptional $53,001 |
| Immigrants | Turkey | 100.0 /100 | #39 | Exceptional $52,960 |
| Israelis | 100.0 /100 | #40 | Exceptional $52,937 |
| Immigrants | Lithuania | 100.0 /100 | #41 | Exceptional $52,769 |
| Maltese | 100.0 /100 | #42 | Exceptional $52,526 |
| Immigrants | Malaysia | 100.0 /100 | #43 | Exceptional $52,514 |
| Bulgarians | 100.0 /100 | #44 | Exceptional $52,512 |
| Immigrants | Czechoslovakia | 100.0 /100 | #45 | Exceptional $52,361 |
| Bhutanese | 100.0 /100 | #46 | Exceptional $52,297 |
| Australians | 100.0 /100 | #47 | Exceptional $52,294 |
| Immigrants | Europe | 100.0 /100 | #48 | Exceptional $52,195 |
Demographics Similar to Iroquois by Median Earnings
In terms of median earnings, the demographic groups most similar to Iroquois are Immigrants from Dominica ($42,420, a difference of 0.030%), Immigrants from El Salvador ($42,413, a difference of 0.040%), Immigrants from Belize ($42,339, a difference of 0.22%), Spanish American ($42,316, a difference of 0.27%), and Central American ($42,280, a difference of 0.36%).
| Demographics | Rating | Rank | Median Earnings |
| Salvadorans | 0.7 /100 | #265 | Tragic $42,912 |
| Immigrants | Laos | 0.7 /100 | #266 | Tragic $42,884 |
| Cree | 0.6 /100 | #267 | Tragic $42,777 |
| Americans | 0.6 /100 | #268 | Tragic $42,742 |
| Belizeans | 0.5 /100 | #269 | Tragic $42,702 |
| Osage | 0.5 /100 | #270 | Tragic $42,651 |
| Pennsylvania Germans | 0.5 /100 | #271 | Tragic $42,615 |
| Iroquois | 0.4 /100 | #272 | Tragic $42,430 |
| Immigrants | Dominica | 0.4 /100 | #273 | Tragic $42,420 |
| Immigrants | El Salvador | 0.4 /100 | #274 | Tragic $42,413 |
| Immigrants | Belize | 0.3 /100 | #275 | Tragic $42,339 |
| Spanish Americans | 0.3 /100 | #276 | Tragic $42,316 |
| Central Americans | 0.3 /100 | #277 | Tragic $42,280 |
| Cajuns | 0.3 /100 | #278 | Tragic $42,189 |
| Colville | 0.2 /100 | #279 | Tragic $42,151 |