Immigrants from Liberia vs Shoshone Householder Income Ages 45 - 64 years
COMPARE
Immigrants from Liberia
Shoshone
Householder Income Ages 45 - 64 years
Householder Income Ages 45 - 64 years Comparison
Immigrants from Liberia
Shoshone
$87,739
HOUSEHOLDER INCOME AGES 45 - 64 YEARS
0.2/ 100
METRIC RATING
270th/ 347
METRIC RANK
$83,588
HOUSEHOLDER INCOME AGES 45 - 64 YEARS
0.0/ 100
METRIC RATING
307th/ 347
METRIC RANK
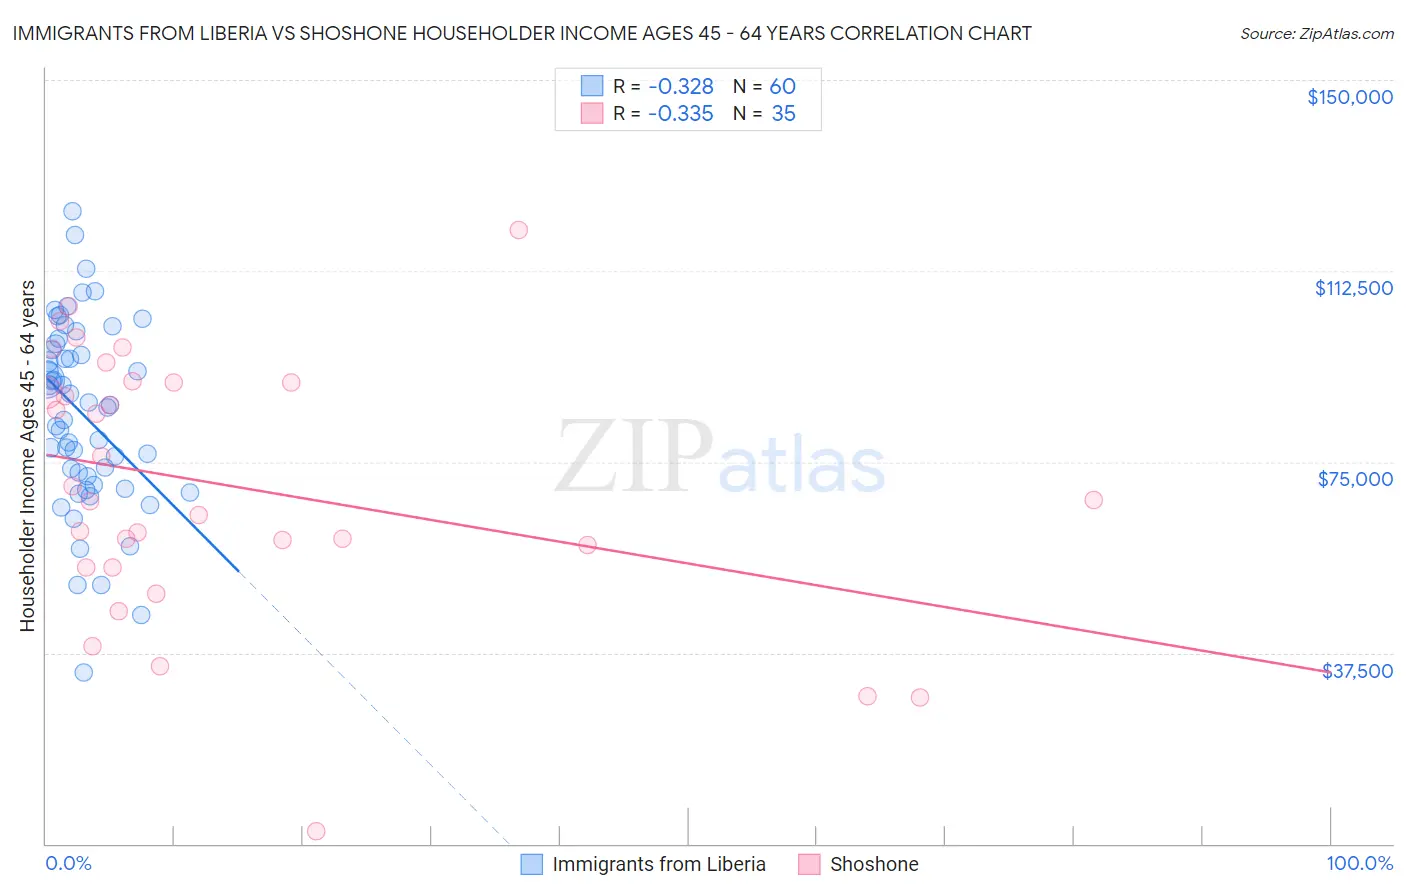
Immigrants from Liberia vs Shoshone Householder Income Ages 45 - 64 years Correlation Chart
The statistical analysis conducted on geographies consisting of 135,189,052 people shows a mild negative correlation between the proportion of Immigrants from Liberia and household income with householder between the ages 45 and 64 in the United States with a correlation coefficient (R) of -0.328 and weighted average of $87,739. Similarly, the statistical analysis conducted on geographies consisting of 66,599,308 people shows a mild negative correlation between the proportion of Shoshone and household income with householder between the ages 45 and 64 in the United States with a correlation coefficient (R) of -0.335 and weighted average of $83,588, a difference of 5.0%.
Householder Income Ages 45 - 64 years Correlation Summary
| Measurement | Immigrants from Liberia | Shoshone |
| Minimum | $33,597 | $2,499 |
| Maximum | $124,313 | $120,500 |
| Range | $90,716 | $118,001 |
| Mean | $84,202 | $70,433 |
| Median | $85,955 | $67,500 |
| Interquartile 25% (IQ1) | $71,300 | $54,344 |
| Interquartile 75% (IQ3) | $97,673 | $90,536 |
| Interquartile Range (IQR) | $26,373 | $36,192 |
| Standard Deviation (Sample) | $18,447 | $25,918 |
| Standard Deviation (Population) | $18,293 | $25,545 |
Similar Demographics by Householder Income Ages 45 - 64 years
Demographics Similar to Immigrants from Liberia by Householder Income Ages 45 - 64 years
In terms of householder income ages 45 - 64 years, the demographic groups most similar to Immigrants from Liberia are Guatemalan ($87,705, a difference of 0.040%), Spanish American ($87,836, a difference of 0.11%), Immigrants from Micronesia ($87,864, a difference of 0.14%), Cape Verdean ($87,580, a difference of 0.18%), and Spanish American Indian ($87,561, a difference of 0.20%).
| Demographics | Rating | Rank | Householder Income Ages 45 - 64 years |
| Immigrants | Senegal | 0.3 /100 | #263 | Tragic $88,421 |
| Osage | 0.3 /100 | #264 | Tragic $88,390 |
| Jamaicans | 0.2 /100 | #265 | Tragic $88,327 |
| Immigrants | West Indies | 0.2 /100 | #266 | Tragic $88,164 |
| Hmong | 0.2 /100 | #267 | Tragic $88,115 |
| Immigrants | Micronesia | 0.2 /100 | #268 | Tragic $87,864 |
| Spanish Americans | 0.2 /100 | #269 | Tragic $87,836 |
| Immigrants | Liberia | 0.2 /100 | #270 | Tragic $87,739 |
| Guatemalans | 0.2 /100 | #271 | Tragic $87,705 |
| Cape Verdeans | 0.2 /100 | #272 | Tragic $87,580 |
| Spanish American Indians | 0.2 /100 | #273 | Tragic $87,561 |
| Iroquois | 0.1 /100 | #274 | Tragic $87,255 |
| Immigrants | Belize | 0.1 /100 | #275 | Tragic $87,229 |
| Immigrants | Latin America | 0.1 /100 | #276 | Tragic $87,219 |
| Cree | 0.1 /100 | #277 | Tragic $87,185 |
Demographics Similar to Shoshone by Householder Income Ages 45 - 64 years
In terms of householder income ages 45 - 64 years, the demographic groups most similar to Shoshone are Immigrants from Cabo Verde ($83,542, a difference of 0.060%), Immigrants from Dominica ($83,311, a difference of 0.33%), Immigrants from Haiti ($83,257, a difference of 0.40%), Ute ($83,937, a difference of 0.42%), and Chippewa ($83,943, a difference of 0.43%).
| Demographics | Rating | Rank | Householder Income Ages 45 - 64 years |
| Indonesians | 0.0 /100 | #300 | Tragic $84,890 |
| Potawatomi | 0.0 /100 | #301 | Tragic $84,613 |
| Haitians | 0.0 /100 | #302 | Tragic $84,384 |
| Hondurans | 0.0 /100 | #303 | Tragic $84,079 |
| Ottawa | 0.0 /100 | #304 | Tragic $83,953 |
| Chippewa | 0.0 /100 | #305 | Tragic $83,943 |
| Ute | 0.0 /100 | #306 | Tragic $83,937 |
| Shoshone | 0.0 /100 | #307 | Tragic $83,588 |
| Immigrants | Cabo Verde | 0.0 /100 | #308 | Tragic $83,542 |
| Immigrants | Dominica | 0.0 /100 | #309 | Tragic $83,311 |
| Immigrants | Haiti | 0.0 /100 | #310 | Tragic $83,257 |
| Immigrants | Bahamas | 0.0 /100 | #311 | Tragic $83,177 |
| Cajuns | 0.0 /100 | #312 | Tragic $83,015 |
| U.S. Virgin Islanders | 0.0 /100 | #313 | Tragic $82,736 |
| Immigrants | Honduras | 0.0 /100 | #314 | Tragic $82,697 |