Immigrants from Liberia vs Shoshone 9th Grade
COMPARE
Immigrants from Liberia
Shoshone
9th Grade
9th Grade Comparison
Immigrants from Liberia
Shoshone
94.5%
9TH GRADE
11.8/ 100
METRIC RATING
214th/ 347
METRIC RANK
95.4%
9TH GRADE
95.3/ 100
METRIC RATING
124th/ 347
METRIC RANK
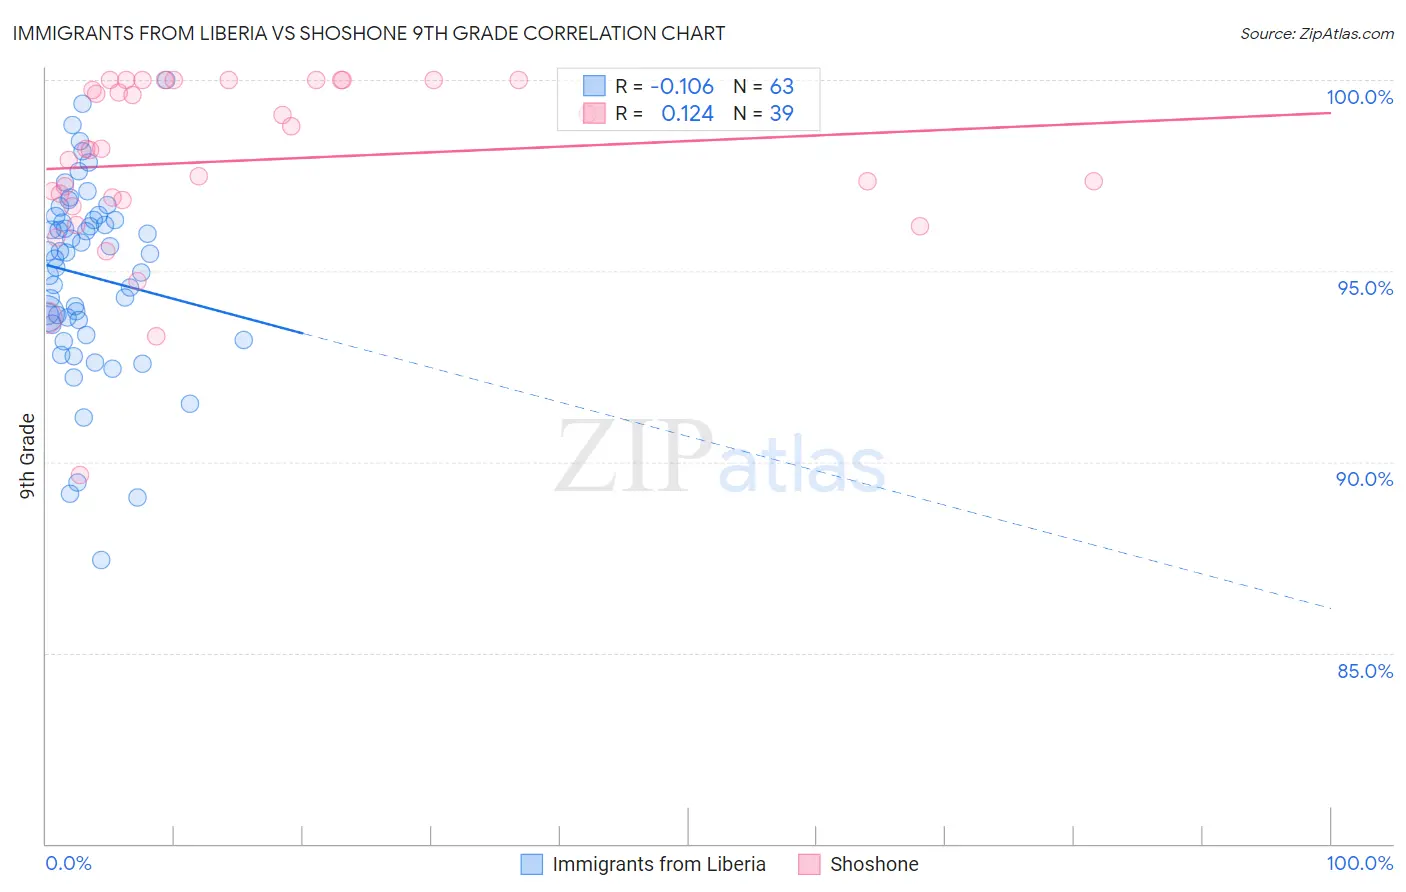
Immigrants from Liberia vs Shoshone 9th Grade Correlation Chart
The statistical analysis conducted on geographies consisting of 135,292,614 people shows a poor negative correlation between the proportion of Immigrants from Liberia and percentage of population with at least 9th grade education in the United States with a correlation coefficient (R) of -0.106 and weighted average of 94.5%. Similarly, the statistical analysis conducted on geographies consisting of 66,625,086 people shows a poor positive correlation between the proportion of Shoshone and percentage of population with at least 9th grade education in the United States with a correlation coefficient (R) of 0.124 and weighted average of 95.4%, a difference of 0.92%.
9th Grade Correlation Summary
| Measurement | Immigrants from Liberia | Shoshone |
| Minimum | 87.4% | 89.7% |
| Maximum | 100.0% | 100.0% |
| Range | 12.6% | 10.3% |
| Mean | 94.9% | 97.9% |
| Median | 95.5% | 98.2% |
| Interquartile 25% (IQ1) | 93.6% | 96.9% |
| Interquartile 75% (IQ3) | 96.3% | 100.0% |
| Interquartile Range (IQR) | 2.7% | 3.1% |
| Standard Deviation (Sample) | 2.5% | 2.3% |
| Standard Deviation (Population) | 2.5% | 2.3% |
Similar Demographics by 9th Grade
Demographics Similar to Immigrants from Liberia by 9th Grade
In terms of 9th grade, the demographic groups most similar to Immigrants from Liberia are Immigrants from Oceania (94.5%, a difference of 0.0%), Immigrants from Indonesia (94.5%, a difference of 0.010%), Immigrants from Malaysia (94.5%, a difference of 0.010%), Immigrants from Syria (94.5%, a difference of 0.010%), and Immigrants from Western Asia (94.5%, a difference of 0.020%).
| Demographics | Rating | Rank | 9th Grade |
| Immigrants | Morocco | 16.3 /100 | #207 | Poor 94.6% |
| Immigrants | Pakistan | 15.5 /100 | #208 | Poor 94.6% |
| Comanche | 14.9 /100 | #209 | Poor 94.6% |
| Immigrants | Chile | 13.4 /100 | #210 | Poor 94.5% |
| Immigrants | Indonesia | 12.3 /100 | #211 | Poor 94.5% |
| Immigrants | Malaysia | 12.2 /100 | #212 | Poor 94.5% |
| Immigrants | Oceania | 12.1 /100 | #213 | Poor 94.5% |
| Immigrants | Liberia | 11.8 /100 | #214 | Poor 94.5% |
| Immigrants | Syria | 11.0 /100 | #215 | Poor 94.5% |
| Immigrants | Western Asia | 10.7 /100 | #216 | Poor 94.5% |
| Asians | 9.9 /100 | #217 | Tragic 94.5% |
| Portuguese | 9.2 /100 | #218 | Tragic 94.5% |
| Africans | 9.0 /100 | #219 | Tragic 94.5% |
| Indians (Asian) | 8.6 /100 | #220 | Tragic 94.5% |
| Immigrants | Eastern Africa | 8.2 /100 | #221 | Tragic 94.5% |
Demographics Similar to Shoshone by 9th Grade
In terms of 9th grade, the demographic groups most similar to Shoshone are Kiowa (95.4%, a difference of 0.0%), Cambodian (95.4%, a difference of 0.010%), Cree (95.4%, a difference of 0.010%), Immigrants from Kuwait (95.4%, a difference of 0.010%), and Immigrants from South Central Asia (95.4%, a difference of 0.010%).
| Demographics | Rating | Rank | 9th Grade |
| Immigrants | Romania | 95.6 /100 | #117 | Exceptional 95.4% |
| Immigrants | Turkey | 95.6 /100 | #118 | Exceptional 95.4% |
| Soviet Union | 95.6 /100 | #119 | Exceptional 95.4% |
| Cambodians | 95.6 /100 | #120 | Exceptional 95.4% |
| Cree | 95.5 /100 | #121 | Exceptional 95.4% |
| Immigrants | Kuwait | 95.5 /100 | #122 | Exceptional 95.4% |
| Kiowa | 95.3 /100 | #123 | Exceptional 95.4% |
| Shoshone | 95.3 /100 | #124 | Exceptional 95.4% |
| Immigrants | South Central Asia | 95.1 /100 | #125 | Exceptional 95.4% |
| Immigrants | Serbia | 94.4 /100 | #126 | Exceptional 95.4% |
| Palestinians | 94.3 /100 | #127 | Exceptional 95.4% |
| Immigrants | Hungary | 94.2 /100 | #128 | Exceptional 95.4% |
| Basques | 94.1 /100 | #129 | Exceptional 95.4% |
| Jordanians | 93.5 /100 | #130 | Exceptional 95.3% |
| Immigrants | North Macedonia | 92.3 /100 | #131 | Exceptional 95.3% |