Immigrants from Latin America vs Immigrants from Serbia Median Family Income
COMPARE
Immigrants from Latin America
Immigrants from Serbia
Median Family Income
Median Family Income Comparison
Immigrants from Latin America
Immigrants from Serbia
$86,989
MEDIAN FAMILY INCOME
0.0/ 100
METRIC RATING
298th/ 347
METRIC RANK
$113,463
MEDIAN FAMILY INCOME
99.6/ 100
METRIC RATING
68th/ 347
METRIC RANK
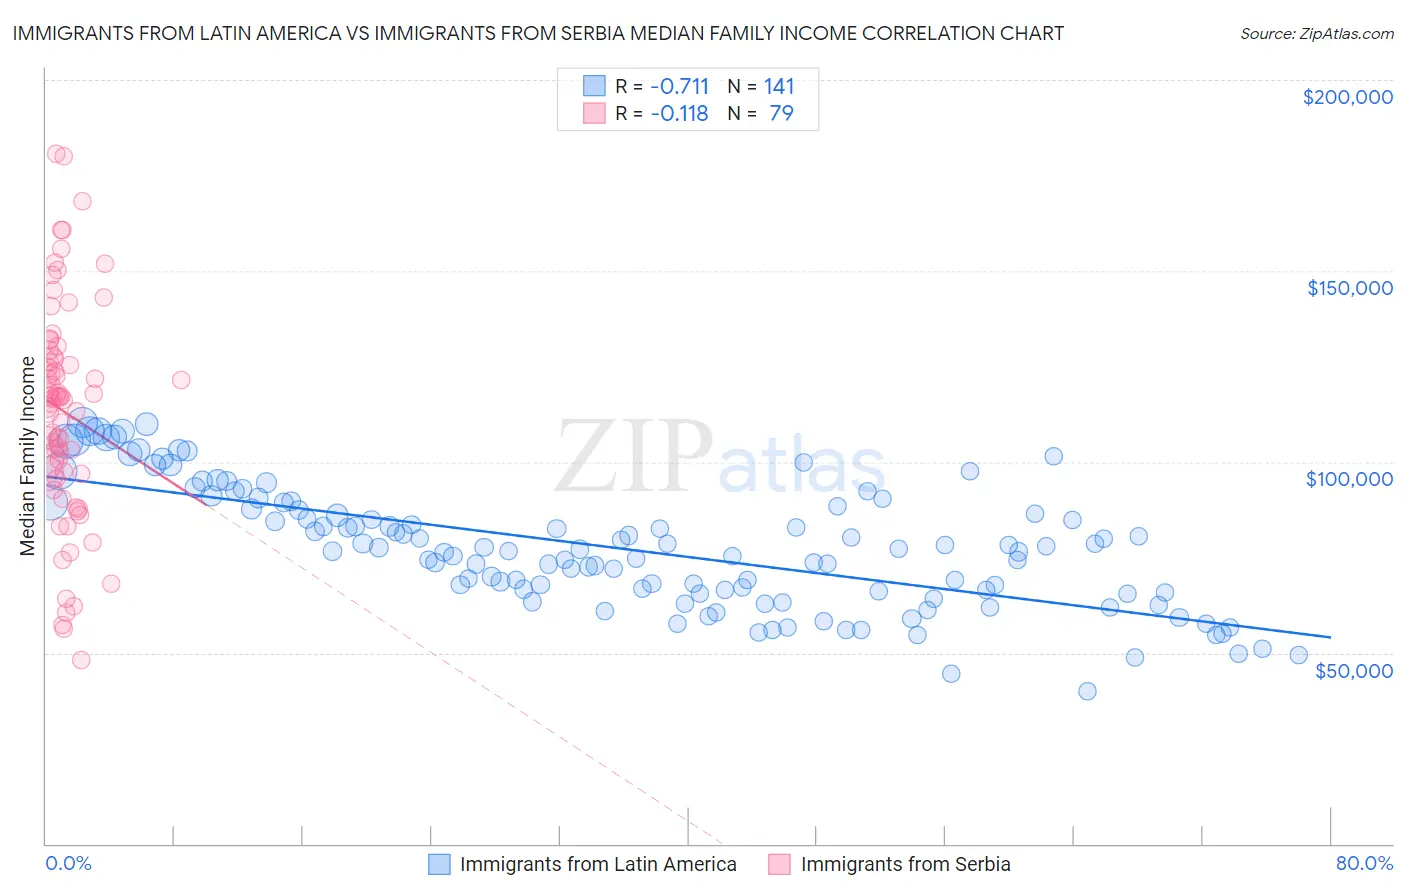
Immigrants from Latin America vs Immigrants from Serbia Median Family Income Correlation Chart
The statistical analysis conducted on geographies consisting of 557,337,898 people shows a strong negative correlation between the proportion of Immigrants from Latin America and median family income in the United States with a correlation coefficient (R) of -0.711 and weighted average of $86,989. Similarly, the statistical analysis conducted on geographies consisting of 131,712,568 people shows a poor negative correlation between the proportion of Immigrants from Serbia and median family income in the United States with a correlation coefficient (R) of -0.118 and weighted average of $113,463, a difference of 30.4%.
Median Family Income Correlation Summary
| Measurement | Immigrants from Latin America | Immigrants from Serbia |
| Minimum | $39,785 | $48,194 |
| Maximum | $110,302 | $180,588 |
| Range | $70,517 | $132,394 |
| Mean | $77,259 | $113,133 |
| Median | $76,749 | $116,433 |
| Interquartile 25% (IQ1) | $66,005 | $96,750 |
| Interquartile 75% (IQ3) | $88,129 | $127,696 |
| Interquartile Range (IQR) | $22,124 | $30,946 |
| Standard Deviation (Sample) | $15,813 | $28,356 |
| Standard Deviation (Population) | $15,756 | $28,176 |
Similar Demographics by Median Family Income
Demographics Similar to Immigrants from Latin America by Median Family Income
In terms of median family income, the demographic groups most similar to Immigrants from Latin America are Chippewa ($86,852, a difference of 0.16%), Cajun ($87,157, a difference of 0.19%), Immigrants from Guatemala ($87,191, a difference of 0.23%), Yaqui ($87,289, a difference of 0.34%), and Fijian ($87,387, a difference of 0.46%).
| Demographics | Rating | Rank | Median Family Income |
| Immigrants | Cabo Verde | 0.1 /100 | #291 | Tragic $87,830 |
| Africans | 0.1 /100 | #292 | Tragic $87,820 |
| Ute | 0.0 /100 | #293 | Tragic $87,596 |
| Fijians | 0.0 /100 | #294 | Tragic $87,387 |
| Yaqui | 0.0 /100 | #295 | Tragic $87,289 |
| Immigrants | Guatemala | 0.0 /100 | #296 | Tragic $87,191 |
| Cajuns | 0.0 /100 | #297 | Tragic $87,157 |
| Immigrants | Latin America | 0.0 /100 | #298 | Tragic $86,989 |
| Chippewa | 0.0 /100 | #299 | Tragic $86,852 |
| Ottawa | 0.0 /100 | #300 | Tragic $86,380 |
| Colville | 0.0 /100 | #301 | Tragic $85,792 |
| Spanish American Indians | 0.0 /100 | #302 | Tragic $85,728 |
| Hispanics or Latinos | 0.0 /100 | #303 | Tragic $85,647 |
| Mexicans | 0.0 /100 | #304 | Tragic $85,618 |
| Paiute | 0.0 /100 | #305 | Tragic $85,414 |
Demographics Similar to Immigrants from Serbia by Median Family Income
In terms of median family income, the demographic groups most similar to Immigrants from Serbia are Immigrants from Bulgaria ($113,461, a difference of 0.0%), Immigrants from Romania ($113,434, a difference of 0.030%), South African ($113,229, a difference of 0.21%), Immigrants from Spain ($113,815, a difference of 0.31%), and Afghan ($112,971, a difference of 0.44%).
| Demographics | Rating | Rank | Median Family Income |
| Immigrants | Belarus | 99.8 /100 | #61 | Exceptional $114,586 |
| Mongolians | 99.8 /100 | #62 | Exceptional $114,553 |
| Immigrants | Pakistan | 99.8 /100 | #63 | Exceptional $114,406 |
| Immigrants | Scotland | 99.7 /100 | #64 | Exceptional $114,392 |
| Egyptians | 99.7 /100 | #65 | Exceptional $114,119 |
| Paraguayans | 99.7 /100 | #66 | Exceptional $114,016 |
| Immigrants | Spain | 99.7 /100 | #67 | Exceptional $113,815 |
| Immigrants | Serbia | 99.6 /100 | #68 | Exceptional $113,463 |
| Immigrants | Bulgaria | 99.6 /100 | #69 | Exceptional $113,461 |
| Immigrants | Romania | 99.6 /100 | #70 | Exceptional $113,434 |
| South Africans | 99.5 /100 | #71 | Exceptional $113,229 |
| Afghans | 99.5 /100 | #72 | Exceptional $112,971 |
| Laotians | 99.5 /100 | #73 | Exceptional $112,859 |
| Immigrants | Italy | 99.4 /100 | #74 | Exceptional $112,848 |
| Immigrants | Western Europe | 99.4 /100 | #75 | Exceptional $112,688 |