Basque vs Immigrants from Serbia Median Family Income
COMPARE
Basque
Immigrants from Serbia
Median Family Income
Median Family Income Comparison
Basques
Immigrants from Serbia
$104,760
MEDIAN FAMILY INCOME
74.4/ 100
METRIC RATING
156th/ 347
METRIC RANK
$113,463
MEDIAN FAMILY INCOME
99.6/ 100
METRIC RATING
68th/ 347
METRIC RANK
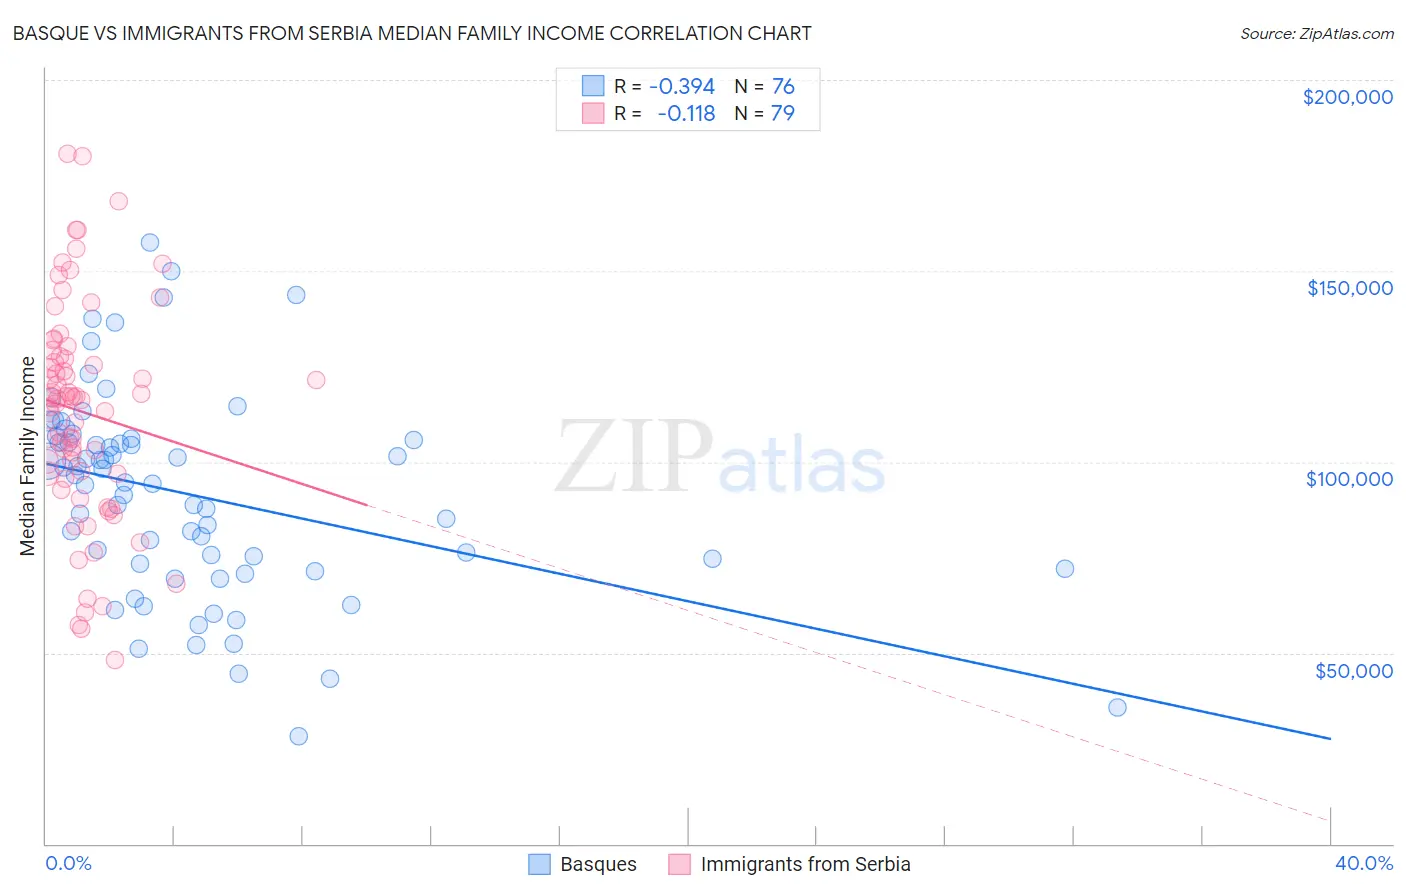
Basque vs Immigrants from Serbia Median Family Income Correlation Chart
The statistical analysis conducted on geographies consisting of 165,742,125 people shows a mild negative correlation between the proportion of Basques and median family income in the United States with a correlation coefficient (R) of -0.394 and weighted average of $104,760. Similarly, the statistical analysis conducted on geographies consisting of 131,712,568 people shows a poor negative correlation between the proportion of Immigrants from Serbia and median family income in the United States with a correlation coefficient (R) of -0.118 and weighted average of $113,463, a difference of 8.3%.
Median Family Income Correlation Summary
| Measurement | Basque | Immigrants from Serbia |
| Minimum | $28,036 | $48,194 |
| Maximum | $157,351 | $180,588 |
| Range | $129,315 | $132,394 |
| Mean | $91,256 | $113,133 |
| Median | $94,457 | $116,433 |
| Interquartile 25% (IQ1) | $72,725 | $96,750 |
| Interquartile 75% (IQ3) | $105,919 | $127,696 |
| Interquartile Range (IQR) | $33,194 | $30,946 |
| Standard Deviation (Sample) | $26,783 | $28,356 |
| Standard Deviation (Population) | $26,606 | $28,176 |
Similar Demographics by Median Family Income
Demographics Similar to Basques by Median Family Income
In terms of median family income, the demographic groups most similar to Basques are Native Hawaiian ($104,910, a difference of 0.14%), Immigrants from Nepal ($104,966, a difference of 0.20%), Moroccan ($104,488, a difference of 0.26%), Scandinavian ($104,410, a difference of 0.34%), and Swiss ($104,396, a difference of 0.35%).
| Demographics | Rating | Rank | Median Family Income |
| Immigrants | Germany | 80.9 /100 | #149 | Excellent $105,507 |
| Irish | 80.5 /100 | #150 | Excellent $105,453 |
| Peruvians | 80.4 /100 | #151 | Excellent $105,444 |
| Immigrants | Albania | 79.1 /100 | #152 | Good $105,285 |
| Slavs | 77.9 /100 | #153 | Good $105,144 |
| Immigrants | Nepal | 76.3 /100 | #154 | Good $104,966 |
| Native Hawaiians | 75.8 /100 | #155 | Good $104,910 |
| Basques | 74.4 /100 | #156 | Good $104,760 |
| Moroccans | 71.6 /100 | #157 | Good $104,488 |
| Scandinavians | 70.8 /100 | #158 | Good $104,410 |
| Swiss | 70.7 /100 | #159 | Good $104,396 |
| Scottish | 69.5 /100 | #160 | Good $104,288 |
| Icelanders | 69.4 /100 | #161 | Good $104,282 |
| Immigrants | Sierra Leone | 66.2 /100 | #162 | Good $103,990 |
| Costa Ricans | 66.2 /100 | #163 | Good $103,989 |
Demographics Similar to Immigrants from Serbia by Median Family Income
In terms of median family income, the demographic groups most similar to Immigrants from Serbia are Immigrants from Bulgaria ($113,461, a difference of 0.0%), Immigrants from Romania ($113,434, a difference of 0.030%), South African ($113,229, a difference of 0.21%), Immigrants from Spain ($113,815, a difference of 0.31%), and Afghan ($112,971, a difference of 0.44%).
| Demographics | Rating | Rank | Median Family Income |
| Immigrants | Belarus | 99.8 /100 | #61 | Exceptional $114,586 |
| Mongolians | 99.8 /100 | #62 | Exceptional $114,553 |
| Immigrants | Pakistan | 99.8 /100 | #63 | Exceptional $114,406 |
| Immigrants | Scotland | 99.7 /100 | #64 | Exceptional $114,392 |
| Egyptians | 99.7 /100 | #65 | Exceptional $114,119 |
| Paraguayans | 99.7 /100 | #66 | Exceptional $114,016 |
| Immigrants | Spain | 99.7 /100 | #67 | Exceptional $113,815 |
| Immigrants | Serbia | 99.6 /100 | #68 | Exceptional $113,463 |
| Immigrants | Bulgaria | 99.6 /100 | #69 | Exceptional $113,461 |
| Immigrants | Romania | 99.6 /100 | #70 | Exceptional $113,434 |
| South Africans | 99.5 /100 | #71 | Exceptional $113,229 |
| Afghans | 99.5 /100 | #72 | Exceptional $112,971 |
| Laotians | 99.5 /100 | #73 | Exceptional $112,859 |
| Immigrants | Italy | 99.4 /100 | #74 | Exceptional $112,848 |
| Immigrants | Western Europe | 99.4 /100 | #75 | Exceptional $112,688 |