Immigrants from Kenya vs Zimbabwean Householder Income Ages 45 - 64 years
COMPARE
Immigrants from Kenya
Zimbabwean
Householder Income Ages 45 - 64 years
Householder Income Ages 45 - 64 years Comparison
Immigrants from Kenya
Zimbabweans
$97,964
HOUSEHOLDER INCOME AGES 45 - 64 YEARS
23.5/ 100
METRIC RATING
200th/ 347
METRIC RANK
$106,849
HOUSEHOLDER INCOME AGES 45 - 64 YEARS
96.3/ 100
METRIC RATING
108th/ 347
METRIC RANK
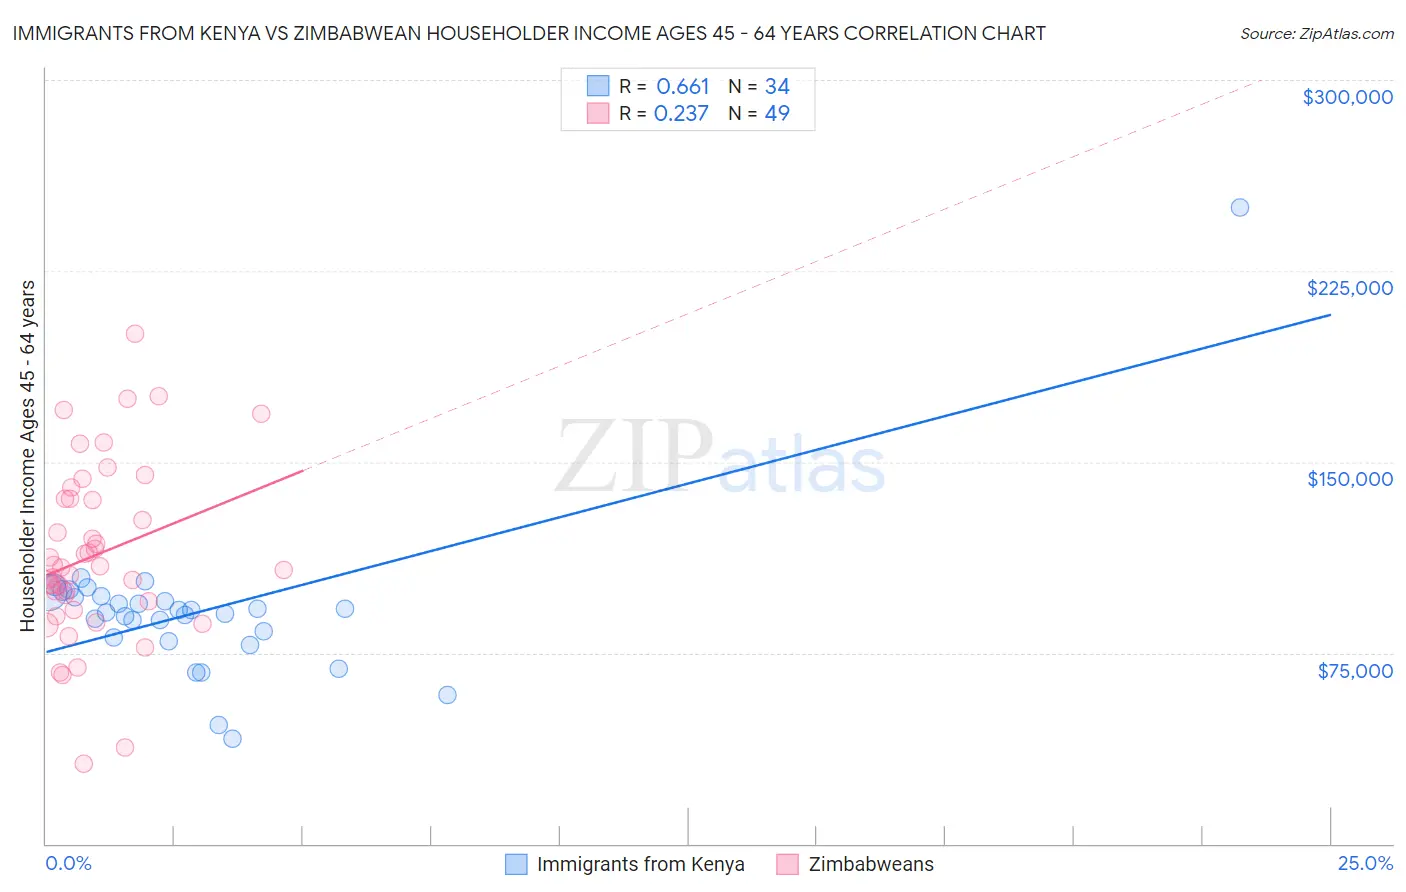
Immigrants from Kenya vs Zimbabwean Householder Income Ages 45 - 64 years Correlation Chart
The statistical analysis conducted on geographies consisting of 217,894,820 people shows a significant positive correlation between the proportion of Immigrants from Kenya and household income with householder between the ages 45 and 64 in the United States with a correlation coefficient (R) of 0.661 and weighted average of $97,964. Similarly, the statistical analysis conducted on geographies consisting of 69,179,320 people shows a weak positive correlation between the proportion of Zimbabweans and household income with householder between the ages 45 and 64 in the United States with a correlation coefficient (R) of 0.237 and weighted average of $106,849, a difference of 9.1%.
Householder Income Ages 45 - 64 years Correlation Summary
| Measurement | Immigrants from Kenya | Zimbabwean |
| Minimum | $41,343 | $31,641 |
| Maximum | $250,001 | $200,450 |
| Range | $208,658 | $168,809 |
| Mean | $91,195 | $113,309 |
| Median | $91,314 | $108,283 |
| Interquartile 25% (IQ1) | $80,833 | $93,481 |
| Interquartile 75% (IQ3) | $97,063 | $135,585 |
| Interquartile Range (IQR) | $16,231 | $42,104 |
| Standard Deviation (Sample) | $31,961 | $34,490 |
| Standard Deviation (Population) | $31,487 | $34,136 |
Similar Demographics by Householder Income Ages 45 - 64 years
Demographics Similar to Immigrants from Kenya by Householder Income Ages 45 - 64 years
In terms of householder income ages 45 - 64 years, the demographic groups most similar to Immigrants from Kenya are White/Caucasian ($98,091, a difference of 0.13%), Immigrants from Iraq ($98,201, a difference of 0.24%), Puget Sound Salish ($98,340, a difference of 0.38%), Yugoslavian ($97,558, a difference of 0.42%), and Immigrants from Eastern Africa ($98,467, a difference of 0.51%).
| Demographics | Rating | Rank | Householder Income Ages 45 - 64 years |
| Hawaiians | 31.6 /100 | #193 | Fair $98,778 |
| Uruguayans | 30.3 /100 | #194 | Fair $98,660 |
| Spanish | 29.2 /100 | #195 | Fair $98,554 |
| Immigrants | Eastern Africa | 28.3 /100 | #196 | Fair $98,467 |
| Puget Sound Salish | 27.0 /100 | #197 | Fair $98,340 |
| Immigrants | Iraq | 25.7 /100 | #198 | Fair $98,201 |
| Whites/Caucasians | 24.6 /100 | #199 | Fair $98,091 |
| Immigrants | Kenya | 23.5 /100 | #200 | Fair $97,964 |
| Yugoslavians | 20.0 /100 | #201 | Fair $97,558 |
| Tlingit-Haida | 18.9 /100 | #202 | Poor $97,417 |
| Immigrants | Thailand | 18.8 /100 | #203 | Poor $97,400 |
| Immigrants | Eritrea | 18.6 /100 | #204 | Poor $97,373 |
| Immigrants | Colombia | 18.0 /100 | #205 | Poor $97,290 |
| Immigrants | Africa | 17.9 /100 | #206 | Poor $97,284 |
| Ghanaians | 17.9 /100 | #207 | Poor $97,277 |
Demographics Similar to Zimbabweans by Householder Income Ages 45 - 64 years
In terms of householder income ages 45 - 64 years, the demographic groups most similar to Zimbabweans are Immigrants from Fiji ($106,952, a difference of 0.10%), Armenian ($107,002, a difference of 0.14%), Macedonian ($107,074, a difference of 0.21%), Immigrants from Ukraine ($107,079, a difference of 0.22%), and Chilean ($106,611, a difference of 0.22%).
| Demographics | Rating | Rank | Householder Income Ages 45 - 64 years |
| Immigrants | Kazakhstan | 97.2 /100 | #101 | Exceptional $107,378 |
| Immigrants | Moldova | 97.1 /100 | #102 | Exceptional $107,357 |
| Syrians | 96.9 /100 | #103 | Exceptional $107,207 |
| Immigrants | Ukraine | 96.7 /100 | #104 | Exceptional $107,079 |
| Macedonians | 96.7 /100 | #105 | Exceptional $107,074 |
| Armenians | 96.6 /100 | #106 | Exceptional $107,002 |
| Immigrants | Fiji | 96.5 /100 | #107 | Exceptional $106,952 |
| Zimbabweans | 96.3 /100 | #108 | Exceptional $106,849 |
| Chileans | 95.9 /100 | #109 | Exceptional $106,611 |
| Immigrants | Brazil | 95.6 /100 | #110 | Exceptional $106,470 |
| Immigrants | Vietnam | 95.5 /100 | #111 | Exceptional $106,417 |
| Swedes | 95.4 /100 | #112 | Exceptional $106,377 |
| Europeans | 95.4 /100 | #113 | Exceptional $106,367 |
| Immigrants | Poland | 95.3 /100 | #114 | Exceptional $106,319 |
| Immigrants | Kuwait | 95.2 /100 | #115 | Exceptional $106,285 |