Immigrants from Kenya vs Choctaw Householder Income Ages 45 - 64 years
COMPARE
Immigrants from Kenya
Choctaw
Householder Income Ages 45 - 64 years
Householder Income Ages 45 - 64 years Comparison
Immigrants from Kenya
Choctaw
$97,964
HOUSEHOLDER INCOME AGES 45 - 64 YEARS
23.5/ 100
METRIC RATING
200th/ 347
METRIC RANK
$82,287
HOUSEHOLDER INCOME AGES 45 - 64 YEARS
0.0/ 100
METRIC RATING
318th/ 347
METRIC RANK
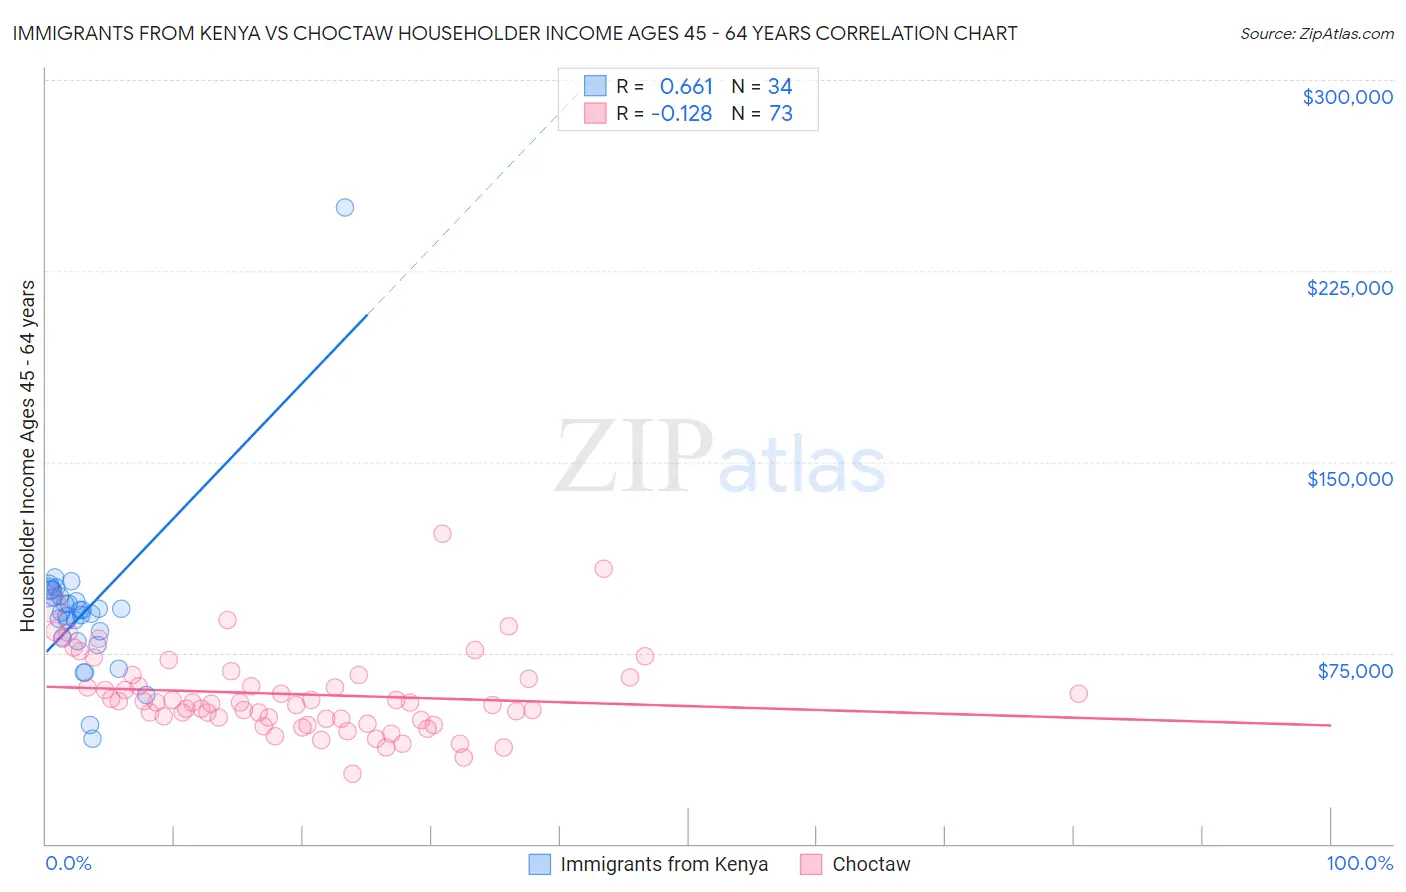
Immigrants from Kenya vs Choctaw Householder Income Ages 45 - 64 years Correlation Chart
The statistical analysis conducted on geographies consisting of 217,894,820 people shows a significant positive correlation between the proportion of Immigrants from Kenya and household income with householder between the ages 45 and 64 in the United States with a correlation coefficient (R) of 0.661 and weighted average of $97,964. Similarly, the statistical analysis conducted on geographies consisting of 269,212,167 people shows a poor negative correlation between the proportion of Choctaw and household income with householder between the ages 45 and 64 in the United States with a correlation coefficient (R) of -0.128 and weighted average of $82,287, a difference of 19.1%.
Householder Income Ages 45 - 64 years Correlation Summary
| Measurement | Immigrants from Kenya | Choctaw |
| Minimum | $41,343 | $27,500 |
| Maximum | $250,001 | $121,667 |
| Range | $208,658 | $94,167 |
| Mean | $91,195 | $58,687 |
| Median | $91,314 | $55,469 |
| Interquartile 25% (IQ1) | $80,833 | $48,732 |
| Interquartile 75% (IQ3) | $97,063 | $65,840 |
| Interquartile Range (IQR) | $16,231 | $17,109 |
| Standard Deviation (Sample) | $31,961 | $16,580 |
| Standard Deviation (Population) | $31,487 | $16,466 |
Similar Demographics by Householder Income Ages 45 - 64 years
Demographics Similar to Immigrants from Kenya by Householder Income Ages 45 - 64 years
In terms of householder income ages 45 - 64 years, the demographic groups most similar to Immigrants from Kenya are White/Caucasian ($98,091, a difference of 0.13%), Immigrants from Iraq ($98,201, a difference of 0.24%), Puget Sound Salish ($98,340, a difference of 0.38%), Yugoslavian ($97,558, a difference of 0.42%), and Immigrants from Eastern Africa ($98,467, a difference of 0.51%).
| Demographics | Rating | Rank | Householder Income Ages 45 - 64 years |
| Hawaiians | 31.6 /100 | #193 | Fair $98,778 |
| Uruguayans | 30.3 /100 | #194 | Fair $98,660 |
| Spanish | 29.2 /100 | #195 | Fair $98,554 |
| Immigrants | Eastern Africa | 28.3 /100 | #196 | Fair $98,467 |
| Puget Sound Salish | 27.0 /100 | #197 | Fair $98,340 |
| Immigrants | Iraq | 25.7 /100 | #198 | Fair $98,201 |
| Whites/Caucasians | 24.6 /100 | #199 | Fair $98,091 |
| Immigrants | Kenya | 23.5 /100 | #200 | Fair $97,964 |
| Yugoslavians | 20.0 /100 | #201 | Fair $97,558 |
| Tlingit-Haida | 18.9 /100 | #202 | Poor $97,417 |
| Immigrants | Thailand | 18.8 /100 | #203 | Poor $97,400 |
| Immigrants | Eritrea | 18.6 /100 | #204 | Poor $97,373 |
| Immigrants | Colombia | 18.0 /100 | #205 | Poor $97,290 |
| Immigrants | Africa | 17.9 /100 | #206 | Poor $97,284 |
| Ghanaians | 17.9 /100 | #207 | Poor $97,277 |
Demographics Similar to Choctaw by Householder Income Ages 45 - 64 years
In terms of householder income ages 45 - 64 years, the demographic groups most similar to Choctaw are Chickasaw ($82,193, a difference of 0.11%), Apache ($82,184, a difference of 0.13%), Yuman ($82,139, a difference of 0.18%), Colville ($82,474, a difference of 0.23%), and Immigrants from Caribbean ($82,513, a difference of 0.28%).
| Demographics | Rating | Rank | Householder Income Ages 45 - 64 years |
| Immigrants | Bahamas | 0.0 /100 | #311 | Tragic $83,177 |
| Cajuns | 0.0 /100 | #312 | Tragic $83,015 |
| U.S. Virgin Islanders | 0.0 /100 | #313 | Tragic $82,736 |
| Immigrants | Honduras | 0.0 /100 | #314 | Tragic $82,697 |
| Paiute | 0.0 /100 | #315 | Tragic $82,629 |
| Immigrants | Caribbean | 0.0 /100 | #316 | Tragic $82,513 |
| Colville | 0.0 /100 | #317 | Tragic $82,474 |
| Choctaw | 0.0 /100 | #318 | Tragic $82,287 |
| Chickasaw | 0.0 /100 | #319 | Tragic $82,193 |
| Apache | 0.0 /100 | #320 | Tragic $82,184 |
| Yuman | 0.0 /100 | #321 | Tragic $82,139 |
| Sioux | 0.0 /100 | #322 | Tragic $81,750 |
| Bahamians | 0.0 /100 | #323 | Tragic $81,369 |
| Yup'ik | 0.0 /100 | #324 | Tragic $81,000 |
| Immigrants | Cuba | 0.0 /100 | #325 | Tragic $80,662 |