Immigrants from Hungary vs Moroccan Householder Income Under 25 years
COMPARE
Immigrants from Hungary
Moroccan
Householder Income Under 25 years
Householder Income Under 25 years Comparison
Immigrants from Hungary
Moroccans
$52,798
HOUSEHOLDER INCOME UNDER 25 YEARS
81.6/ 100
METRIC RATING
146th/ 347
METRIC RANK
$53,256
HOUSEHOLDER INCOME UNDER 25 YEARS
93.1/ 100
METRIC RATING
132nd/ 347
METRIC RANK
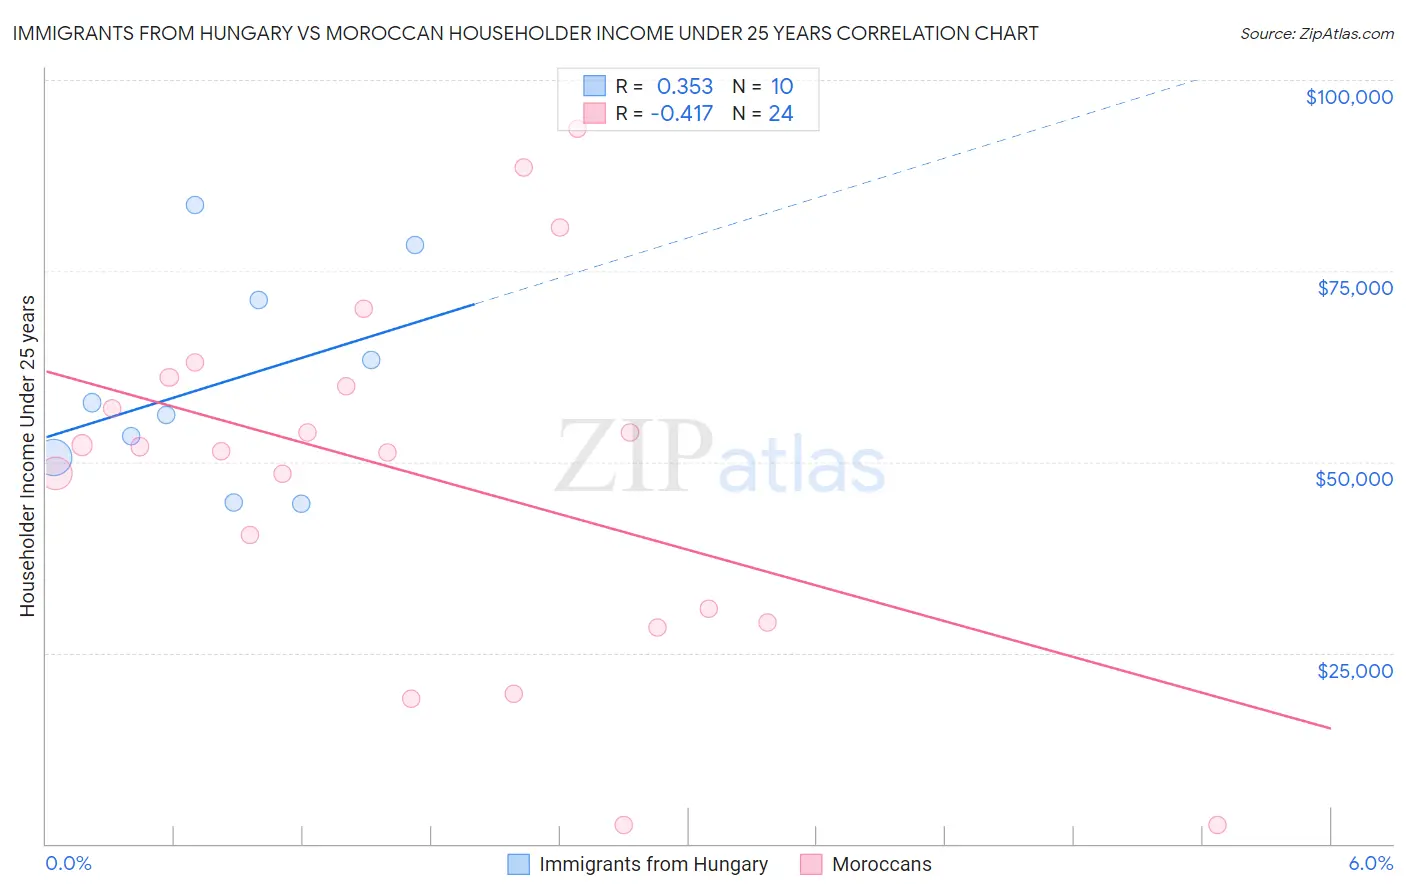
Immigrants from Hungary vs Moroccan Householder Income Under 25 years Correlation Chart
The statistical analysis conducted on geographies consisting of 172,348,525 people shows a mild positive correlation between the proportion of Immigrants from Hungary and household income with householder under the age of 25 in the United States with a correlation coefficient (R) of 0.353 and weighted average of $52,798. Similarly, the statistical analysis conducted on geographies consisting of 180,752,865 people shows a moderate negative correlation between the proportion of Moroccans and household income with householder under the age of 25 in the United States with a correlation coefficient (R) of -0.417 and weighted average of $53,256, a difference of 0.87%.
Householder Income Under 25 years Correlation Summary
| Measurement | Immigrants from Hungary | Moroccan |
| Minimum | $44,480 | $2,499 |
| Maximum | $83,563 | $93,569 |
| Range | $39,083 | $91,070 |
| Mean | $60,366 | $48,217 |
| Median | $56,972 | $51,677 |
| Interquartile 25% (IQ1) | $50,615 | $29,861 |
| Interquartile 75% (IQ3) | $71,208 | $60,431 |
| Interquartile Range (IQR) | $20,593 | $30,570 |
| Standard Deviation (Sample) | $13,557 | $23,674 |
| Standard Deviation (Population) | $12,862 | $23,176 |
Demographics Similar to Immigrants from Hungary and Moroccans by Householder Income Under 25 years
In terms of householder income under 25 years, the demographic groups most similar to Immigrants from Hungary are Latvian ($52,783, a difference of 0.030%), French Canadian ($52,672, a difference of 0.24%), Scandinavian ($52,654, a difference of 0.27%), Immigrants from Western Europe ($52,957, a difference of 0.30%), and South American Indian ($52,979, a difference of 0.34%). Similarly, the demographic groups most similar to Moroccans are Immigrants from Nicaragua ($53,266, a difference of 0.020%), Nicaraguan ($53,275, a difference of 0.030%), New Zealander ($53,294, a difference of 0.070%), Immigrants ($53,201, a difference of 0.10%), and Immigrants from Northern Africa ($53,185, a difference of 0.13%).
| Demographics | Rating | Rank | Householder Income Under 25 years |
| New Zealanders | 93.7 /100 | #129 | Exceptional $53,294 |
| Nicaraguans | 93.4 /100 | #130 | Exceptional $53,275 |
| Immigrants | Nicaragua | 93.3 /100 | #131 | Exceptional $53,266 |
| Moroccans | 93.1 /100 | #132 | Exceptional $53,256 |
| Immigrants | Immigrants | 92.2 /100 | #133 | Exceptional $53,201 |
| Immigrants | Northern Africa | 91.9 /100 | #134 | Exceptional $53,185 |
| Chileans | 91.9 /100 | #135 | Exceptional $53,185 |
| Armenians | 91.8 /100 | #136 | Exceptional $53,179 |
| Immigrants | Barbados | 91.5 /100 | #137 | Exceptional $53,163 |
| Norwegians | 90.8 /100 | #138 | Exceptional $53,127 |
| Costa Ricans | 90.4 /100 | #139 | Exceptional $53,106 |
| Hawaiians | 89.8 /100 | #140 | Excellent $53,078 |
| Danes | 88.9 /100 | #141 | Excellent $53,041 |
| Immigrants | Armenia | 87.5 /100 | #142 | Excellent $52,986 |
| Swedes | 87.5 /100 | #143 | Excellent $52,986 |
| South American Indians | 87.3 /100 | #144 | Excellent $52,979 |
| Immigrants | Western Europe | 86.7 /100 | #145 | Excellent $52,957 |
| Immigrants | Hungary | 81.6 /100 | #146 | Excellent $52,798 |
| Latvians | 81.0 /100 | #147 | Excellent $52,783 |
| French Canadians | 76.5 /100 | #148 | Good $52,672 |
| Scandinavians | 75.7 /100 | #149 | Good $52,654 |