Hungarian vs Moroccan Householder Income Under 25 years
COMPARE
Hungarian
Moroccan
Householder Income Under 25 years
Householder Income Under 25 years Comparison
Hungarians
Moroccans
$50,247
HOUSEHOLDER INCOME UNDER 25 YEARS
0.9/ 100
METRIC RATING
261st/ 347
METRIC RANK
$53,256
HOUSEHOLDER INCOME UNDER 25 YEARS
93.1/ 100
METRIC RATING
132nd/ 347
METRIC RANK
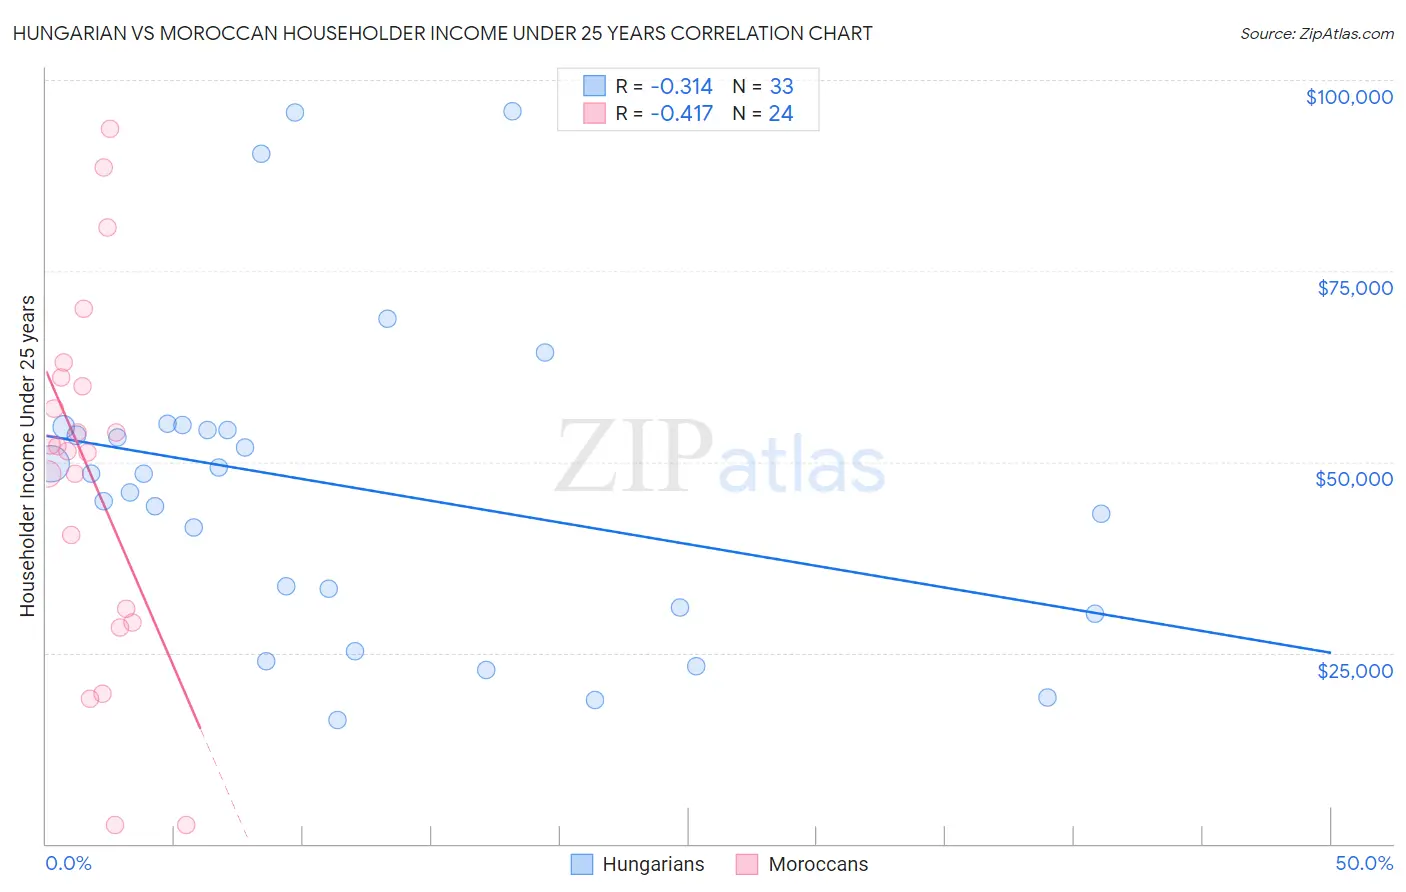
Hungarian vs Moroccan Householder Income Under 25 years Correlation Chart
The statistical analysis conducted on geographies consisting of 392,087,148 people shows a mild negative correlation between the proportion of Hungarians and household income with householder under the age of 25 in the United States with a correlation coefficient (R) of -0.314 and weighted average of $50,247. Similarly, the statistical analysis conducted on geographies consisting of 180,752,865 people shows a moderate negative correlation between the proportion of Moroccans and household income with householder under the age of 25 in the United States with a correlation coefficient (R) of -0.417 and weighted average of $53,256, a difference of 6.0%.
Householder Income Under 25 years Correlation Summary
| Measurement | Hungarian | Moroccan |
| Minimum | $16,220 | $2,499 |
| Maximum | $95,845 | $93,569 |
| Range | $79,625 | $91,070 |
| Mean | $46,639 | $48,217 |
| Median | $48,413 | $51,677 |
| Interquartile 25% (IQ1) | $30,495 | $29,861 |
| Interquartile 75% (IQ3) | $54,364 | $60,431 |
| Interquartile Range (IQR) | $23,869 | $30,570 |
| Standard Deviation (Sample) | $20,516 | $23,674 |
| Standard Deviation (Population) | $20,203 | $23,176 |
Similar Demographics by Householder Income Under 25 years
Demographics Similar to Hungarians by Householder Income Under 25 years
In terms of householder income under 25 years, the demographic groups most similar to Hungarians are Haitian ($50,231, a difference of 0.030%), Hispanic or Latino ($50,279, a difference of 0.060%), Immigrants from Dominican Republic ($50,204, a difference of 0.090%), Immigrants from Dominica ($50,301, a difference of 0.11%), and White/Caucasian ($50,336, a difference of 0.18%).
| Demographics | Rating | Rank | Householder Income Under 25 years |
| Luxembourgers | 1.2 /100 | #254 | Tragic $50,379 |
| Aleuts | 1.2 /100 | #255 | Tragic $50,377 |
| Immigrants | Cuba | 1.2 /100 | #256 | Tragic $50,374 |
| Lebanese | 1.1 /100 | #257 | Tragic $50,355 |
| Whites/Caucasians | 1.1 /100 | #258 | Tragic $50,336 |
| Immigrants | Dominica | 1.0 /100 | #259 | Tragic $50,301 |
| Hispanics or Latinos | 0.9 /100 | #260 | Tragic $50,279 |
| Hungarians | 0.9 /100 | #261 | Tragic $50,247 |
| Haitians | 0.8 /100 | #262 | Tragic $50,231 |
| Immigrants | Dominican Republic | 0.8 /100 | #263 | Tragic $50,204 |
| Fijians | 0.6 /100 | #264 | Tragic $50,132 |
| Belgians | 0.6 /100 | #265 | Tragic $50,113 |
| Immigrants | Venezuela | 0.6 /100 | #266 | Tragic $50,109 |
| Immigrants | Laos | 0.5 /100 | #267 | Tragic $50,041 |
| Venezuelans | 0.5 /100 | #268 | Tragic $50,011 |
Demographics Similar to Moroccans by Householder Income Under 25 years
In terms of householder income under 25 years, the demographic groups most similar to Moroccans are Immigrants from Nicaragua ($53,266, a difference of 0.020%), Nicaraguan ($53,275, a difference of 0.030%), New Zealander ($53,294, a difference of 0.070%), Immigrants from Bulgaria ($53,305, a difference of 0.090%), and Immigrants from North America ($53,307, a difference of 0.10%).
| Demographics | Rating | Rank | Householder Income Under 25 years |
| Pakistanis | 94.1 /100 | #125 | Exceptional $53,325 |
| Immigrants | Serbia | 94.1 /100 | #126 | Exceptional $53,321 |
| Immigrants | North America | 93.9 /100 | #127 | Exceptional $53,307 |
| Immigrants | Bulgaria | 93.9 /100 | #128 | Exceptional $53,305 |
| New Zealanders | 93.7 /100 | #129 | Exceptional $53,294 |
| Nicaraguans | 93.4 /100 | #130 | Exceptional $53,275 |
| Immigrants | Nicaragua | 93.3 /100 | #131 | Exceptional $53,266 |
| Moroccans | 93.1 /100 | #132 | Exceptional $53,256 |
| Immigrants | Immigrants | 92.2 /100 | #133 | Exceptional $53,201 |
| Immigrants | Northern Africa | 91.9 /100 | #134 | Exceptional $53,185 |
| Chileans | 91.9 /100 | #135 | Exceptional $53,185 |
| Armenians | 91.8 /100 | #136 | Exceptional $53,179 |
| Immigrants | Barbados | 91.5 /100 | #137 | Exceptional $53,163 |
| Norwegians | 90.8 /100 | #138 | Exceptional $53,127 |
| Costa Ricans | 90.4 /100 | #139 | Exceptional $53,106 |