Immigrants from Cabo Verde vs Immigrants from China Householder Income Under 25 years

COMPARE

Immigrants from Cabo Verde
Race
Ancestry
AfghanAfricanAlaska NativeAlaskan AthabascanAlbanianAleutAlsatianAmericanApacheArabArapahoArgentineanArmenianAssyrian/Chaldean/SyriacAustralianAustrianBahamianBangladeshiBarbadianBasqueBelgianBelizeanBermudanBhutaneseBlackfeetBolivianBrazilianBritishBritish West IndianBulgarianBurmeseCajunCambodianCanadianCape VerdeanCarpatho RusynCelticCentral AmericanCentral American IndianCherokeeCheyenneChickasawChileanChineseChippewaChoctawColombianColvilleComancheCosta RicanCreeCreekCroatianCrowCubanCypriotCzechCzechoslovakianDanishDelawareDominicanDutchDutch West IndianEastern EuropeanEcuadorianEgyptianEnglishEstonianEthiopianEuropeanFijianFilipinoFinnishFrenchFrench American IndianFrench CanadianGermanGerman RussianGhanaianGreekGuamanian/ChamorroGuatemalanGuyaneseHaitianHmongHonduranHopiHoumaHungarianIcelanderIndian (Asian)IndonesianInupiatIranianIraqiIrishIroquoisIsraeliItalianJamaicanJapaneseJordanianKenyanKiowaKoreanLaotianLatvianLebaneseLiberianLithuanianLumbeeLuxembourgerMacedonianMalaysianMalteseMarshalleseMenomineeMexicanMexican American IndianMongolianMoroccanNative HawaiianNavajoNepaleseNew ZealanderNicaraguanNigerianNorthern EuropeanNorwegianOkinawanOsageOttawaPaiutePakistaniPalestinianPanamanianParaguayanPennsylvania GermanPeruvianPimaPolishPortuguesePotawatomiPuebloPuerto RicanPuget Sound SalishRomanianRussianSalvadoranSamoanScandinavianScotch-IrishScottishSeminoleSenegaleseSerbianShoshoneSierra LeoneanSiouxSlavicSlovakSloveneSomaliSouth AfricanSouth AmericanSouth American IndianSoviet UnionSpaniardSpanishSpanish AmericanSpanish American IndianSri LankanSubsaharan AfricanSudaneseSwedishSwissSyrianTaiwaneseThaiTlingit-HaidaTohono O'OdhamTonganTrinidadian and TobagonianTsimshianTurkishU.S. Virgin IslanderUgandanUkrainianUruguayanUteVenezuelanVietnameseWelshWest IndianYakamaYaquiYugoslavianYumanYup'ikZimbabwean
Immigration
NonimmigrantsImmigrantsAfghanistanAfricaAlbaniaArgentinaArmeniaAsiaAustraliaAustriaBahamasBangladeshBarbadosBelarusBelgiumBelizeBoliviaBosnia and HerzegovinaBrazilBulgariaBurma/MyanmarCabo VerdeCambodiaCameroonCanadaCaribbeanCentral AmericaChileColombiaCongoCosta RicaCroatiaCubaCzechoslovakiaDenmarkDominicaDominican RepublicEastern AfricaEastern AsiaEastern EuropeEcuadorEgyptEl SalvadorEnglandEritreaEthiopiaEuropeFijiFranceGermanyGhanaGreeceGrenadaGuatemalaGuyanaHaitiHondurasHong KongHungaryIndiaIndonesiaIranIraqIrelandIsraelItalyJamaicaJapanJordanKazakhstanKenyaKoreaKuwaitLaosLatin AmericaLatviaLebanonLiberiaLithuaniaMalaysiaMexicoMicronesiaMiddle AfricaMoldovaMoroccoNepalNetherlandsNicaraguaNigeriaNorth AmericaNorth MacedoniaNorthern AfricaNorthern EuropeNorwayOceaniaPakistanPanamaPeruPhilippinesPolandPortugalRomaniaRussiaSaudi ArabiaScotlandSenegalSerbiaSierra LeoneSingaporeSomaliaSouth AfricaSouth AmericaSouth Central AsiaSouth Eastern AsiaSouthern EuropeSpainSri LankaSt. Vincent and the GrenadinesSudanSwedenSwitzerlandSyriaTaiwanThailandTrinidad and TobagoTurkeyUgandaUkraineUruguayUzbekistanVenezuelaVietnamWest IndiesWestern AfricaWestern AsiaWestern EuropeYemenZaireZimbabweAzores
Immigrants from China
Race
Ancestry
AfghanAfricanAlaska NativeAlaskan AthabascanAlbanianAleutAlsatianAmericanApacheArabArapahoArgentineanArmenianAssyrian/Chaldean/SyriacAustralianAustrianBahamianBangladeshiBarbadianBasqueBelgianBelizeanBermudanBhutaneseBlackfeetBolivianBrazilianBritishBritish West IndianBulgarianBurmeseCajunCambodianCanadianCape VerdeanCarpatho RusynCelticCentral AmericanCentral American IndianCherokeeCheyenneChickasawChileanChineseChippewaChoctawColombianColvilleComancheCosta RicanCreeCreekCroatianCrowCubanCypriotCzechCzechoslovakianDanishDelawareDominicanDutchDutch West IndianEastern EuropeanEcuadorianEgyptianEnglishEstonianEthiopianEuropeanFijianFilipinoFinnishFrenchFrench American IndianFrench CanadianGermanGerman RussianGhanaianGreekGuamanian/ChamorroGuatemalanGuyaneseHaitianHmongHonduranHopiHoumaHungarianIcelanderIndian (Asian)IndonesianInupiatIranianIraqiIrishIroquoisIsraeliItalianJamaicanJapaneseJordanianKenyanKiowaKoreanLaotianLatvianLebaneseLiberianLithuanianLumbeeLuxembourgerMacedonianMalaysianMalteseMarshalleseMenomineeMexicanMexican American IndianMongolianMoroccanNative HawaiianNavajoNepaleseNew ZealanderNicaraguanNigerianNorthern EuropeanNorwegianOkinawanOsageOttawaPaiutePakistaniPalestinianPanamanianParaguayanPennsylvania GermanPeruvianPimaPolishPortuguesePotawatomiPuebloPuerto RicanPuget Sound SalishRomanianRussianSalvadoranSamoanScandinavianScotch-IrishScottishSeminoleSenegaleseSerbianShoshoneSierra LeoneanSiouxSlavicSlovakSloveneSomaliSouth AfricanSouth AmericanSouth American IndianSoviet UnionSpaniardSpanishSpanish AmericanSpanish American IndianSri LankanSubsaharan AfricanSudaneseSwedishSwissSyrianTaiwaneseThaiTlingit-HaidaTohono O'OdhamTonganTrinidadian and TobagonianTsimshianTurkishU.S. Virgin IslanderUgandanUkrainianUruguayanUteVenezuelanVietnameseWelshWest IndianYakamaYaquiYugoslavianYumanYup'ikZimbabwean
Immigration
NonimmigrantsImmigrantsAfghanistanAfricaAlbaniaArgentinaArmeniaAsiaAustraliaAustriaBahamasBangladeshBarbadosBelarusBelgiumBelizeBoliviaBosnia and HerzegovinaBrazilBulgariaBurma/MyanmarCambodiaCameroonCanadaCaribbeanCentral AmericaChileChinaColombiaCongoCosta RicaCroatiaCubaCzechoslovakiaDenmarkDominicaDominican RepublicEastern AfricaEastern AsiaEastern EuropeEcuadorEgyptEl SalvadorEnglandEritreaEthiopiaEuropeFijiFranceGermanyGhanaGreeceGrenadaGuatemalaGuyanaHaitiHondurasHong KongHungaryIndiaIndonesiaIranIraqIrelandIsraelItalyJamaicaJapanJordanKazakhstanKenyaKoreaKuwaitLaosLatin AmericaLatviaLebanonLiberiaLithuaniaMalaysiaMexicoMicronesiaMiddle AfricaMoldovaMoroccoNepalNetherlandsNicaraguaNigeriaNorth AmericaNorth MacedoniaNorthern AfricaNorthern EuropeNorwayOceaniaPakistanPanamaPeruPhilippinesPolandPortugalRomaniaRussiaSaudi ArabiaScotlandSenegalSerbiaSierra LeoneSingaporeSomaliaSouth AfricaSouth AmericaSouth Central AsiaSouth Eastern AsiaSouthern EuropeSpainSri LankaSt. Vincent and the GrenadinesSudanSwedenSwitzerlandSyriaTaiwanThailandTrinidad and TobagoTurkeyUgandaUkraineUruguayUzbekistanVenezuelaVietnamWest IndiesWestern AfricaWestern AsiaWestern EuropeYemenZaireZimbabweAzores
Householder Income Under 25 years
Income
Poverty
Unemployment
Labor Participation
Family Structure
Vehicle Availability
Education Level
Disability

Householder Income Under 25 years Comparison

Immigrants from Cabo Verde

Immigrants from China

Tragic
Exceptional
$50,520
HOUSEHOLDER INCOME UNDER 25 YEARS
1.7/ 100
METRIC RATING
250th/ 347
METRIC RANK
$57,931
HOUSEHOLDER INCOME UNDER 25 YEARS
100.0/ 100
METRIC RATING
11th/ 347
METRIC RANK

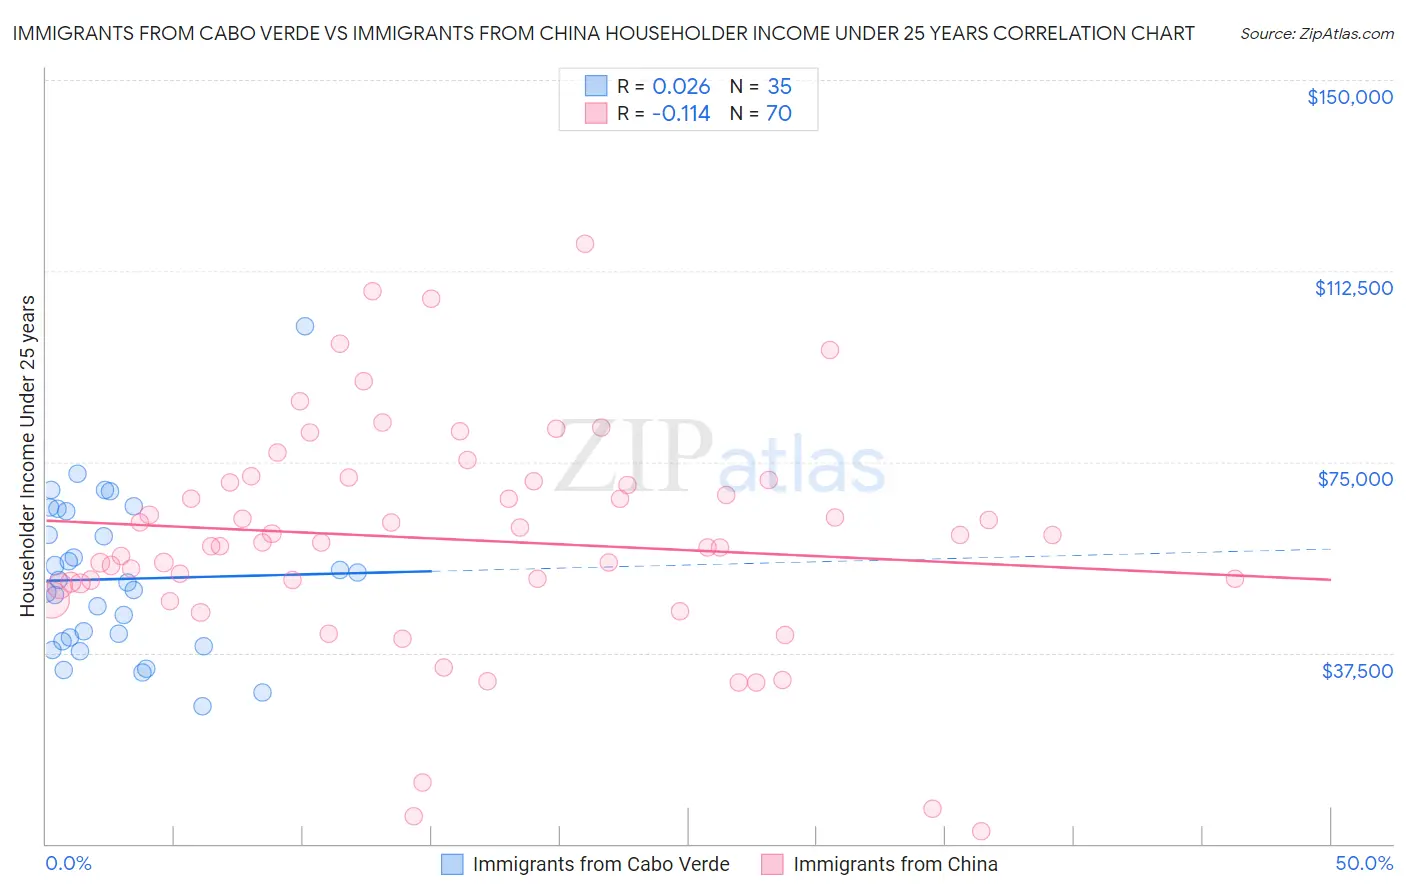
Immigrants from Cabo Verde vs Immigrants from China Householder Income Under 25 years Correlation Chart

The statistical analysis conducted on geographies consisting of 35,492,086 people shows no correlation between the proportion of Immigrants from Cabo Verde and household income with householder under the age of 25 in the United States with a correlation coefficient (R) of 0.026 and weighted average of $50,520. Similarly, the statistical analysis conducted on geographies consisting of 376,634,050 people shows a poor negative correlation between the proportion of Immigrants from China and household income with householder under the age of 25 in the United States with a correlation coefficient (R) of -0.114 and weighted average of $57,931, a difference of 14.7%.
Immigrants from Cabo Verde vs Immigrants from China Householder Income Under 25 years

Householder Income Under 25 years Correlation Summary

MeasurementImmigrants from Cabo VerdeImmigrants from China
Minimum$26,996$2,499
Maximum$101,579$117,772
Range$74,583$115,273
Mean$51,989$59,820
Median$51,250$59,134
Interquartile 25% (IQ1)$39,752$51,147
Interquartile 75% (IQ3)$65,342$71,074
Interquartile Range (IQR)$25,590$19,928
Standard Deviation (Sample)$15,345$22,263
Standard Deviation (Population)$15,125$22,103

Similar Demographics by Householder Income Under 25 years

Demographics Similar to Immigrants from Cabo Verde by Householder Income Under 25 years

In terms of householder income under 25 years, the demographic groups most similar to Immigrants from Cabo Verde are Scottish ($50,554, a difference of 0.070%), Immigrants from Bosnia and Herzegovina ($50,565, a difference of 0.090%), Slavic ($50,563, a difference of 0.090%), Celtic ($50,447, a difference of 0.14%), and Welsh ($50,597, a difference of 0.15%).
DemographicsRating | RankHouseholder Income Under 25 years
Immigrants | Thailand
2.2
/100
|
#243
Tragic
$50,645
Marshallese
2.1
/100
|
#244
Tragic
$50,627
Immigrants | Africa
2.0
/100
|
#245
Tragic
$50,609
Welsh
2.0
/100
|
#246
Tragic
$50,597
Immigrants | Bosnia and Herzegovina
1.8
/100
|
#247
Tragic
$50,565
Slavs
1.8
/100
|
#248
Tragic
$50,563
Scottish
1.8
/100
|
#249
Tragic
$50,554
Immigrants | Cabo Verde
1.7
/100
|
#250
Tragic
$50,520
Celtics
1.4
/100
|
#251
Tragic
$50,447
Immigrants | Mexico
1.3
/100
|
#252
Tragic
$50,422
Immigrants | Haiti
1.2
/100
|
#253
Tragic
$50,398
Luxembourgers
1.2
/100
|
#254
Tragic
$50,379
Aleuts
1.2
/100
|
#255
Tragic
$50,377
Immigrants | Cuba
1.2
/100
|
#256
Tragic
$50,374
Lebanese
1.1
/100
|
#257
Tragic
$50,355

Demographics Similar to Immigrants from China by Householder Income Under 25 years

In terms of householder income under 25 years, the demographic groups most similar to Immigrants from China are Immigrants from Philippines ($57,930, a difference of 0.0%), Afghan ($58,019, a difference of 0.15%), Immigrants from South Central Asia ($57,818, a difference of 0.20%), Filipino ($57,740, a difference of 0.33%), and Korean ($57,730, a difference of 0.35%).
DemographicsRating | RankHouseholder Income Under 25 years
Immigrants | Taiwan
100.0
/100
|
#4
Exceptional
$59,424
Immigrants | Bolivia
100.0
/100
|
#5
Exceptional
$59,389
Thais
100.0
/100
|
#6
Exceptional
$59,187
Bolivians
100.0
/100
|
#7
Exceptional
$58,506
Indians (Asian)
100.0
/100
|
#8
Exceptional
$58,239
Chinese
100.0
/100
|
#9
Exceptional
$58,162
Afghans
100.0
/100
|
#10
Exceptional
$58,019
Immigrants | China
100.0
/100
|
#11
Exceptional
$57,931
Immigrants | Philippines
100.0
/100
|
#12
Exceptional
$57,930
Immigrants | South Central Asia
100.0
/100
|
#13
Exceptional
$57,818
Filipinos
100.0
/100
|
#14
Exceptional
$57,740
Koreans
100.0
/100
|
#15
Exceptional
$57,730
Immigrants | Afghanistan
100.0
/100
|
#16
Exceptional
$57,478
Sierra Leoneans
100.0
/100
|
#17
Exceptional
$57,272
Immigrants | Eastern Asia
100.0
/100
|
#18
Exceptional
$57,123