Immigrants from Cabo Verde vs Chickasaw Householder Income Under 25 years
COMPARE
Immigrants from Cabo Verde
Chickasaw
Householder Income Under 25 years
Householder Income Under 25 years Comparison
Immigrants from Cabo Verde
Chickasaw
$50,520
HOUSEHOLDER INCOME UNDER 25 YEARS
1.7/ 100
METRIC RATING
250th/ 347
METRIC RANK
$44,763
HOUSEHOLDER INCOME UNDER 25 YEARS
0.0/ 100
METRIC RATING
338th/ 347
METRIC RANK
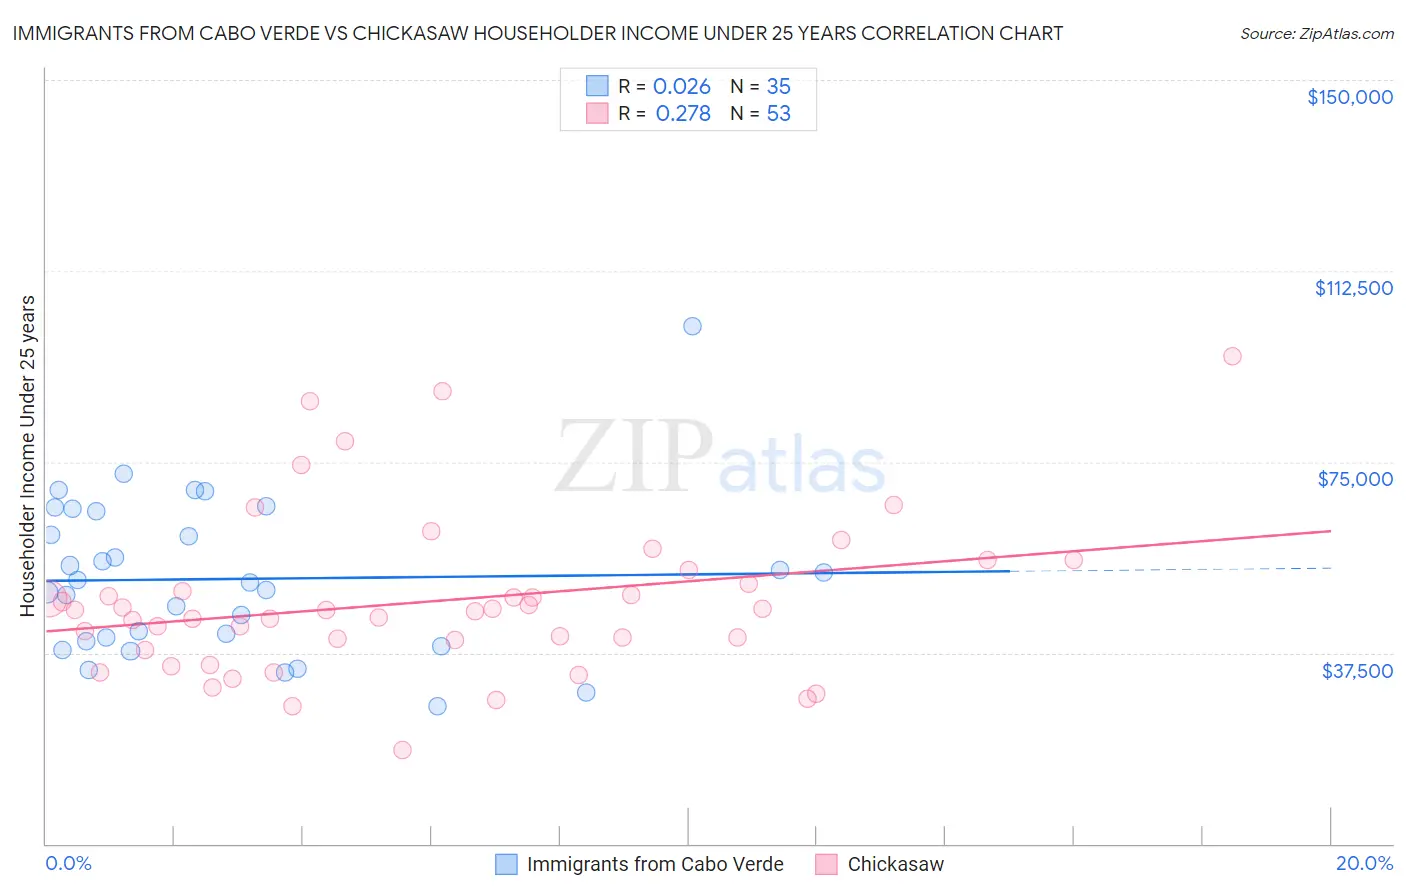
Immigrants from Cabo Verde vs Chickasaw Householder Income Under 25 years Correlation Chart
The statistical analysis conducted on geographies consisting of 35,492,086 people shows no correlation between the proportion of Immigrants from Cabo Verde and household income with householder under the age of 25 in the United States with a correlation coefficient (R) of 0.026 and weighted average of $50,520. Similarly, the statistical analysis conducted on geographies consisting of 137,295,377 people shows a weak positive correlation between the proportion of Chickasaw and household income with householder under the age of 25 in the United States with a correlation coefficient (R) of 0.278 and weighted average of $44,763, a difference of 12.9%.
Householder Income Under 25 years Correlation Summary
| Measurement | Immigrants from Cabo Verde | Chickasaw |
| Minimum | $26,996 | $18,415 |
| Maximum | $101,579 | $95,833 |
| Range | $74,583 | $77,418 |
| Mean | $51,989 | $47,638 |
| Median | $51,250 | $45,852 |
| Interquartile 25% (IQ1) | $39,752 | $38,980 |
| Interquartile 75% (IQ3) | $65,342 | $52,456 |
| Interquartile Range (IQR) | $25,590 | $13,476 |
| Standard Deviation (Sample) | $15,345 | $15,738 |
| Standard Deviation (Population) | $15,125 | $15,588 |
Similar Demographics by Householder Income Under 25 years
Demographics Similar to Immigrants from Cabo Verde by Householder Income Under 25 years
In terms of householder income under 25 years, the demographic groups most similar to Immigrants from Cabo Verde are Scottish ($50,554, a difference of 0.070%), Immigrants from Bosnia and Herzegovina ($50,565, a difference of 0.090%), Slavic ($50,563, a difference of 0.090%), Celtic ($50,447, a difference of 0.14%), and Welsh ($50,597, a difference of 0.15%).
| Demographics | Rating | Rank | Householder Income Under 25 years |
| Immigrants | Thailand | 2.2 /100 | #243 | Tragic $50,645 |
| Marshallese | 2.1 /100 | #244 | Tragic $50,627 |
| Immigrants | Africa | 2.0 /100 | #245 | Tragic $50,609 |
| Welsh | 2.0 /100 | #246 | Tragic $50,597 |
| Immigrants | Bosnia and Herzegovina | 1.8 /100 | #247 | Tragic $50,565 |
| Slavs | 1.8 /100 | #248 | Tragic $50,563 |
| Scottish | 1.8 /100 | #249 | Tragic $50,554 |
| Immigrants | Cabo Verde | 1.7 /100 | #250 | Tragic $50,520 |
| Celtics | 1.4 /100 | #251 | Tragic $50,447 |
| Immigrants | Mexico | 1.3 /100 | #252 | Tragic $50,422 |
| Immigrants | Haiti | 1.2 /100 | #253 | Tragic $50,398 |
| Luxembourgers | 1.2 /100 | #254 | Tragic $50,379 |
| Aleuts | 1.2 /100 | #255 | Tragic $50,377 |
| Immigrants | Cuba | 1.2 /100 | #256 | Tragic $50,374 |
| Lebanese | 1.1 /100 | #257 | Tragic $50,355 |
Demographics Similar to Chickasaw by Householder Income Under 25 years
In terms of householder income under 25 years, the demographic groups most similar to Chickasaw are Kiowa ($44,733, a difference of 0.070%), Pueblo ($45,018, a difference of 0.57%), Black/African American ($44,381, a difference of 0.86%), Houma ($44,356, a difference of 0.92%), and Tohono O'odham ($45,248, a difference of 1.1%).
| Demographics | Rating | Rank | Householder Income Under 25 years |
| Immigrants | Zaire | 0.0 /100 | #331 | Tragic $45,529 |
| Choctaw | 0.0 /100 | #332 | Tragic $45,450 |
| Creek | 0.0 /100 | #333 | Tragic $45,371 |
| Cajuns | 0.0 /100 | #334 | Tragic $45,338 |
| Cheyenne | 0.0 /100 | #335 | Tragic $45,275 |
| Tohono O'odham | 0.0 /100 | #336 | Tragic $45,248 |
| Pueblo | 0.0 /100 | #337 | Tragic $45,018 |
| Chickasaw | 0.0 /100 | #338 | Tragic $44,763 |
| Kiowa | 0.0 /100 | #339 | Tragic $44,733 |
| Blacks/African Americans | 0.0 /100 | #340 | Tragic $44,381 |
| Houma | 0.0 /100 | #341 | Tragic $44,356 |
| Arapaho | 0.0 /100 | #342 | Tragic $44,003 |
| Immigrants | Yemen | 0.0 /100 | #343 | Tragic $43,591 |
| Immigrants | Congo | 0.0 /100 | #344 | Tragic $43,266 |
| Navajo | 0.0 /100 | #345 | Tragic $42,380 |