Immigrants from Asia vs Immigrants from Germany Median Earnings

COMPARE

Immigrants from Asia
Race
Ancestry
AfghanAfricanAlaska NativeAlaskan AthabascanAlbanianAleutAlsatianAmericanApacheArabArapahoArgentineanArmenianAssyrian/Chaldean/SyriacAustralianAustrianBahamianBangladeshiBarbadianBasqueBelgianBelizeanBermudanBhutaneseBlackfeetBolivianBrazilianBritishBritish West IndianBulgarianBurmeseCajunCambodianCanadianCape VerdeanCarpatho RusynCelticCentral AmericanCentral American IndianCherokeeCheyenneChickasawChileanChineseChippewaChoctawColombianColvilleComancheCosta RicanCreeCreekCroatianCrowCubanCypriotCzechCzechoslovakianDanishDelawareDominicanDutchDutch West IndianEastern EuropeanEcuadorianEgyptianEnglishEstonianEthiopianEuropeanFijianFilipinoFinnishFrenchFrench American IndianFrench CanadianGermanGerman RussianGhanaianGreekGuamanian/ChamorroGuatemalanGuyaneseHaitianHmongHonduranHopiHoumaHungarianIcelanderIndian (Asian)IndonesianInupiatIranianIraqiIrishIroquoisIsraeliItalianJamaicanJapaneseJordanianKenyanKiowaKoreanLaotianLatvianLebaneseLiberianLithuanianLumbeeLuxembourgerMacedonianMalaysianMalteseMarshalleseMenomineeMexicanMexican American IndianMongolianMoroccanNative HawaiianNavajoNepaleseNew ZealanderNicaraguanNigerianNorthern EuropeanNorwegianOkinawanOsageOttawaPaiutePakistaniPalestinianPanamanianParaguayanPennsylvania GermanPeruvianPimaPolishPortuguesePotawatomiPuebloPuerto RicanPuget Sound SalishRomanianRussianSalvadoranSamoanScandinavianScotch-IrishScottishSeminoleSenegaleseSerbianShoshoneSierra LeoneanSiouxSlavicSlovakSloveneSomaliSouth AfricanSouth AmericanSouth American IndianSoviet UnionSpaniardSpanishSpanish AmericanSpanish American IndianSri LankanSubsaharan AfricanSudaneseSwedishSwissSyrianTaiwaneseThaiTlingit-HaidaTohono O'OdhamTonganTrinidadian and TobagonianTsimshianTurkishU.S. Virgin IslanderUgandanUkrainianUruguayanUteVenezuelanVietnameseWelshWest IndianYakamaYaquiYugoslavianYumanYup'ikZimbabwean
Immigration
NonimmigrantsImmigrantsAfghanistanAfricaAlbaniaArgentinaArmeniaAsiaAustraliaAustriaBahamasBangladeshBarbadosBelarusBelgiumBelizeBoliviaBosnia and HerzegovinaBrazilBulgariaBurma/MyanmarCabo VerdeCambodiaCameroonCanadaCaribbeanCentral AmericaChileChinaColombiaCongoCosta RicaCroatiaCubaCzechoslovakiaDenmarkDominicaDominican RepublicEastern AfricaEastern AsiaEastern EuropeEcuadorEgyptEl SalvadorEnglandEritreaEthiopiaEuropeFijiFranceGhanaGreeceGrenadaGuatemalaGuyanaHaitiHondurasHong KongHungaryIndiaIndonesiaIranIraqIrelandIsraelItalyJamaicaJapanJordanKazakhstanKenyaKoreaKuwaitLaosLatin AmericaLatviaLebanonLiberiaLithuaniaMalaysiaMexicoMicronesiaMiddle AfricaMoldovaMoroccoNepalNetherlandsNicaraguaNigeriaNorth AmericaNorth MacedoniaNorthern AfricaNorthern EuropeNorwayOceaniaPakistanPanamaPeruPhilippinesPolandPortugalRomaniaRussiaSaudi ArabiaScotlandSenegalSerbiaSierra LeoneSingaporeSomaliaSouth AfricaSouth AmericaSouth Central AsiaSouth Eastern AsiaSouthern EuropeSpainSri LankaSt. Vincent and the GrenadinesSudanSwedenSwitzerlandSyriaTaiwanThailandTrinidad and TobagoTurkeyUgandaUkraineUruguayUzbekistanVenezuelaVietnamWest IndiesWestern AfricaWestern AsiaWestern EuropeYemenZaireZimbabweAzores
Immigrants from Germany
Race
Ancestry
AfghanAfricanAlaska NativeAlaskan AthabascanAlbanianAleutAlsatianAmericanApacheArabArapahoArgentineanArmenianAssyrian/Chaldean/SyriacAustralianAustrianBahamianBangladeshiBarbadianBasqueBelgianBelizeanBermudanBhutaneseBlackfeetBolivianBrazilianBritishBritish West IndianBulgarianBurmeseCajunCambodianCanadianCape VerdeanCarpatho RusynCelticCentral AmericanCentral American IndianCherokeeCheyenneChickasawChileanChineseChippewaChoctawColombianColvilleComancheCosta RicanCreeCreekCroatianCrowCubanCypriotCzechCzechoslovakianDanishDelawareDominicanDutchDutch West IndianEastern EuropeanEcuadorianEgyptianEnglishEstonianEthiopianEuropeanFijianFilipinoFinnishFrenchFrench American IndianFrench CanadianGermanGerman RussianGhanaianGreekGuamanian/ChamorroGuatemalanGuyaneseHaitianHmongHonduranHopiHoumaHungarianIcelanderIndian (Asian)IndonesianInupiatIranianIraqiIrishIroquoisIsraeliItalianJamaicanJapaneseJordanianKenyanKiowaKoreanLaotianLatvianLebaneseLiberianLithuanianLumbeeLuxembourgerMacedonianMalaysianMalteseMarshalleseMenomineeMexicanMexican American IndianMongolianMoroccanNative HawaiianNavajoNepaleseNew ZealanderNicaraguanNigerianNorthern EuropeanNorwegianOkinawanOsageOttawaPaiutePakistaniPalestinianPanamanianParaguayanPennsylvania GermanPeruvianPimaPolishPortuguesePotawatomiPuebloPuerto RicanPuget Sound SalishRomanianRussianSalvadoranSamoanScandinavianScotch-IrishScottishSeminoleSenegaleseSerbianShoshoneSierra LeoneanSiouxSlavicSlovakSloveneSomaliSouth AfricanSouth AmericanSouth American IndianSoviet UnionSpaniardSpanishSpanish AmericanSpanish American IndianSri LankanSubsaharan AfricanSudaneseSwedishSwissSyrianTaiwaneseThaiTlingit-HaidaTohono O'OdhamTonganTrinidadian and TobagonianTsimshianTurkishU.S. Virgin IslanderUgandanUkrainianUruguayanUteVenezuelanVietnameseWelshWest IndianYakamaYaquiYugoslavianYumanYup'ikZimbabwean
Immigration
NonimmigrantsImmigrantsAfghanistanAfricaAlbaniaArgentinaArmeniaAustraliaAustriaBahamasBangladeshBarbadosBelarusBelgiumBelizeBoliviaBosnia and HerzegovinaBrazilBulgariaBurma/MyanmarCabo VerdeCambodiaCameroonCanadaCaribbeanCentral AmericaChileChinaColombiaCongoCosta RicaCroatiaCubaCzechoslovakiaDenmarkDominicaDominican RepublicEastern AfricaEastern AsiaEastern EuropeEcuadorEgyptEl SalvadorEnglandEritreaEthiopiaEuropeFijiFranceGermanyGhanaGreeceGrenadaGuatemalaGuyanaHaitiHondurasHong KongHungaryIndiaIndonesiaIranIraqIrelandIsraelItalyJamaicaJapanJordanKazakhstanKenyaKoreaKuwaitLaosLatin AmericaLatviaLebanonLiberiaLithuaniaMalaysiaMexicoMicronesiaMiddle AfricaMoldovaMoroccoNepalNetherlandsNicaraguaNigeriaNorth AmericaNorth MacedoniaNorthern AfricaNorthern EuropeNorwayOceaniaPakistanPanamaPeruPhilippinesPolandPortugalRomaniaRussiaSaudi ArabiaScotlandSenegalSerbiaSierra LeoneSingaporeSomaliaSouth AfricaSouth AmericaSouth Central AsiaSouth Eastern AsiaSouthern EuropeSpainSri LankaSt. Vincent and the GrenadinesSudanSwedenSwitzerlandSyriaTaiwanThailandTrinidad and TobagoTurkeyUgandaUkraineUruguayUzbekistanVenezuelaVietnamWest IndiesWestern AfricaWestern AsiaWestern EuropeYemenZaireZimbabweAzores
Median Earnings
Income
Poverty
Unemployment
Labor Participation
Family Structure
Vehicle Availability
Education Level
Disability

Median Earnings Comparison

Immigrants from Asia

Immigrants from Germany

Exceptional
Excellent
$53,310
MEDIAN EARNINGS
100.0/ 100
METRIC RATING
32nd/ 347
METRIC RANK
$47,566
MEDIAN EARNINGS
83.1/ 100
METRIC RATING
152nd/ 347
METRIC RANK

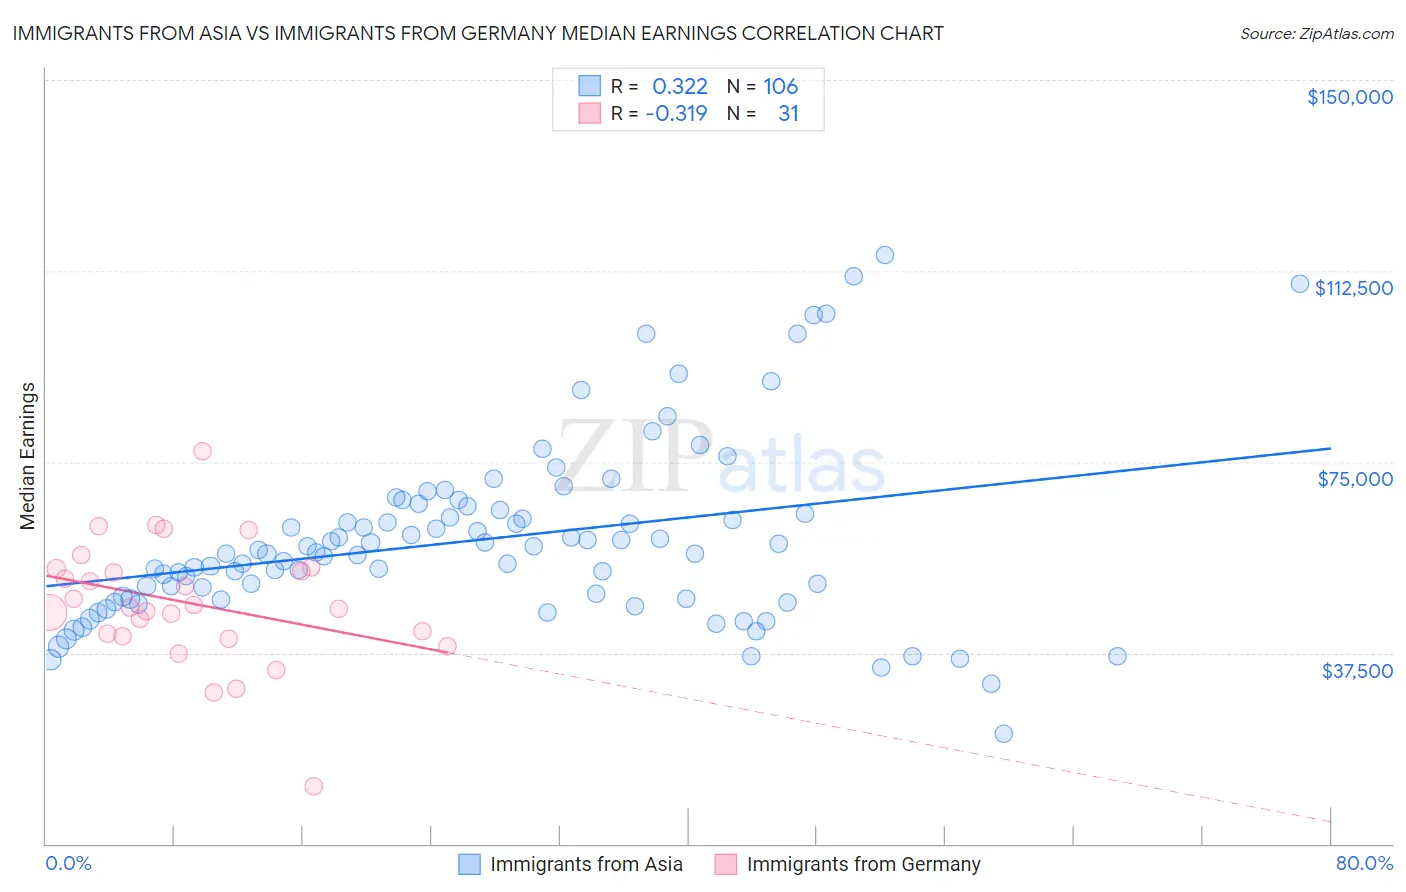
Immigrants from Asia vs Immigrants from Germany Median Earnings Correlation Chart

The statistical analysis conducted on geographies consisting of 549,053,293 people shows a mild positive correlation between the proportion of Immigrants from Asia and median earnings in the United States with a correlation coefficient (R) of 0.322 and weighted average of $53,310. Similarly, the statistical analysis conducted on geographies consisting of 463,817,606 people shows a mild negative correlation between the proportion of Immigrants from Germany and median earnings in the United States with a correlation coefficient (R) of -0.319 and weighted average of $47,566, a difference of 12.1%.
Immigrants from Asia vs Immigrants from Germany Median Earnings

Median Earnings Correlation Summary

MeasurementImmigrants from AsiaImmigrants from Germany
Minimum$21,667$11,184
Maximum$115,585$77,202
Range$93,918$66,018
Mean$59,791$47,273
Median$57,103$46,327
Interquartile 25% (IQ1)$48,160$40,729
Interquartile 75% (IQ3)$65,665$54,030
Interquartile Range (IQR)$17,505$13,301
Standard Deviation (Sample)$17,673$12,257
Standard Deviation (Population)$17,589$12,057

Similar Demographics by Median Earnings

Demographics Similar to Immigrants from Asia by Median Earnings

In terms of median earnings, the demographic groups most similar to Immigrants from Asia are Russian ($53,334, a difference of 0.040%), Immigrants from Greece ($53,282, a difference of 0.050%), Immigrants from Sri Lanka ($53,268, a difference of 0.080%), Cambodian ($53,386, a difference of 0.14%), and Immigrants from Switzerland ($53,211, a difference of 0.19%).
DemographicsRating | RankMedian Earnings
Turks
100.0
/100
|
#25
Exceptional
$53,919
Immigrants | Northern Europe
100.0
/100
|
#26
Exceptional
$53,872
Asians
100.0
/100
|
#27
Exceptional
$53,690
Immigrants | France
100.0
/100
|
#28
Exceptional
$53,490
Immigrants | Russia
100.0
/100
|
#29
Exceptional
$53,457
Cambodians
100.0
/100
|
#30
Exceptional
$53,386
Russians
100.0
/100
|
#31
Exceptional
$53,334
Immigrants | Asia
100.0
/100
|
#32
Exceptional
$53,310
Immigrants | Greece
100.0
/100
|
#33
Exceptional
$53,282
Immigrants | Sri Lanka
100.0
/100
|
#34
Exceptional
$53,268
Immigrants | Switzerland
100.0
/100
|
#35
Exceptional
$53,211
Immigrants | Denmark
100.0
/100
|
#36
Exceptional
$53,186
Immigrants | Belarus
100.0
/100
|
#37
Exceptional
$53,043
Latvians
100.0
/100
|
#38
Exceptional
$53,001
Immigrants | Turkey
100.0
/100
|
#39
Exceptional
$52,960

Demographics Similar to Immigrants from Germany by Median Earnings

In terms of median earnings, the demographic groups most similar to Immigrants from Germany are Immigrants from Oceania ($47,617, a difference of 0.11%), Peruvian ($47,628, a difference of 0.13%), Luxembourger ($47,640, a difference of 0.16%), Immigrants from Eritrea ($47,657, a difference of 0.19%), and Slavic ($47,470, a difference of 0.20%).
DemographicsRating | RankMedian Earnings
Immigrants | Saudi Arabia
85.6
/100
|
#145
Excellent
$47,704
Immigrants | Chile
85.5
/100
|
#146
Excellent
$47,697
Immigrants | South Eastern Asia
85.0
/100
|
#147
Excellent
$47,671
Immigrants | Eritrea
84.8
/100
|
#148
Excellent
$47,657
Luxembourgers
84.5
/100
|
#149
Excellent
$47,640
Peruvians
84.2
/100
|
#150
Excellent
$47,628
Immigrants | Oceania
84.1
/100
|
#151
Excellent
$47,617
Immigrants | Germany
83.1
/100
|
#152
Excellent
$47,566
Slavs
81.1
/100
|
#153
Excellent
$47,470
Immigrants | Portugal
77.3
/100
|
#154
Good
$47,304
Immigrants | Vietnam
76.7
/100
|
#155
Good
$47,282
Irish
76.6
/100
|
#156
Good
$47,276
Czechs
75.1
/100
|
#157
Good
$47,221
Slovaks
71.7
/100
|
#158
Good
$47,095
Immigrants | Peru
69.6
/100
|
#159
Good
$47,025