Immigrants from Afghanistan vs Immigrants from Bahamas Median Male Earnings
COMPARE
Immigrants from Afghanistan
Immigrants from Bahamas
Median Male Earnings
Median Male Earnings Comparison
Immigrants from Afghanistan
Immigrants from Bahamas
$57,582
MEDIAN MALE EARNINGS
95.4/ 100
METRIC RATING
112th/ 347
METRIC RANK
$45,176
MEDIAN MALE EARNINGS
0.0/ 100
METRIC RATING
327th/ 347
METRIC RANK
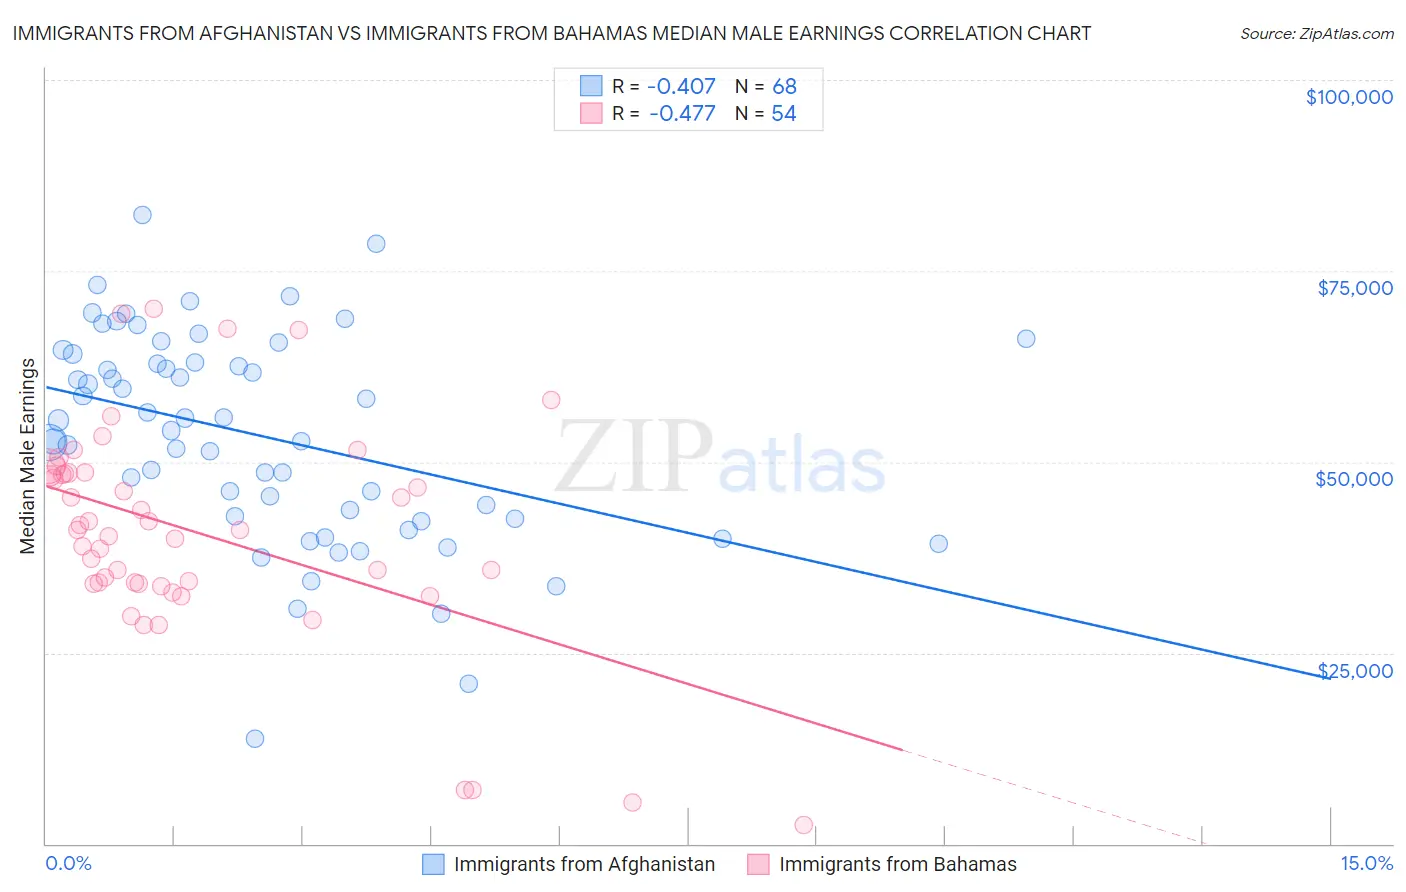
Immigrants from Afghanistan vs Immigrants from Bahamas Median Male Earnings Correlation Chart
The statistical analysis conducted on geographies consisting of 147,642,339 people shows a moderate negative correlation between the proportion of Immigrants from Afghanistan and median male earnings in the United States with a correlation coefficient (R) of -0.407 and weighted average of $57,582. Similarly, the statistical analysis conducted on geographies consisting of 104,652,587 people shows a moderate negative correlation between the proportion of Immigrants from Bahamas and median male earnings in the United States with a correlation coefficient (R) of -0.477 and weighted average of $45,176, a difference of 27.5%.
Median Male Earnings Correlation Summary
| Measurement | Immigrants from Afghanistan | Immigrants from Bahamas |
| Minimum | $13,824 | $2,499 |
| Maximum | $82,319 | $70,069 |
| Range | $68,496 | $67,570 |
| Mean | $53,392 | $40,703 |
| Median | $54,756 | $41,071 |
| Interquartile 25% (IQ1) | $42,712 | $34,087 |
| Interquartile 75% (IQ3) | $63,573 | $48,539 |
| Interquartile Range (IQR) | $20,861 | $14,452 |
| Standard Deviation (Sample) | $13,746 | $14,317 |
| Standard Deviation (Population) | $13,644 | $14,184 |
Similar Demographics by Median Male Earnings
Demographics Similar to Immigrants from Afghanistan by Median Male Earnings
In terms of median male earnings, the demographic groups most similar to Immigrants from Afghanistan are Carpatho Rusyn ($57,572, a difference of 0.020%), Immigrants from Kuwait ($57,562, a difference of 0.040%), European ($57,637, a difference of 0.090%), Swedish ($57,445, a difference of 0.24%), and Lebanese ($57,409, a difference of 0.30%).
| Demographics | Rating | Rank | Median Male Earnings |
| Immigrants | Western Asia | 97.3 /100 | #105 | Exceptional $58,131 |
| Immigrants | Northern Africa | 96.9 /100 | #106 | Exceptional $58,008 |
| Serbians | 96.8 /100 | #107 | Exceptional $57,975 |
| Immigrants | Uzbekistan | 96.7 /100 | #108 | Exceptional $57,941 |
| British | 96.5 /100 | #109 | Exceptional $57,890 |
| Palestinians | 96.2 /100 | #110 | Exceptional $57,778 |
| Europeans | 95.6 /100 | #111 | Exceptional $57,637 |
| Immigrants | Afghanistan | 95.4 /100 | #112 | Exceptional $57,582 |
| Carpatho Rusyns | 95.3 /100 | #113 | Exceptional $57,572 |
| Immigrants | Kuwait | 95.3 /100 | #114 | Exceptional $57,562 |
| Swedes | 94.8 /100 | #115 | Exceptional $57,445 |
| Lebanese | 94.6 /100 | #116 | Exceptional $57,409 |
| Immigrants | Zimbabwe | 94.3 /100 | #117 | Exceptional $57,352 |
| Hungarians | 94.0 /100 | #118 | Exceptional $57,309 |
| Arabs | 94.0 /100 | #119 | Exceptional $57,298 |
Demographics Similar to Immigrants from Bahamas by Median Male Earnings
In terms of median male earnings, the demographic groups most similar to Immigrants from Bahamas are Kiowa ($45,094, a difference of 0.18%), Immigrants from Haiti ($45,266, a difference of 0.20%), Yakama ($45,002, a difference of 0.39%), Immigrants from Mexico ($44,960, a difference of 0.48%), and Yuman ($45,446, a difference of 0.60%).
| Demographics | Rating | Rank | Median Male Earnings |
| Immigrants | Honduras | 0.0 /100 | #320 | Tragic $45,787 |
| Fijians | 0.0 /100 | #321 | Tragic $45,607 |
| Sioux | 0.0 /100 | #322 | Tragic $45,566 |
| Immigrants | Central America | 0.0 /100 | #323 | Tragic $45,538 |
| Blacks/African Americans | 0.0 /100 | #324 | Tragic $45,523 |
| Yuman | 0.0 /100 | #325 | Tragic $45,446 |
| Immigrants | Haiti | 0.0 /100 | #326 | Tragic $45,266 |
| Immigrants | Bahamas | 0.0 /100 | #327 | Tragic $45,176 |
| Kiowa | 0.0 /100 | #328 | Tragic $45,094 |
| Yakama | 0.0 /100 | #329 | Tragic $45,002 |
| Immigrants | Mexico | 0.0 /100 | #330 | Tragic $44,960 |
| Natives/Alaskans | 0.0 /100 | #331 | Tragic $44,775 |
| Bahamians | 0.0 /100 | #332 | Tragic $44,756 |
| Immigrants | Congo | 0.0 /100 | #333 | Tragic $44,204 |
| Immigrants | Yemen | 0.0 /100 | #334 | Tragic $44,083 |