Houma vs Ugandan Median Household Income

COMPARE

Houma
Race
Ancestry
AfghanAfricanAlaska NativeAlaskan AthabascanAlbanianAleutAlsatianAmericanApacheArabArapahoArgentineanArmenianAssyrian/Chaldean/SyriacAustralianAustrianBahamianBangladeshiBarbadianBasqueBelgianBelizeanBermudanBhutaneseBlackfeetBolivianBrazilianBritishBritish West IndianBulgarianBurmeseCajunCambodianCanadianCape VerdeanCarpatho RusynCelticCentral AmericanCentral American IndianCherokeeCheyenneChickasawChileanChineseChippewaChoctawColombianColvilleComancheCosta RicanCreeCreekCroatianCrowCubanCypriotCzechCzechoslovakianDanishDelawareDominicanDutchDutch West IndianEastern EuropeanEcuadorianEgyptianEnglishEstonianEthiopianEuropeanFijianFilipinoFinnishFrenchFrench American IndianFrench CanadianGermanGerman RussianGhanaianGreekGuamanian/ChamorroGuatemalanGuyaneseHaitianHmongHonduranHopiHoumaHungarianIcelanderIndian (Asian)IndonesianInupiatIranianIraqiIrishIroquoisIsraeliItalianJamaicanJapaneseJordanianKenyanKiowaKoreanLaotianLatvianLebaneseLiberianLithuanianLumbeeLuxembourgerMacedonianMalaysianMalteseMarshalleseMenomineeMexicanMexican American IndianMongolianMoroccanNative HawaiianNavajoNepaleseNew ZealanderNicaraguanNigerianNorthern EuropeanNorwegianOkinawanOsageOttawaPaiutePakistaniPalestinianPanamanianParaguayanPennsylvania GermanPeruvianPimaPolishPortuguesePotawatomiPuebloPuerto RicanPuget Sound SalishRomanianRussianSalvadoranSamoanScandinavianScotch-IrishScottishSeminoleSenegaleseSerbianShoshoneSierra LeoneanSiouxSlavicSlovakSloveneSomaliSouth AfricanSouth AmericanSouth American IndianSoviet UnionSpaniardSpanishSpanish AmericanSpanish American IndianSri LankanSubsaharan AfricanSudaneseSwedishSwissSyrianTaiwaneseThaiTlingit-HaidaTohono O'OdhamTonganTrinidadian and TobagonianTsimshianTurkishU.S. Virgin IslanderUkrainianUruguayanUteVenezuelanVietnameseWelshWest IndianYakamaYaquiYugoslavianYumanYup'ikZimbabwean
Immigration
NonimmigrantsImmigrantsAfghanistanAfricaAlbaniaArgentinaArmeniaAsiaAustraliaAustriaBahamasBangladeshBarbadosBelarusBelgiumBelizeBoliviaBosnia and HerzegovinaBrazilBulgariaBurma/MyanmarCabo VerdeCambodiaCameroonCanadaCaribbeanCentral AmericaChileChinaColombiaCongoCosta RicaCroatiaCubaCzechoslovakiaDenmarkDominicaDominican RepublicEastern AfricaEastern AsiaEastern EuropeEcuadorEgyptEl SalvadorEnglandEritreaEthiopiaEuropeFijiFranceGermanyGhanaGreeceGrenadaGuatemalaGuyanaHaitiHondurasHong KongHungaryIndiaIndonesiaIranIraqIrelandIsraelItalyJamaicaJapanJordanKazakhstanKenyaKoreaKuwaitLaosLatin AmericaLatviaLebanonLiberiaLithuaniaMalaysiaMexicoMicronesiaMiddle AfricaMoldovaMoroccoNepalNetherlandsNicaraguaNigeriaNorth AmericaNorth MacedoniaNorthern AfricaNorthern EuropeNorwayOceaniaPakistanPanamaPeruPhilippinesPolandPortugalRomaniaRussiaSaudi ArabiaScotlandSenegalSerbiaSierra LeoneSingaporeSomaliaSouth AfricaSouth AmericaSouth Central AsiaSouth Eastern AsiaSouthern EuropeSpainSri LankaSt. Vincent and the GrenadinesSudanSwedenSwitzerlandSyriaTaiwanThailandTrinidad and TobagoTurkeyUgandaUkraineUruguayUzbekistanVenezuelaVietnamWest IndiesWestern AfricaWestern AsiaWestern EuropeYemenZaireZimbabweAzores
Ugandan
Race
Ancestry
AfghanAfricanAlaska NativeAlaskan AthabascanAlbanianAleutAlsatianAmericanApacheArabArapahoArgentineanArmenianAssyrian/Chaldean/SyriacAustralianAustrianBahamianBangladeshiBarbadianBasqueBelgianBelizeanBermudanBhutaneseBlackfeetBolivianBrazilianBritishBritish West IndianBulgarianBurmeseCajunCambodianCanadianCape VerdeanCarpatho RusynCelticCentral AmericanCentral American IndianCherokeeCheyenneChickasawChileanChineseChippewaChoctawColombianColvilleComancheCosta RicanCreeCreekCroatianCrowCubanCypriotCzechCzechoslovakianDanishDelawareDominicanDutchDutch West IndianEastern EuropeanEcuadorianEgyptianEnglishEstonianEthiopianEuropeanFijianFilipinoFinnishFrenchFrench American IndianFrench CanadianGermanGerman RussianGhanaianGreekGuamanian/ChamorroGuatemalanGuyaneseHaitianHmongHonduranHopiHungarianIcelanderIndian (Asian)IndonesianInupiatIranianIraqiIrishIroquoisIsraeliItalianJamaicanJapaneseJordanianKenyanKiowaKoreanLaotianLatvianLebaneseLiberianLithuanianLumbeeLuxembourgerMacedonianMalaysianMalteseMarshalleseMenomineeMexicanMexican American IndianMongolianMoroccanNative HawaiianNavajoNepaleseNew ZealanderNicaraguanNigerianNorthern EuropeanNorwegianOkinawanOsageOttawaPaiutePakistaniPalestinianPanamanianParaguayanPennsylvania GermanPeruvianPimaPolishPortuguesePotawatomiPuebloPuerto RicanPuget Sound SalishRomanianRussianSalvadoranSamoanScandinavianScotch-IrishScottishSeminoleSenegaleseSerbianShoshoneSierra LeoneanSiouxSlavicSlovakSloveneSomaliSouth AfricanSouth AmericanSouth American IndianSoviet UnionSpaniardSpanishSpanish AmericanSpanish American IndianSri LankanSubsaharan AfricanSudaneseSwedishSwissSyrianTaiwaneseThaiTlingit-HaidaTohono O'OdhamTonganTrinidadian and TobagonianTsimshianTurkishU.S. Virgin IslanderUgandanUkrainianUruguayanUteVenezuelanVietnameseWelshWest IndianYakamaYaquiYugoslavianYumanYup'ikZimbabwean
Immigration
NonimmigrantsImmigrantsAfghanistanAfricaAlbaniaArgentinaArmeniaAsiaAustraliaAustriaBahamasBangladeshBarbadosBelarusBelgiumBelizeBoliviaBosnia and HerzegovinaBrazilBulgariaBurma/MyanmarCabo VerdeCambodiaCameroonCanadaCaribbeanCentral AmericaChileChinaColombiaCongoCosta RicaCroatiaCubaCzechoslovakiaDenmarkDominicaDominican RepublicEastern AfricaEastern AsiaEastern EuropeEcuadorEgyptEl SalvadorEnglandEritreaEthiopiaEuropeFijiFranceGermanyGhanaGreeceGrenadaGuatemalaGuyanaHaitiHondurasHong KongHungaryIndiaIndonesiaIranIraqIrelandIsraelItalyJamaicaJapanJordanKazakhstanKenyaKoreaKuwaitLaosLatin AmericaLatviaLebanonLiberiaLithuaniaMalaysiaMexicoMicronesiaMiddle AfricaMoldovaMoroccoNepalNetherlandsNicaraguaNigeriaNorth AmericaNorth MacedoniaNorthern AfricaNorthern EuropeNorwayOceaniaPakistanPanamaPeruPhilippinesPolandPortugalRomaniaRussiaSaudi ArabiaScotlandSenegalSerbiaSierra LeoneSingaporeSomaliaSouth AfricaSouth AmericaSouth Central AsiaSouth Eastern AsiaSouthern EuropeSpainSri LankaSt. Vincent and the GrenadinesSudanSwedenSwitzerlandSyriaTaiwanThailandTrinidad and TobagoTurkeyUgandaUkraineUruguayUzbekistanVenezuelaVietnamWest IndiesWestern AfricaWestern AsiaWestern EuropeYemenZaireZimbabweAzores
Median Household Income
Income
Poverty
Unemployment
Labor Participation
Family Structure
Vehicle Availability
Education Level
Disability

Median Household Income Comparison

Houma

Ugandans

Tragic
Excellent
$62,575
MEDIAN HOUSEHOLD INCOME
0.0/ 100
METRIC RATING
343rd/ 347
METRIC RANK
$87,557
MEDIAN HOUSEHOLD INCOME
82.9/ 100
METRIC RATING
145th/ 347
METRIC RANK

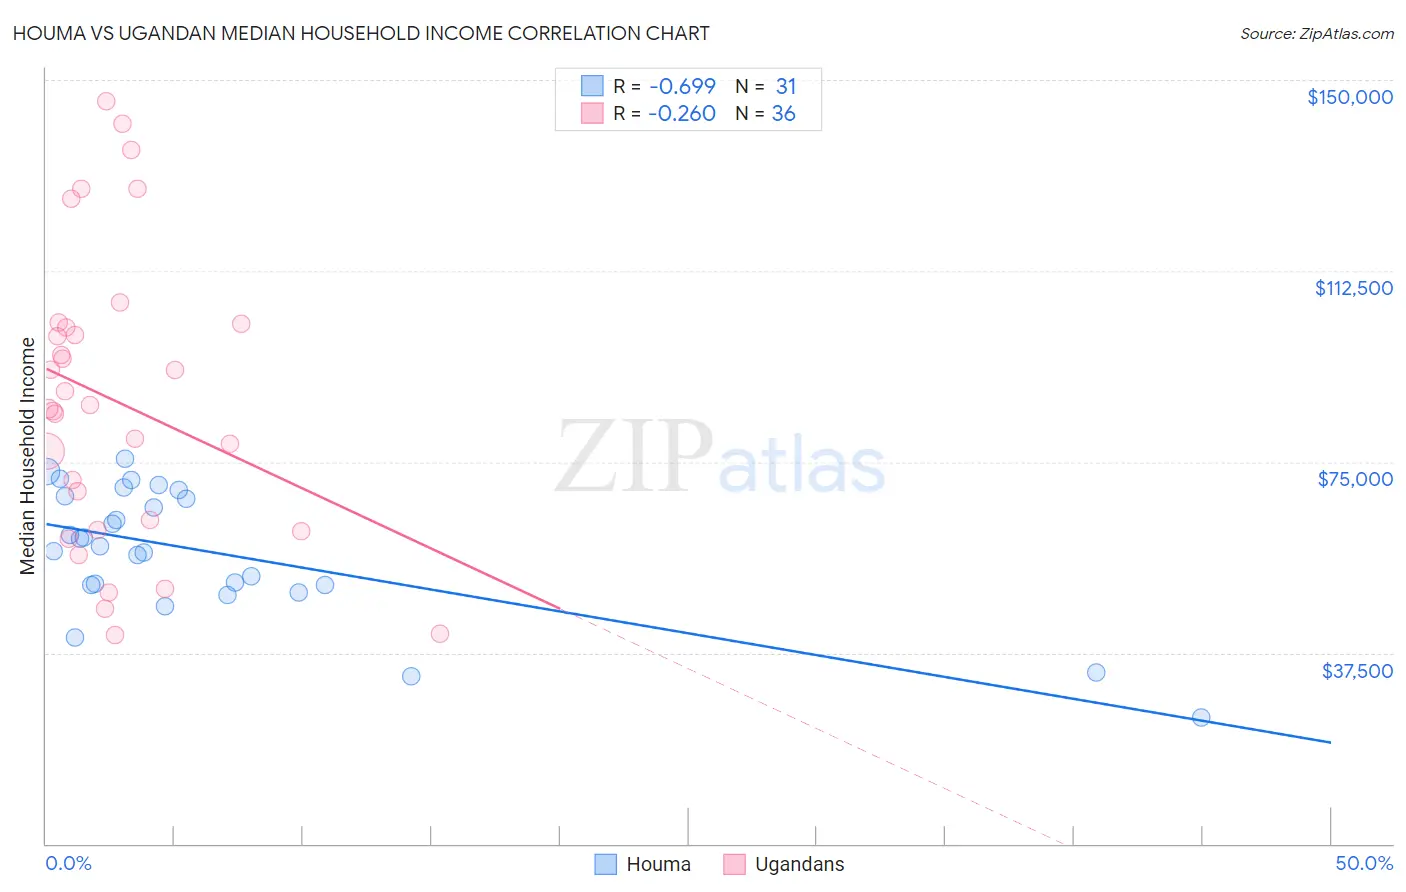
Houma vs Ugandan Median Household Income Correlation Chart

The statistical analysis conducted on geographies consisting of 36,792,126 people shows a significant negative correlation between the proportion of Houma and median household income in the United States with a correlation coefficient (R) of -0.699 and weighted average of $62,575. Similarly, the statistical analysis conducted on geographies consisting of 93,988,402 people shows a weak negative correlation between the proportion of Ugandans and median household income in the United States with a correlation coefficient (R) of -0.260 and weighted average of $87,557, a difference of 39.9%.
Houma vs Ugandan Median Household Income

Median Household Income Correlation Summary

MeasurementHoumaUgandan
Minimum$24,706$40,977
Maximum$75,521$145,769
Range$50,815$104,792
Mean$57,222$87,043
Median$58,380$85,898
Interquartile 25% (IQ1)$50,766$62,590
Interquartile 75% (IQ3)$68,165$101,783
Interquartile Range (IQR)$17,398$39,193
Standard Deviation (Sample)$12,629$28,515
Standard Deviation (Population)$12,424$28,116

Similar Demographics by Median Household Income

Demographics Similar to Houma by Median Household Income

In terms of median household income, the demographic groups most similar to Houma are Pima ($63,262, a difference of 1.1%), Tohono O'odham ($61,663, a difference of 1.5%), Crow ($63,681, a difference of 1.8%), Pueblo ($64,692, a difference of 3.4%), and Hopi ($65,043, a difference of 3.9%).
DemographicsRating | RankMedian Household Income
Creek
0.0
/100
|
#333
Tragic
$67,715
Blacks/African Americans
0.0
/100
|
#334
Tragic
$67,573
Cheyenne
0.0
/100
|
#335
Tragic
$66,974
Immigrants | Congo
0.0
/100
|
#336
Tragic
$66,768
Kiowa
0.0
/100
|
#337
Tragic
$65,914
Immigrants | Yemen
0.0
/100
|
#338
Tragic
$65,194
Hopi
0.0
/100
|
#339
Tragic
$65,043
Pueblo
0.0
/100
|
#340
Tragic
$64,692
Crow
0.0
/100
|
#341
Tragic
$63,681
Pima
0.0
/100
|
#342
Tragic
$63,262
Houma
0.0
/100
|
#343
Tragic
$62,575
Tohono O'odham
0.0
/100
|
#344
Tragic
$61,663
Puerto Ricans
0.0
/100
|
#345
Tragic
$59,197
Navajo
0.0
/100
|
#346
Tragic
$59,159
Lumbee
0.0
/100
|
#347
Tragic
$54,644

Demographics Similar to Ugandans by Median Household Income

In terms of median household income, the demographic groups most similar to Ugandans are Immigrants from Uganda ($87,553, a difference of 0.0%), Serbian ($87,572, a difference of 0.020%), South American Indian ($87,446, a difference of 0.13%), Danish ($87,676, a difference of 0.14%), and Canadian ($87,769, a difference of 0.24%).
DemographicsRating | RankMedian Household Income
Arabs
89.2
/100
|
#138
Excellent
$88,398
Immigrants | Chile
89.2
/100
|
#139
Excellent
$88,388
Lebanese
87.2
/100
|
#140
Excellent
$88,091
Immigrants | Morocco
86.0
/100
|
#141
Excellent
$87,930
Canadians
84.7
/100
|
#142
Excellent
$87,769
Danes
83.9
/100
|
#143
Excellent
$87,676
Serbians
83.0
/100
|
#144
Excellent
$87,572
Ugandans
82.9
/100
|
#145
Excellent
$87,557
Immigrants | Uganda
82.8
/100
|
#146
Excellent
$87,553
South American Indians
81.8
/100
|
#147
Excellent
$87,446
Costa Ricans
80.0
/100
|
#148
Excellent
$87,262
Immigrants | Nepal
77.7
/100
|
#149
Good
$87,046
Basques
77.2
/100
|
#150
Good
$87,001
Hungarians
76.3
/100
|
#151
Good
$86,920
Immigrants | Saudi Arabia
75.8
/100
|
#152
Good
$86,875