Guatemalan vs Immigrants from Italy Median Male Earnings
COMPARE
Guatemalan
Immigrants from Italy
Median Male Earnings
Median Male Earnings Comparison
Guatemalans
Immigrants from Italy
$46,736
MEDIAN MALE EARNINGS
0.0/ 100
METRIC RATING
305th/ 347
METRIC RANK
$59,691
MEDIAN MALE EARNINGS
99.4/ 100
METRIC RATING
83rd/ 347
METRIC RANK
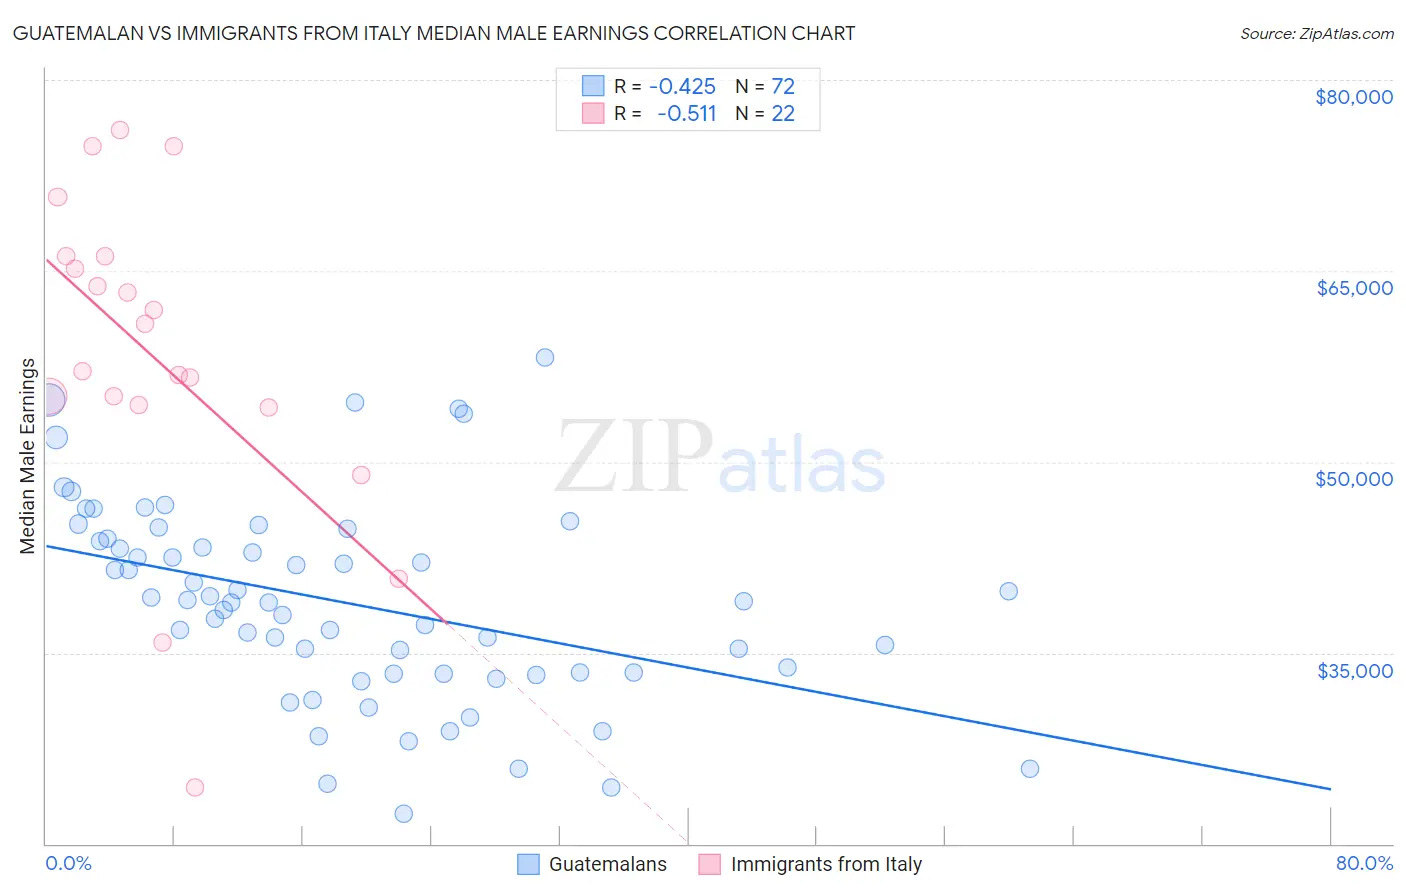
Guatemalan vs Immigrants from Italy Median Male Earnings Correlation Chart
The statistical analysis conducted on geographies consisting of 409,446,207 people shows a moderate negative correlation between the proportion of Guatemalans and median male earnings in the United States with a correlation coefficient (R) of -0.425 and weighted average of $46,736. Similarly, the statistical analysis conducted on geographies consisting of 324,142,544 people shows a substantial negative correlation between the proportion of Immigrants from Italy and median male earnings in the United States with a correlation coefficient (R) of -0.511 and weighted average of $59,691, a difference of 27.7%.
Median Male Earnings Correlation Summary
| Measurement | Guatemalan | Immigrants from Italy |
| Minimum | $22,332 | $24,375 |
| Maximum | $58,162 | $76,045 |
| Range | $35,830 | $51,670 |
| Mean | $38,925 | $58,332 |
| Median | $39,033 | $58,952 |
| Interquartile 25% (IQ1) | $33,424 | $54,435 |
| Interquartile 75% (IQ3) | $43,885 | $66,141 |
| Interquartile Range (IQR) | $10,461 | $11,706 |
| Standard Deviation (Sample) | $7,785 | $12,664 |
| Standard Deviation (Population) | $7,731 | $12,373 |
Similar Demographics by Median Male Earnings
Demographics Similar to Guatemalans by Median Male Earnings
In terms of median male earnings, the demographic groups most similar to Guatemalans are Bangladeshi ($46,744, a difference of 0.020%), Yaqui ($46,777, a difference of 0.090%), Seminole ($46,783, a difference of 0.10%), Dutch West Indian ($46,656, a difference of 0.17%), and Immigrants from Dominican Republic ($46,655, a difference of 0.17%).
| Demographics | Rating | Rank | Median Male Earnings |
| Immigrants | Micronesia | 0.1 /100 | #298 | Tragic $47,177 |
| Immigrants | Zaire | 0.1 /100 | #299 | Tragic $47,070 |
| U.S. Virgin Islanders | 0.1 /100 | #300 | Tragic $47,066 |
| Immigrants | Latin America | 0.1 /100 | #301 | Tragic $46,941 |
| Seminole | 0.1 /100 | #302 | Tragic $46,783 |
| Yaqui | 0.1 /100 | #303 | Tragic $46,777 |
| Bangladeshis | 0.1 /100 | #304 | Tragic $46,744 |
| Guatemalans | 0.0 /100 | #305 | Tragic $46,736 |
| Dutch West Indians | 0.0 /100 | #306 | Tragic $46,656 |
| Immigrants | Dominican Republic | 0.0 /100 | #307 | Tragic $46,655 |
| Ottawa | 0.0 /100 | #308 | Tragic $46,611 |
| Creek | 0.0 /100 | #309 | Tragic $46,594 |
| Cubans | 0.0 /100 | #310 | Tragic $46,580 |
| Apache | 0.0 /100 | #311 | Tragic $46,429 |
| Hispanics or Latinos | 0.0 /100 | #312 | Tragic $46,419 |
Demographics Similar to Immigrants from Italy by Median Male Earnings
In terms of median male earnings, the demographic groups most similar to Immigrants from Italy are Croatian ($59,715, a difference of 0.040%), Ukrainian ($59,728, a difference of 0.060%), Immigrants from Hungary ($59,806, a difference of 0.19%), Immigrants from Ukraine ($59,820, a difference of 0.22%), and Afghan ($59,554, a difference of 0.23%).
| Demographics | Rating | Rank | Median Male Earnings |
| Romanians | 99.6 /100 | #76 | Exceptional $60,063 |
| Paraguayans | 99.5 /100 | #77 | Exceptional $59,975 |
| Immigrants | Egypt | 99.5 /100 | #78 | Exceptional $59,925 |
| Immigrants | Ukraine | 99.5 /100 | #79 | Exceptional $59,820 |
| Immigrants | Hungary | 99.5 /100 | #80 | Exceptional $59,806 |
| Ukrainians | 99.4 /100 | #81 | Exceptional $59,728 |
| Croatians | 99.4 /100 | #82 | Exceptional $59,715 |
| Immigrants | Italy | 99.4 /100 | #83 | Exceptional $59,691 |
| Afghans | 99.3 /100 | #84 | Exceptional $59,554 |
| Italians | 99.3 /100 | #85 | Exceptional $59,551 |
| Immigrants | England | 99.3 /100 | #86 | Exceptional $59,527 |
| Macedonians | 99.3 /100 | #87 | Exceptional $59,522 |
| Immigrants | Argentina | 99.3 /100 | #88 | Exceptional $59,491 |
| Immigrants | Moldova | 99.2 /100 | #89 | Exceptional $59,417 |
| Austrians | 99.2 /100 | #90 | Exceptional $59,359 |