Arapaho vs Immigrants from Italy Median Male Earnings
COMPARE
Arapaho
Immigrants from Italy
Median Male Earnings
Median Male Earnings Comparison
Arapaho
Immigrants from Italy
$41,758
MEDIAN MALE EARNINGS
0.0/ 100
METRIC RATING
342nd/ 347
METRIC RANK
$59,691
MEDIAN MALE EARNINGS
99.4/ 100
METRIC RATING
83rd/ 347
METRIC RANK
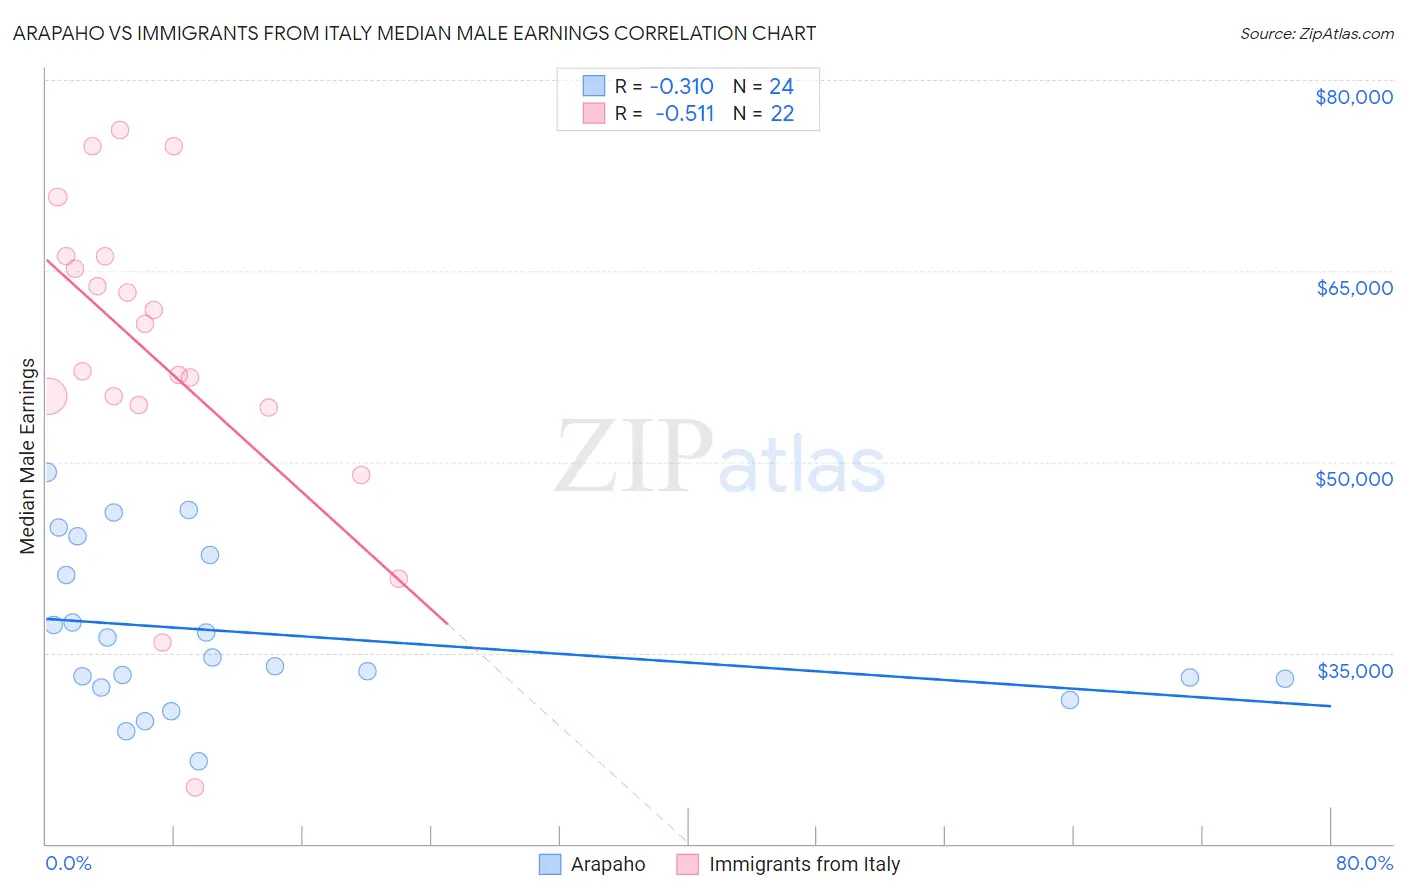
Arapaho vs Immigrants from Italy Median Male Earnings Correlation Chart
The statistical analysis conducted on geographies consisting of 29,771,934 people shows a mild negative correlation between the proportion of Arapaho and median male earnings in the United States with a correlation coefficient (R) of -0.310 and weighted average of $41,758. Similarly, the statistical analysis conducted on geographies consisting of 324,142,544 people shows a substantial negative correlation between the proportion of Immigrants from Italy and median male earnings in the United States with a correlation coefficient (R) of -0.511 and weighted average of $59,691, a difference of 42.9%.
Median Male Earnings Correlation Summary
| Measurement | Arapaho | Immigrants from Italy |
| Minimum | $26,527 | $24,375 |
| Maximum | $49,176 | $76,045 |
| Range | $22,649 | $51,670 |
| Mean | $36,456 | $58,332 |
| Median | $34,270 | $58,952 |
| Interquartile 25% (IQ1) | $32,621 | $54,435 |
| Interquartile 75% (IQ3) | $41,897 | $66,141 |
| Interquartile Range (IQR) | $9,276 | $11,706 |
| Standard Deviation (Sample) | $6,211 | $12,664 |
| Standard Deviation (Population) | $6,080 | $12,373 |
Similar Demographics by Median Male Earnings
Demographics Similar to Arapaho by Median Male Earnings
In terms of median male earnings, the demographic groups most similar to Arapaho are Lumbee ($41,715, a difference of 0.10%), Hopi ($42,060, a difference of 0.72%), Navajo ($42,098, a difference of 0.81%), Pueblo ($41,314, a difference of 1.1%), and Pima ($42,357, a difference of 1.4%).
| Demographics | Rating | Rank | Median Male Earnings |
| Immigrants | Congo | 0.0 /100 | #333 | Tragic $44,204 |
| Immigrants | Yemen | 0.0 /100 | #334 | Tragic $44,083 |
| Spanish American Indians | 0.0 /100 | #335 | Tragic $44,010 |
| Immigrants | Cuba | 0.0 /100 | #336 | Tragic $43,461 |
| Menominee | 0.0 /100 | #337 | Tragic $42,581 |
| Crow | 0.0 /100 | #338 | Tragic $42,434 |
| Pima | 0.0 /100 | #339 | Tragic $42,357 |
| Navajo | 0.0 /100 | #340 | Tragic $42,098 |
| Hopi | 0.0 /100 | #341 | Tragic $42,060 |
| Arapaho | 0.0 /100 | #342 | Tragic $41,758 |
| Lumbee | 0.0 /100 | #343 | Tragic $41,715 |
| Pueblo | 0.0 /100 | #344 | Tragic $41,314 |
| Puerto Ricans | 0.0 /100 | #345 | Tragic $40,071 |
| Tohono O'odham | 0.0 /100 | #346 | Tragic $39,543 |
| Yup'ik | 0.0 /100 | #347 | Tragic $39,504 |
Demographics Similar to Immigrants from Italy by Median Male Earnings
In terms of median male earnings, the demographic groups most similar to Immigrants from Italy are Croatian ($59,715, a difference of 0.040%), Ukrainian ($59,728, a difference of 0.060%), Immigrants from Hungary ($59,806, a difference of 0.19%), Immigrants from Ukraine ($59,820, a difference of 0.22%), and Afghan ($59,554, a difference of 0.23%).
| Demographics | Rating | Rank | Median Male Earnings |
| Romanians | 99.6 /100 | #76 | Exceptional $60,063 |
| Paraguayans | 99.5 /100 | #77 | Exceptional $59,975 |
| Immigrants | Egypt | 99.5 /100 | #78 | Exceptional $59,925 |
| Immigrants | Ukraine | 99.5 /100 | #79 | Exceptional $59,820 |
| Immigrants | Hungary | 99.5 /100 | #80 | Exceptional $59,806 |
| Ukrainians | 99.4 /100 | #81 | Exceptional $59,728 |
| Croatians | 99.4 /100 | #82 | Exceptional $59,715 |
| Immigrants | Italy | 99.4 /100 | #83 | Exceptional $59,691 |
| Afghans | 99.3 /100 | #84 | Exceptional $59,554 |
| Italians | 99.3 /100 | #85 | Exceptional $59,551 |
| Immigrants | England | 99.3 /100 | #86 | Exceptional $59,527 |
| Macedonians | 99.3 /100 | #87 | Exceptional $59,522 |
| Immigrants | Argentina | 99.3 /100 | #88 | Exceptional $59,491 |
| Immigrants | Moldova | 99.2 /100 | #89 | Exceptional $59,417 |
| Austrians | 99.2 /100 | #90 | Exceptional $59,359 |