Fijian vs Immigrants from Jamaica Median Female Earnings
COMPARE
Fijian
Immigrants from Jamaica
Median Female Earnings
Median Female Earnings Comparison
Fijians
Immigrants from Jamaica
$35,114
MEDIAN FEMALE EARNINGS
0.0/ 100
METRIC RATING
306th/ 347
METRIC RANK
$38,625
MEDIAN FEMALE EARNINGS
9.7/ 100
METRIC RATING
217th/ 347
METRIC RANK
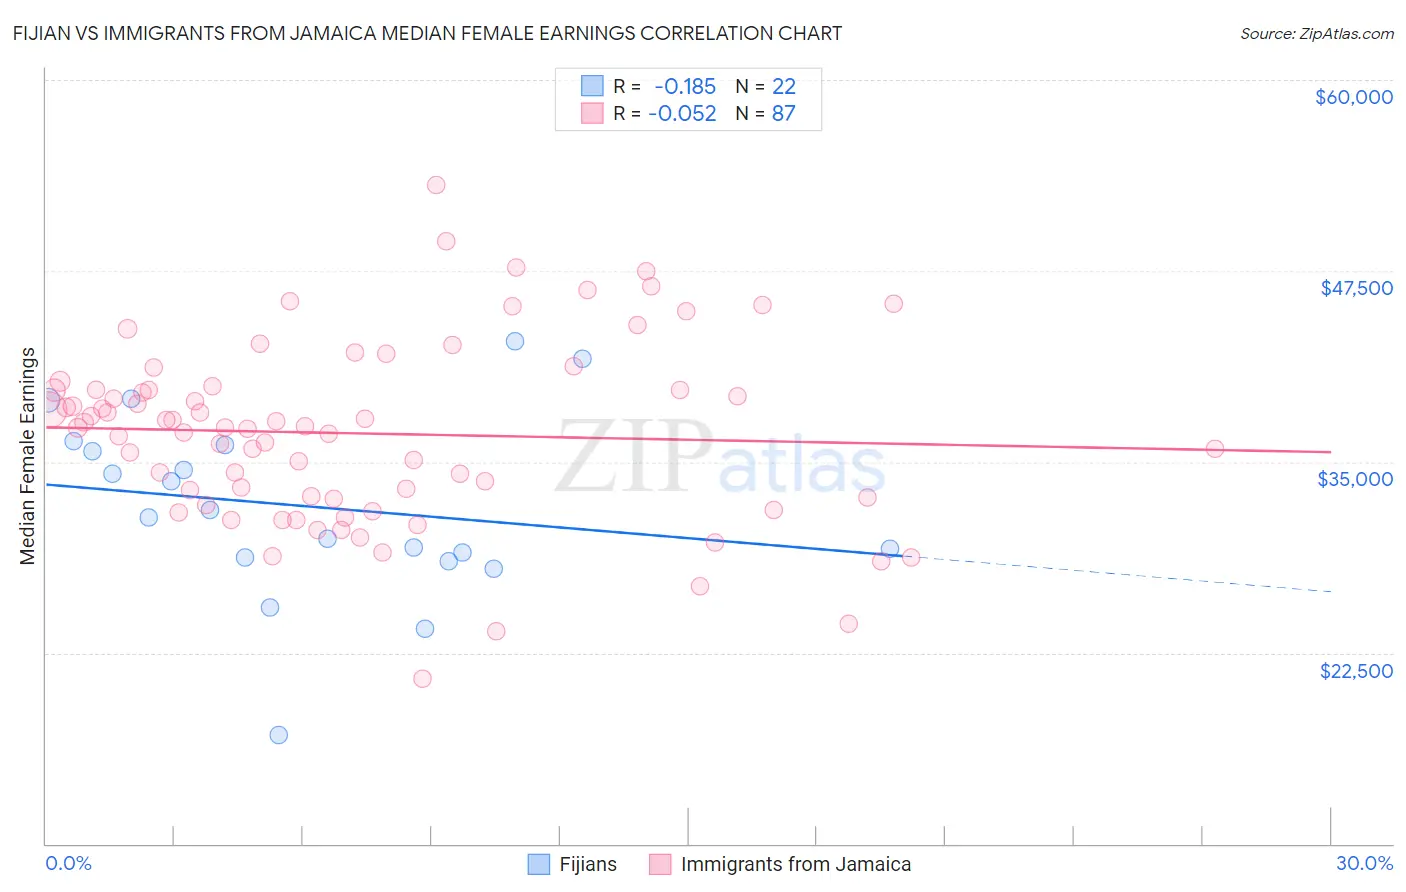
Fijian vs Immigrants from Jamaica Median Female Earnings Correlation Chart
The statistical analysis conducted on geographies consisting of 55,944,407 people shows a poor negative correlation between the proportion of Fijians and median female earnings in the United States with a correlation coefficient (R) of -0.185 and weighted average of $35,114. Similarly, the statistical analysis conducted on geographies consisting of 301,720,032 people shows a slight negative correlation between the proportion of Immigrants from Jamaica and median female earnings in the United States with a correlation coefficient (R) of -0.052 and weighted average of $38,625, a difference of 10.0%.
Median Female Earnings Correlation Summary
| Measurement | Fijian | Immigrants from Jamaica |
| Minimum | $17,125 | $20,815 |
| Maximum | $42,895 | $53,086 |
| Range | $25,770 | $32,271 |
| Mean | $32,097 | $36,867 |
| Median | $31,625 | $37,264 |
| Interquartile 25% (IQ1) | $28,766 | $32,574 |
| Interquartile 75% (IQ3) | $36,076 | $39,745 |
| Interquartile Range (IQR) | $7,310 | $7,171 |
| Standard Deviation (Sample) | $6,055 | $5,965 |
| Standard Deviation (Population) | $5,916 | $5,931 |
Similar Demographics by Median Female Earnings
Demographics Similar to Fijians by Median Female Earnings
In terms of median female earnings, the demographic groups most similar to Fijians are Bahamian ($35,125, a difference of 0.030%), Sioux ($35,063, a difference of 0.15%), Immigrants from Bahamas ($35,027, a difference of 0.25%), Honduran ($35,013, a difference of 0.29%), and Chippewa ($35,003, a difference of 0.32%).
| Demographics | Rating | Rank | Median Female Earnings |
| Immigrants | Guatemala | 0.0 /100 | #299 | Tragic $35,444 |
| Yuman | 0.0 /100 | #300 | Tragic $35,377 |
| Pima | 0.0 /100 | #301 | Tragic $35,326 |
| Blacks/African Americans | 0.0 /100 | #302 | Tragic $35,315 |
| Immigrants | Latin America | 0.0 /100 | #303 | Tragic $35,307 |
| Crow | 0.0 /100 | #304 | Tragic $35,266 |
| Bahamians | 0.0 /100 | #305 | Tragic $35,125 |
| Fijians | 0.0 /100 | #306 | Tragic $35,114 |
| Sioux | 0.0 /100 | #307 | Tragic $35,063 |
| Immigrants | Bahamas | 0.0 /100 | #308 | Tragic $35,027 |
| Hondurans | 0.0 /100 | #309 | Tragic $35,013 |
| Chippewa | 0.0 /100 | #310 | Tragic $35,003 |
| Ute | 0.0 /100 | #311 | Tragic $34,960 |
| Yaqui | 0.0 /100 | #312 | Tragic $34,943 |
| Cubans | 0.0 /100 | #313 | Tragic $34,942 |
Demographics Similar to Immigrants from Jamaica by Median Female Earnings
In terms of median female earnings, the demographic groups most similar to Immigrants from Jamaica are Cape Verdean ($38,614, a difference of 0.030%), Immigrants from Ecuador ($38,644, a difference of 0.050%), Nepalese ($38,603, a difference of 0.060%), Spaniard ($38,656, a difference of 0.080%), and Iraqi ($38,666, a difference of 0.11%).
| Demographics | Rating | Rank | Median Female Earnings |
| Czechoslovakians | 12.0 /100 | #210 | Poor $38,738 |
| Aleuts | 11.6 /100 | #211 | Poor $38,719 |
| Guamanians/Chamorros | 11.5 /100 | #212 | Poor $38,717 |
| Jamaicans | 10.5 /100 | #213 | Poor $38,670 |
| Iraqis | 10.5 /100 | #214 | Poor $38,666 |
| Spaniards | 10.3 /100 | #215 | Poor $38,656 |
| Immigrants | Ecuador | 10.1 /100 | #216 | Poor $38,644 |
| Immigrants | Jamaica | 9.7 /100 | #217 | Tragic $38,625 |
| Cape Verdeans | 9.5 /100 | #218 | Tragic $38,614 |
| Nepalese | 9.3 /100 | #219 | Tragic $38,603 |
| Yugoslavians | 8.8 /100 | #220 | Tragic $38,573 |
| Immigrants | Azores | 8.8 /100 | #221 | Tragic $38,573 |
| Japanese | 8.1 /100 | #222 | Tragic $38,528 |
| Immigrants | Sudan | 7.8 /100 | #223 | Tragic $38,511 |
| Native Hawaiians | 7.1 /100 | #224 | Tragic $38,461 |