Fijian vs Immigrants from Ireland Householder Income Under 25 years

COMPARE

Fijian
Race
Ancestry
AfghanAfricanAlaska NativeAlaskan AthabascanAlbanianAleutAlsatianAmericanApacheArabArapahoArgentineanArmenianAssyrian/Chaldean/SyriacAustralianAustrianBahamianBangladeshiBarbadianBasqueBelgianBelizeanBermudanBhutaneseBlackfeetBolivianBrazilianBritishBritish West IndianBulgarianBurmeseCajunCambodianCanadianCape VerdeanCarpatho RusynCelticCentral AmericanCentral American IndianCherokeeCheyenneChickasawChileanChineseChippewaChoctawColombianColvilleComancheCosta RicanCreeCreekCroatianCrowCubanCypriotCzechCzechoslovakianDanishDelawareDominicanDutchDutch West IndianEastern EuropeanEcuadorianEgyptianEnglishEstonianEthiopianEuropeanFijianFilipinoFinnishFrenchFrench American IndianFrench CanadianGermanGerman RussianGhanaianGreekGuamanian/ChamorroGuatemalanGuyaneseHaitianHmongHonduranHopiHoumaHungarianIcelanderIndian (Asian)IndonesianInupiatIranianIraqiIrishIroquoisIsraeliItalianJamaicanJapaneseJordanianKenyanKiowaKoreanLaotianLatvianLebaneseLiberianLithuanianLumbeeLuxembourgerMacedonianMalaysianMalteseMarshalleseMenomineeMexicanMexican American IndianMongolianMoroccanNative HawaiianNavajoNepaleseNew ZealanderNicaraguanNigerianNorthern EuropeanNorwegianOkinawanOsageOttawaPaiutePakistaniPalestinianPanamanianParaguayanPennsylvania GermanPeruvianPimaPolishPortuguesePotawatomiPuebloPuerto RicanPuget Sound SalishRomanianRussianSalvadoranSamoanScandinavianScotch-IrishScottishSeminoleSenegaleseSerbianShoshoneSierra LeoneanSiouxSlavicSlovakSloveneSomaliSouth AfricanSouth AmericanSouth American IndianSoviet UnionSpaniardSpanishSpanish AmericanSpanish American IndianSri LankanSubsaharan AfricanSudaneseSwedishSwissSyrianTaiwaneseThaiTlingit-HaidaTohono O'OdhamTonganTrinidadian and TobagonianTsimshianTurkishU.S. Virgin IslanderUgandanUkrainianUruguayanUteVenezuelanVietnameseWelshWest IndianYakamaYaquiYugoslavianYumanYup'ikZimbabwean
Immigration
NonimmigrantsImmigrantsAfghanistanAfricaAlbaniaArgentinaArmeniaAsiaAustraliaAustriaBahamasBangladeshBarbadosBelarusBelgiumBelizeBoliviaBosnia and HerzegovinaBrazilBulgariaBurma/MyanmarCabo VerdeCambodiaCameroonCanadaCaribbeanCentral AmericaChileChinaColombiaCongoCosta RicaCroatiaCubaCzechoslovakiaDenmarkDominicaDominican RepublicEastern AfricaEastern AsiaEastern EuropeEcuadorEgyptEl SalvadorEnglandEritreaEthiopiaEuropeFijiFranceGermanyGhanaGreeceGrenadaGuatemalaGuyanaHaitiHondurasHong KongHungaryIndiaIndonesiaIranIraqIsraelItalyJamaicaJapanJordanKazakhstanKenyaKoreaKuwaitLaosLatin AmericaLatviaLebanonLiberiaLithuaniaMalaysiaMexicoMicronesiaMiddle AfricaMoldovaMoroccoNepalNetherlandsNicaraguaNigeriaNorth AmericaNorth MacedoniaNorthern AfricaNorthern EuropeNorwayOceaniaPakistanPanamaPeruPhilippinesPolandPortugalRomaniaRussiaSaudi ArabiaScotlandSenegalSerbiaSierra LeoneSingaporeSomaliaSouth AfricaSouth AmericaSouth Central AsiaSouth Eastern AsiaSouthern EuropeSpainSri LankaSt. Vincent and the GrenadinesSudanSwedenSwitzerlandSyriaTaiwanThailandTrinidad and TobagoTurkeyUgandaUkraineUruguayUzbekistanVenezuelaVietnamWest IndiesWestern AfricaWestern AsiaWestern EuropeYemenZaireZimbabweAzores
Immigrants from Ireland
Race
Ancestry
AfghanAfricanAlaska NativeAlaskan AthabascanAlbanianAleutAlsatianAmericanApacheArabArapahoArgentineanArmenianAssyrian/Chaldean/SyriacAustralianAustrianBahamianBangladeshiBarbadianBasqueBelgianBelizeanBermudanBhutaneseBlackfeetBolivianBrazilianBritishBritish West IndianBulgarianBurmeseCajunCambodianCanadianCape VerdeanCarpatho RusynCelticCentral AmericanCentral American IndianCherokeeCheyenneChickasawChileanChineseChippewaChoctawColombianColvilleComancheCosta RicanCreeCreekCroatianCrowCubanCypriotCzechCzechoslovakianDanishDelawareDominicanDutchDutch West IndianEastern EuropeanEcuadorianEgyptianEnglishEstonianEthiopianEuropeanFilipinoFinnishFrenchFrench American IndianFrench CanadianGermanGerman RussianGhanaianGreekGuamanian/ChamorroGuatemalanGuyaneseHaitianHmongHonduranHopiHoumaHungarianIcelanderIndian (Asian)IndonesianInupiatIranianIraqiIrishIroquoisIsraeliItalianJamaicanJapaneseJordanianKenyanKiowaKoreanLaotianLatvianLebaneseLiberianLithuanianLumbeeLuxembourgerMacedonianMalaysianMalteseMarshalleseMenomineeMexicanMexican American IndianMongolianMoroccanNative HawaiianNavajoNepaleseNew ZealanderNicaraguanNigerianNorthern EuropeanNorwegianOkinawanOsageOttawaPaiutePakistaniPalestinianPanamanianParaguayanPennsylvania GermanPeruvianPimaPolishPortuguesePotawatomiPuebloPuerto RicanPuget Sound SalishRomanianRussianSalvadoranSamoanScandinavianScotch-IrishScottishSeminoleSenegaleseSerbianShoshoneSierra LeoneanSiouxSlavicSlovakSloveneSomaliSouth AfricanSouth AmericanSouth American IndianSoviet UnionSpaniardSpanishSpanish AmericanSpanish American IndianSri LankanSubsaharan AfricanSudaneseSwedishSwissSyrianTaiwaneseThaiTlingit-HaidaTohono O'OdhamTonganTrinidadian and TobagonianTsimshianTurkishU.S. Virgin IslanderUgandanUkrainianUruguayanUteVenezuelanVietnameseWelshWest IndianYakamaYaquiYugoslavianYumanYup'ikZimbabwean
Immigration
NonimmigrantsImmigrantsAfghanistanAfricaAlbaniaArgentinaArmeniaAsiaAustraliaAustriaBahamasBangladeshBarbadosBelarusBelgiumBelizeBoliviaBosnia and HerzegovinaBrazilBulgariaBurma/MyanmarCabo VerdeCambodiaCameroonCanadaCaribbeanCentral AmericaChileChinaColombiaCongoCosta RicaCroatiaCubaCzechoslovakiaDenmarkDominicaDominican RepublicEastern AfricaEastern AsiaEastern EuropeEcuadorEgyptEl SalvadorEnglandEritreaEthiopiaEuropeFijiFranceGermanyGhanaGreeceGrenadaGuatemalaGuyanaHaitiHondurasHong KongHungaryIndiaIndonesiaIranIraqIrelandIsraelItalyJamaicaJapanJordanKazakhstanKenyaKoreaKuwaitLaosLatin AmericaLatviaLebanonLiberiaLithuaniaMalaysiaMexicoMicronesiaMiddle AfricaMoldovaMoroccoNepalNetherlandsNicaraguaNigeriaNorth AmericaNorth MacedoniaNorthern AfricaNorthern EuropeNorwayOceaniaPakistanPanamaPeruPhilippinesPolandPortugalRomaniaRussiaSaudi ArabiaScotlandSenegalSerbiaSierra LeoneSingaporeSomaliaSouth AfricaSouth AmericaSouth Central AsiaSouth Eastern AsiaSouthern EuropeSpainSri LankaSt. Vincent and the GrenadinesSudanSwedenSwitzerlandSyriaTaiwanThailandTrinidad and TobagoTurkeyUgandaUkraineUruguayUzbekistanVenezuelaVietnamWest IndiesWestern AfricaWestern AsiaWestern EuropeYemenZaireZimbabweAzores
Householder Income Under 25 years
Income
Poverty
Unemployment
Labor Participation
Family Structure
Vehicle Availability
Education Level
Disability

Householder Income Under 25 years Comparison

Fijians

Immigrants from Ireland

Tragic
Exceptional
$50,132
HOUSEHOLDER INCOME UNDER 25 YEARS
0.6/ 100
METRIC RATING
264th/ 347
METRIC RANK
$57,075
HOUSEHOLDER INCOME UNDER 25 YEARS
100.0/ 100
METRIC RATING
20th/ 347
METRIC RANK

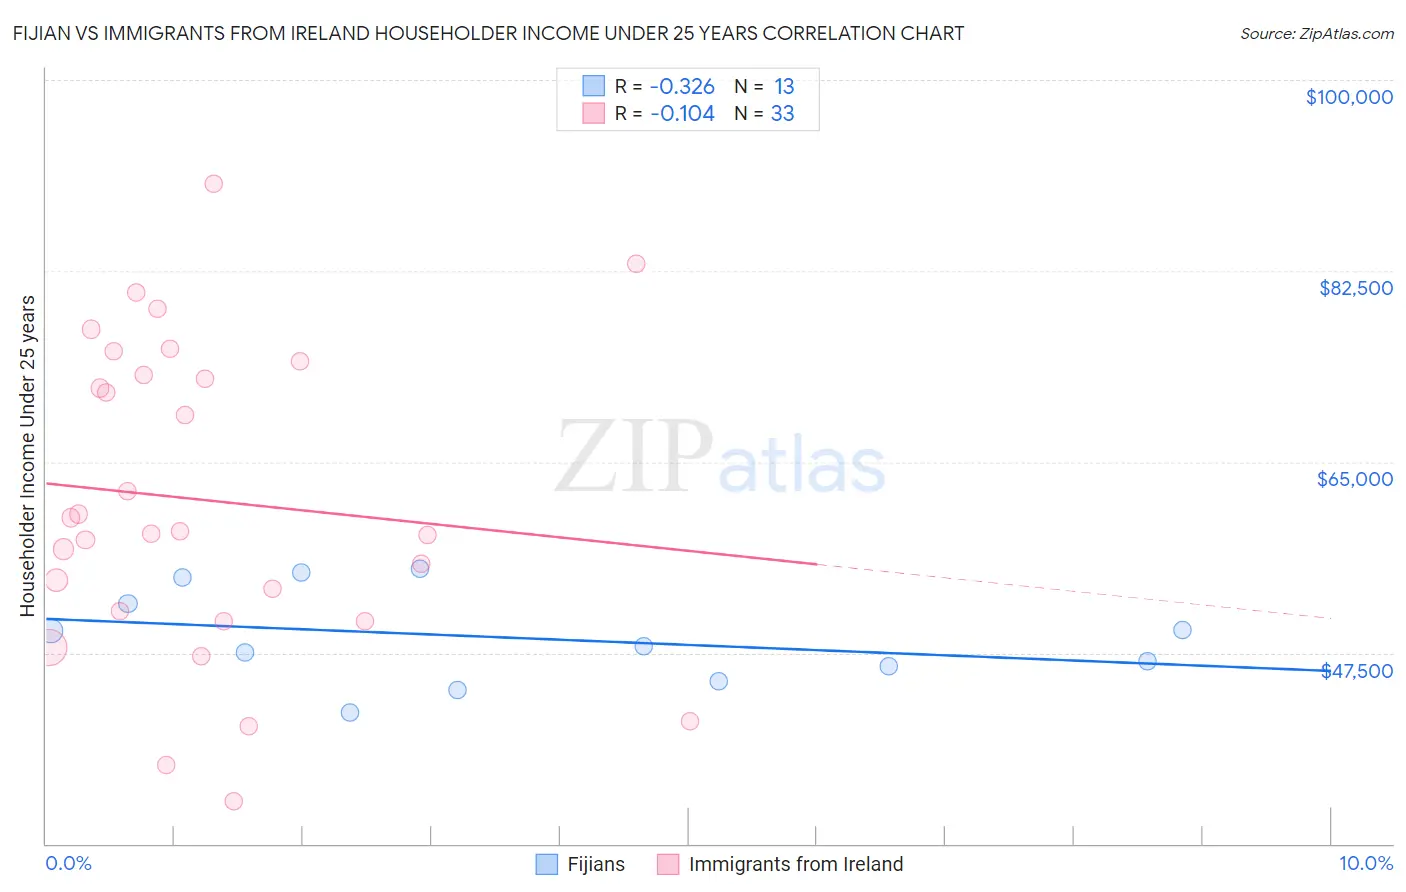
Fijian vs Immigrants from Ireland Householder Income Under 25 years Correlation Chart

The statistical analysis conducted on geographies consisting of 53,807,935 people shows a mild negative correlation between the proportion of Fijians and household income with householder under the age of 25 in the United States with a correlation coefficient (R) of -0.326 and weighted average of $50,132. Similarly, the statistical analysis conducted on geographies consisting of 203,844,468 people shows a poor negative correlation between the proportion of Immigrants from Ireland and household income with householder under the age of 25 in the United States with a correlation coefficient (R) of -0.104 and weighted average of $57,075, a difference of 13.9%.
Fijian vs Immigrants from Ireland Householder Income Under 25 years

Householder Income Under 25 years Correlation Summary

MeasurementFijianImmigrants from Ireland
Minimum$42,002$33,875
Maximum$55,154$90,500
Range$13,151$56,625
Mean$48,862$61,493
Median$48,154$58,663
Interquartile 25% (IQ1)$45,561$50,831
Interquartile 75% (IQ3)$53,230$73,599
Interquartile Range (IQR)$7,669$22,768
Standard Deviation (Sample)$4,254$14,181
Standard Deviation (Population)$4,087$13,964

Similar Demographics by Householder Income Under 25 years

Demographics Similar to Fijians by Householder Income Under 25 years

In terms of householder income under 25 years, the demographic groups most similar to Fijians are Belgian ($50,113, a difference of 0.040%), Immigrants from Venezuela ($50,109, a difference of 0.050%), Immigrants from Dominican Republic ($50,204, a difference of 0.14%), Immigrants from Laos ($50,041, a difference of 0.18%), and Haitian ($50,231, a difference of 0.20%).
DemographicsRating | RankHouseholder Income Under 25 years
Lebanese
1.1
/100
|
#257
Tragic
$50,355
Whites/Caucasians
1.1
/100
|
#258
Tragic
$50,336
Immigrants | Dominica
1.0
/100
|
#259
Tragic
$50,301
Hispanics or Latinos
0.9
/100
|
#260
Tragic
$50,279
Hungarians
0.9
/100
|
#261
Tragic
$50,247
Haitians
0.8
/100
|
#262
Tragic
$50,231
Immigrants | Dominican Republic
0.8
/100
|
#263
Tragic
$50,204
Fijians
0.6
/100
|
#264
Tragic
$50,132
Belgians
0.6
/100
|
#265
Tragic
$50,113
Immigrants | Venezuela
0.6
/100
|
#266
Tragic
$50,109
Immigrants | Laos
0.5
/100
|
#267
Tragic
$50,041
Venezuelans
0.5
/100
|
#268
Tragic
$50,011
Ute
0.5
/100
|
#269
Tragic
$49,997
Mexicans
0.5
/100
|
#270
Tragic
$49,989
Taiwanese
0.3
/100
|
#271
Tragic
$49,804

Demographics Similar to Immigrants from Ireland by Householder Income Under 25 years

In terms of householder income under 25 years, the demographic groups most similar to Immigrants from Ireland are Immigrants from Fiji ($57,074, a difference of 0.0%), Bhutanese ($57,078, a difference of 0.010%), Immigrants from Eastern Asia ($57,123, a difference of 0.080%), Asian ($57,003, a difference of 0.13%), and Tongan ($56,972, a difference of 0.18%).
DemographicsRating | RankHouseholder Income Under 25 years
Immigrants | South Central Asia
100.0
/100
|
#13
Exceptional
$57,818
Filipinos
100.0
/100
|
#14
Exceptional
$57,740
Koreans
100.0
/100
|
#15
Exceptional
$57,730
Immigrants | Afghanistan
100.0
/100
|
#16
Exceptional
$57,478
Sierra Leoneans
100.0
/100
|
#17
Exceptional
$57,272
Immigrants | Eastern Asia
100.0
/100
|
#18
Exceptional
$57,123
Bhutanese
100.0
/100
|
#19
Exceptional
$57,078
Immigrants | Ireland
100.0
/100
|
#20
Exceptional
$57,075
Immigrants | Fiji
100.0
/100
|
#21
Exceptional
$57,074
Asians
100.0
/100
|
#22
Exceptional
$57,003
Tongans
100.0
/100
|
#23
Exceptional
$56,972
Immigrants | Singapore
100.0
/100
|
#24
Exceptional
$56,835
Immigrants | Pakistan
100.0
/100
|
#25
Exceptional
$56,789
Immigrants | Australia
100.0
/100
|
#26
Exceptional
$56,660
Immigrants | North Macedonia
100.0
/100
|
#27
Exceptional
$56,503