Egyptian vs Native Hawaiian Median Household Income
COMPARE
Egyptian
Native Hawaiian
Median Household Income
Median Household Income Comparison
Egyptians
Native Hawaiians
$95,673
MEDIAN HOUSEHOLD INCOME
99.9/ 100
METRIC RATING
54th/ 347
METRIC RANK
$89,919
MEDIAN HOUSEHOLD INCOME
95.7/ 100
METRIC RATING
116th/ 347
METRIC RANK
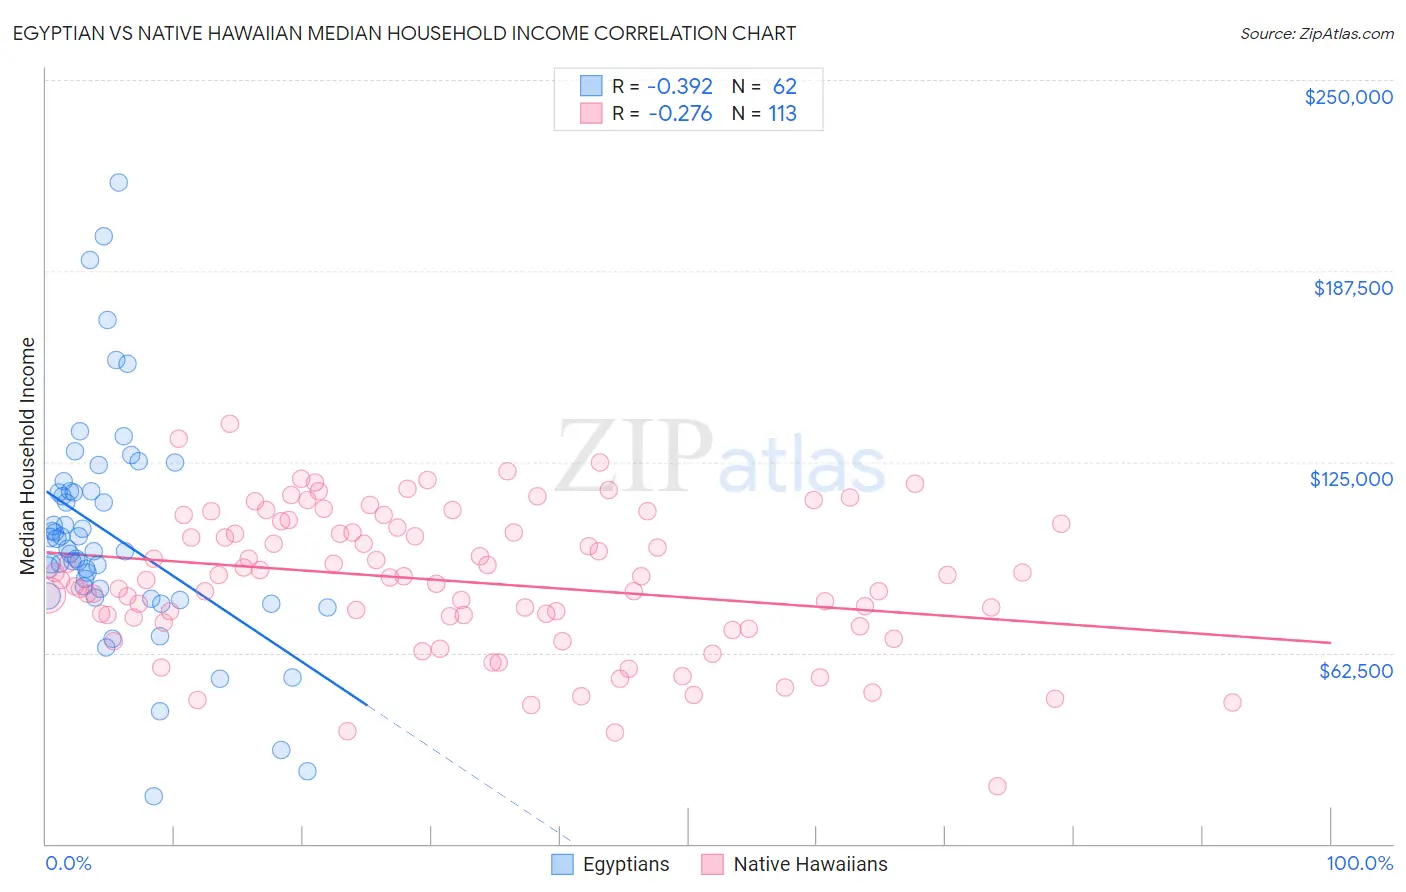
Egyptian vs Native Hawaiian Median Household Income Correlation Chart
The statistical analysis conducted on geographies consisting of 276,717,695 people shows a mild negative correlation between the proportion of Egyptians and median household income in the United States with a correlation coefficient (R) of -0.392 and weighted average of $95,673. Similarly, the statistical analysis conducted on geographies consisting of 331,802,706 people shows a weak negative correlation between the proportion of Native Hawaiians and median household income in the United States with a correlation coefficient (R) of -0.276 and weighted average of $89,919, a difference of 6.4%.
Median Household Income Correlation Summary
| Measurement | Egyptian | Native Hawaiian |
| Minimum | $15,682 | $18,739 |
| Maximum | $216,495 | $137,302 |
| Range | $200,813 | $118,563 |
| Mean | $100,993 | $86,036 |
| Median | $96,117 | $87,089 |
| Interquartile 25% (IQ1) | $81,164 | $73,233 |
| Interquartile 75% (IQ3) | $115,184 | $104,035 |
| Interquartile Range (IQR) | $34,020 | $30,802 |
| Standard Deviation (Sample) | $37,055 | $23,037 |
| Standard Deviation (Population) | $36,755 | $22,935 |
Similar Demographics by Median Household Income
Demographics Similar to Egyptians by Median Household Income
In terms of median household income, the demographic groups most similar to Egyptians are Paraguayan ($95,737, a difference of 0.070%), Immigrants from South Africa ($95,800, a difference of 0.13%), Estonian ($95,930, a difference of 0.27%), Immigrants from Czechoslovakia ($95,319, a difference of 0.37%), and Immigrants from Austria ($95,277, a difference of 0.42%).
| Demographics | Rating | Rank | Median Household Income |
| Immigrants | Russia | 99.9 /100 | #47 | Exceptional $96,378 |
| Cambodians | 99.9 /100 | #48 | Exceptional $96,324 |
| Immigrants | Malaysia | 99.9 /100 | #49 | Exceptional $96,292 |
| Bulgarians | 99.9 /100 | #50 | Exceptional $96,290 |
| Estonians | 99.9 /100 | #51 | Exceptional $95,930 |
| Immigrants | South Africa | 99.9 /100 | #52 | Exceptional $95,800 |
| Paraguayans | 99.9 /100 | #53 | Exceptional $95,737 |
| Egyptians | 99.9 /100 | #54 | Exceptional $95,673 |
| Immigrants | Czechoslovakia | 99.9 /100 | #55 | Exceptional $95,319 |
| Immigrants | Austria | 99.9 /100 | #56 | Exceptional $95,277 |
| New Zealanders | 99.8 /100 | #57 | Exceptional $95,146 |
| Soviet Union | 99.8 /100 | #58 | Exceptional $95,098 |
| Immigrants | Europe | 99.8 /100 | #59 | Exceptional $95,032 |
| Koreans | 99.8 /100 | #60 | Exceptional $95,018 |
| Laotians | 99.8 /100 | #61 | Exceptional $94,990 |
Demographics Similar to Native Hawaiians by Median Household Income
In terms of median household income, the demographic groups most similar to Native Hawaiians are Taiwanese ($89,900, a difference of 0.020%), Immigrants from Western Asia ($90,005, a difference of 0.10%), Syrian ($89,830, a difference of 0.10%), Immigrants from Northern Africa ($90,026, a difference of 0.12%), and Albanian ($89,744, a difference of 0.20%).
| Demographics | Rating | Rank | Median Household Income |
| Chileans | 97.2 /100 | #109 | Exceptional $90,605 |
| Palestinians | 97.1 /100 | #110 | Exceptional $90,574 |
| Immigrants | Poland | 97.1 /100 | #111 | Exceptional $90,549 |
| Northern Europeans | 96.9 /100 | #112 | Exceptional $90,446 |
| Peruvians | 96.5 /100 | #113 | Exceptional $90,261 |
| Immigrants | Northern Africa | 95.9 /100 | #114 | Exceptional $90,026 |
| Immigrants | Western Asia | 95.9 /100 | #115 | Exceptional $90,005 |
| Native Hawaiians | 95.7 /100 | #116 | Exceptional $89,919 |
| Taiwanese | 95.6 /100 | #117 | Exceptional $89,900 |
| Syrians | 95.4 /100 | #118 | Exceptional $89,830 |
| Albanians | 95.2 /100 | #119 | Exceptional $89,744 |
| Immigrants | North Macedonia | 95.2 /100 | #120 | Exceptional $89,741 |
| Ethiopians | 94.9 /100 | #121 | Exceptional $89,640 |
| Pakistanis | 94.8 /100 | #122 | Exceptional $89,638 |
| Immigrants | Zimbabwe | 94.4 /100 | #123 | Exceptional $89,496 |