Ecuadorian vs Choctaw Householder Income Ages 25 - 44 years

COMPARE

Ecuadorian
Race
Ancestry
AfghanAfricanAlaska NativeAlaskan AthabascanAlbanianAleutAlsatianAmericanApacheArabArapahoArgentineanArmenianAssyrian/Chaldean/SyriacAustralianAustrianBahamianBangladeshiBarbadianBasqueBelgianBelizeanBermudanBhutaneseBlackfeetBolivianBrazilianBritishBritish West IndianBulgarianBurmeseCajunCambodianCanadianCape VerdeanCarpatho RusynCelticCentral AmericanCentral American IndianCherokeeCheyenneChickasawChileanChineseChippewaColombianColvilleComancheCosta RicanCreeCreekCroatianCrowCubanCypriotCzechCzechoslovakianDanishDelawareDominicanDutchDutch West IndianEastern EuropeanEcuadorianEgyptianEnglishEstonianEthiopianEuropeanFijianFilipinoFinnishFrenchFrench American IndianFrench CanadianGermanGerman RussianGhanaianGreekGuamanian/ChamorroGuatemalanGuyaneseHaitianHmongHonduranHopiHoumaHungarianIcelanderIndian (Asian)IndonesianInupiatIranianIraqiIrishIroquoisIsraeliItalianJamaicanJapaneseJordanianKenyanKiowaKoreanLaotianLatvianLebaneseLiberianLithuanianLumbeeLuxembourgerMacedonianMalaysianMalteseMarshalleseMenomineeMexicanMexican American IndianMongolianMoroccanNative HawaiianNavajoNepaleseNew ZealanderNicaraguanNigerianNorthern EuropeanNorwegianOkinawanOsageOttawaPaiutePakistaniPalestinianPanamanianParaguayanPennsylvania GermanPeruvianPimaPolishPortuguesePotawatomiPuebloPuerto RicanPuget Sound SalishRomanianRussianSalvadoranSamoanScandinavianScotch-IrishScottishSeminoleSenegaleseSerbianShoshoneSierra LeoneanSiouxSlavicSlovakSloveneSomaliSouth AfricanSouth AmericanSouth American IndianSoviet UnionSpaniardSpanishSpanish AmericanSpanish American IndianSri LankanSubsaharan AfricanSudaneseSwedishSwissSyrianTaiwaneseThaiTlingit-HaidaTohono O'OdhamTonganTrinidadian and TobagonianTsimshianTurkishU.S. Virgin IslanderUgandanUkrainianUruguayanUteVenezuelanVietnameseWelshWest IndianYakamaYaquiYugoslavianYumanYup'ikZimbabwean
Immigration
NonimmigrantsImmigrantsAfghanistanAfricaAlbaniaArgentinaArmeniaAsiaAustraliaAustriaBahamasBangladeshBarbadosBelarusBelgiumBelizeBoliviaBosnia and HerzegovinaBrazilBulgariaBurma/MyanmarCabo VerdeCambodiaCameroonCanadaCaribbeanCentral AmericaChileChinaColombiaCongoCosta RicaCroatiaCubaCzechoslovakiaDenmarkDominicaDominican RepublicEastern AfricaEastern AsiaEastern EuropeEcuadorEgyptEl SalvadorEnglandEritreaEthiopiaEuropeFijiFranceGermanyGhanaGreeceGrenadaGuatemalaGuyanaHaitiHondurasHong KongHungaryIndiaIndonesiaIranIraqIrelandIsraelItalyJamaicaJapanJordanKazakhstanKenyaKoreaKuwaitLaosLatin AmericaLatviaLebanonLiberiaLithuaniaMalaysiaMexicoMicronesiaMiddle AfricaMoldovaMoroccoNepalNetherlandsNicaraguaNigeriaNorth AmericaNorth MacedoniaNorthern AfricaNorthern EuropeNorwayOceaniaPakistanPanamaPeruPhilippinesPolandPortugalRomaniaRussiaSaudi ArabiaScotlandSenegalSerbiaSierra LeoneSingaporeSomaliaSouth AfricaSouth AmericaSouth Central AsiaSouth Eastern AsiaSouthern EuropeSpainSri LankaSt. Vincent and the GrenadinesSudanSwedenSwitzerlandSyriaTaiwanThailandTrinidad and TobagoTurkeyUgandaUkraineUruguayUzbekistanVenezuelaVietnamWest IndiesWestern AfricaWestern AsiaWestern EuropeYemenZaireZimbabweAzores
Choctaw
Race
Ancestry
AfghanAfricanAlaska NativeAlaskan AthabascanAlbanianAleutAlsatianAmericanApacheArabArapahoArgentineanArmenianAssyrian/Chaldean/SyriacAustralianAustrianBahamianBangladeshiBarbadianBasqueBelgianBelizeanBermudanBhutaneseBlackfeetBolivianBrazilianBritishBritish West IndianBulgarianBurmeseCajunCambodianCanadianCape VerdeanCarpatho RusynCelticCentral AmericanCentral American IndianCherokeeCheyenneChickasawChileanChineseChippewaChoctawColombianColvilleComancheCosta RicanCreeCreekCroatianCrowCubanCypriotCzechCzechoslovakianDanishDelawareDominicanDutchDutch West IndianEastern EuropeanEgyptianEnglishEstonianEthiopianEuropeanFijianFilipinoFinnishFrenchFrench American IndianFrench CanadianGermanGerman RussianGhanaianGreekGuamanian/ChamorroGuatemalanGuyaneseHaitianHmongHonduranHopiHoumaHungarianIcelanderIndian (Asian)IndonesianInupiatIranianIraqiIrishIroquoisIsraeliItalianJamaicanJapaneseJordanianKenyanKiowaKoreanLaotianLatvianLebaneseLiberianLithuanianLumbeeLuxembourgerMacedonianMalaysianMalteseMarshalleseMenomineeMexicanMexican American IndianMongolianMoroccanNative HawaiianNavajoNepaleseNew ZealanderNicaraguanNigerianNorthern EuropeanNorwegianOkinawanOsageOttawaPaiutePakistaniPalestinianPanamanianParaguayanPennsylvania GermanPeruvianPimaPolishPortuguesePotawatomiPuebloPuerto RicanPuget Sound SalishRomanianRussianSalvadoranSamoanScandinavianScotch-IrishScottishSeminoleSenegaleseSerbianShoshoneSierra LeoneanSiouxSlavicSlovakSloveneSomaliSouth AfricanSouth AmericanSouth American IndianSoviet UnionSpaniardSpanishSpanish AmericanSpanish American IndianSri LankanSubsaharan AfricanSudaneseSwedishSwissSyrianTaiwaneseThaiTlingit-HaidaTohono O'OdhamTonganTrinidadian and TobagonianTsimshianTurkishU.S. Virgin IslanderUgandanUkrainianUruguayanUteVenezuelanVietnameseWelshWest IndianYakamaYaquiYugoslavianYumanYup'ikZimbabwean
Immigration
NonimmigrantsImmigrantsAfghanistanAfricaAlbaniaArgentinaArmeniaAsiaAustraliaAustriaBahamasBangladeshBarbadosBelarusBelgiumBelizeBoliviaBosnia and HerzegovinaBrazilBulgariaBurma/MyanmarCabo VerdeCambodiaCameroonCanadaCaribbeanCentral AmericaChileChinaColombiaCongoCosta RicaCroatiaCubaCzechoslovakiaDenmarkDominicaDominican RepublicEastern AfricaEastern AsiaEastern EuropeEcuadorEgyptEl SalvadorEnglandEritreaEthiopiaEuropeFijiFranceGermanyGhanaGreeceGrenadaGuatemalaGuyanaHaitiHondurasHong KongHungaryIndiaIndonesiaIranIraqIrelandIsraelItalyJamaicaJapanJordanKazakhstanKenyaKoreaKuwaitLaosLatin AmericaLatviaLebanonLiberiaLithuaniaMalaysiaMexicoMicronesiaMiddle AfricaMoldovaMoroccoNepalNetherlandsNicaraguaNigeriaNorth AmericaNorth MacedoniaNorthern AfricaNorthern EuropeNorwayOceaniaPakistanPanamaPeruPhilippinesPolandPortugalRomaniaRussiaSaudi ArabiaScotlandSenegalSerbiaSierra LeoneSingaporeSomaliaSouth AfricaSouth AmericaSouth Central AsiaSouth Eastern AsiaSouthern EuropeSpainSri LankaSt. Vincent and the GrenadinesSudanSwedenSwitzerlandSyriaTaiwanThailandTrinidad and TobagoTurkeyUgandaUkraineUruguayUzbekistanVenezuelaVietnamWest IndiesWestern AfricaWestern AsiaWestern EuropeYemenZaireZimbabweAzores
Householder Income Ages 25 - 44 years
Income
Poverty
Unemployment
Labor Participation
Family Structure
Vehicle Availability
Education Level
Disability

Householder Income Ages 25 - 44 years Comparison

Ecuadorians

Choctaw

Poor
Tragic
$91,574
HOUSEHOLDER INCOME AGES 25 - 44 YEARS
16.0/ 100
METRIC RATING
202nd/ 347
METRIC RANK
$78,168
HOUSEHOLDER INCOME AGES 25 - 44 YEARS
0.0/ 100
METRIC RATING
320th/ 347
METRIC RANK

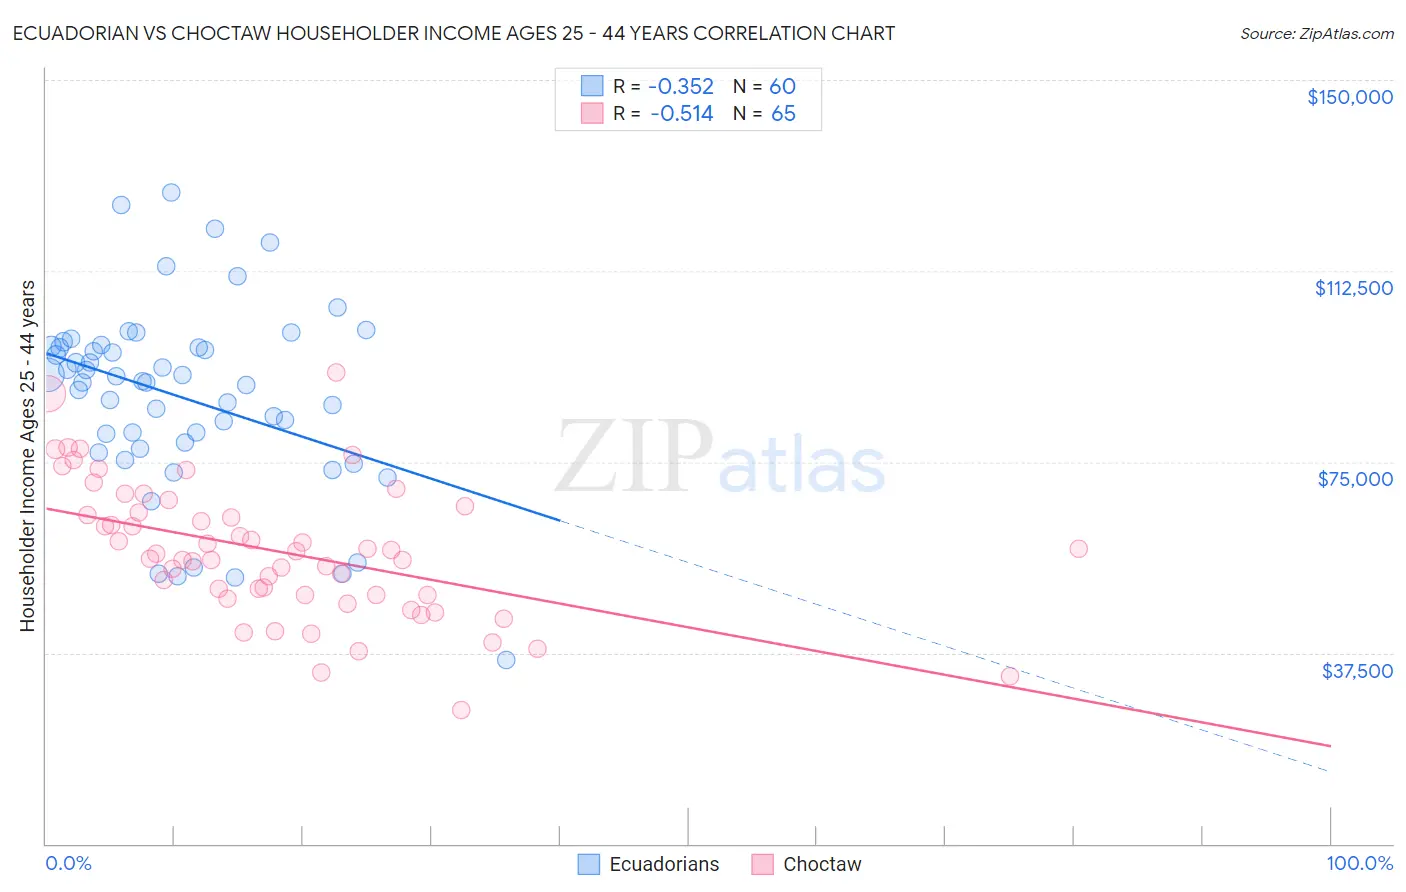
Ecuadorian vs Choctaw Householder Income Ages 25 - 44 years Correlation Chart

The statistical analysis conducted on geographies consisting of 317,341,499 people shows a mild negative correlation between the proportion of Ecuadorians and household income with householder between the ages 25 and 44 in the United States with a correlation coefficient (R) of -0.352 and weighted average of $91,574. Similarly, the statistical analysis conducted on geographies consisting of 269,000,515 people shows a substantial negative correlation between the proportion of Choctaw and household income with householder between the ages 25 and 44 in the United States with a correlation coefficient (R) of -0.514 and weighted average of $78,168, a difference of 17.2%.
Ecuadorian vs Choctaw Householder Income Ages 25 - 44 years

Householder Income Ages 25 - 44 years Correlation Summary

MeasurementEcuadorianChoctaw
Minimum$36,176$26,250
Maximum$127,966$92,500
Range$91,790$66,250
Mean$87,639$57,418
Median$90,671$56,972
Interquartile 25% (IQ1)$78,277$48,750
Interquartile 75% (IQ3)$97,520$65,678
Interquartile Range (IQR)$19,243$16,928
Standard Deviation (Sample)$18,484$13,252
Standard Deviation (Population)$18,329$13,150

Similar Demographics by Householder Income Ages 25 - 44 years

Demographics Similar to Ecuadorians by Householder Income Ages 25 - 44 years

In terms of householder income ages 25 - 44 years, the demographic groups most similar to Ecuadorians are Immigrants from Cambodia ($91,533, a difference of 0.040%), Japanese ($91,624, a difference of 0.050%), Nepalese ($91,498, a difference of 0.080%), White/Caucasian ($91,668, a difference of 0.10%), and Kenyan ($91,684, a difference of 0.12%).
DemographicsRating | RankHouseholder Income Ages 25 - 44 years
Celtics
21.6
/100
|
#195
Fair
$92,241
Immigrants | Colombia
21.3
/100
|
#196
Fair
$92,204
Spanish
21.2
/100
|
#197
Fair
$92,200
Vietnamese
20.2
/100
|
#198
Fair
$92,089
Kenyans
16.8
/100
|
#199
Poor
$91,684
Whites/Caucasians
16.7
/100
|
#200
Poor
$91,668
Japanese
16.4
/100
|
#201
Poor
$91,624
Ecuadorians
16.0
/100
|
#202
Poor
$91,574
Immigrants | Cambodia
15.7
/100
|
#203
Poor
$91,533
Nepalese
15.4
/100
|
#204
Poor
$91,498
Immigrants | Eastern Africa
15.2
/100
|
#205
Poor
$91,458
Aleuts
14.5
/100
|
#206
Poor
$91,370
Yugoslavians
14.5
/100
|
#207
Poor
$91,368
Immigrants | Thailand
14.3
/100
|
#208
Poor
$91,337
Immigrants | Uruguay
13.2
/100
|
#209
Poor
$91,171

Demographics Similar to Choctaw by Householder Income Ages 25 - 44 years

In terms of householder income ages 25 - 44 years, the demographic groups most similar to Choctaw are Immigrants from Zaire ($78,045, a difference of 0.16%), Chickasaw ($77,929, a difference of 0.31%), Honduran ($78,540, a difference of 0.48%), Immigrants from Mexico ($78,809, a difference of 0.82%), and U.S. Virgin Islander ($78,911, a difference of 0.95%).
DemographicsRating | RankHouseholder Income Ages 25 - 44 years
Menominee
0.0
/100
|
#313
Tragic
$79,358
Cheyenne
0.0
/100
|
#314
Tragic
$79,152
Ottawa
0.0
/100
|
#315
Tragic
$79,012
Africans
0.0
/100
|
#316
Tragic
$78,986
U.S. Virgin Islanders
0.0
/100
|
#317
Tragic
$78,911
Immigrants | Mexico
0.0
/100
|
#318
Tragic
$78,809
Hondurans
0.0
/100
|
#319
Tragic
$78,540
Choctaw
0.0
/100
|
#320
Tragic
$78,168
Immigrants | Zaire
0.0
/100
|
#321
Tragic
$78,045
Chickasaw
0.0
/100
|
#322
Tragic
$77,929
Immigrants | Honduras
0.0
/100
|
#323
Tragic
$77,328
Dutch West Indians
0.0
/100
|
#324
Tragic
$77,260
Sioux
0.0
/100
|
#325
Tragic
$77,089
Houma
0.0
/100
|
#326
Tragic
$77,044
Immigrants | Bahamas
0.0
/100
|
#327
Tragic
$76,910