Cuban vs Scandinavian Median Household Income
COMPARE
Cuban
Scandinavian
Median Household Income
Median Household Income Comparison
Cubans
Scandinavians
$73,392
MEDIAN HOUSEHOLD INCOME
0.1/ 100
METRIC RATING
295th/ 347
METRIC RANK
$86,073
MEDIAN HOUSEHOLD INCOME
65.1/ 100
METRIC RATING
166th/ 347
METRIC RANK
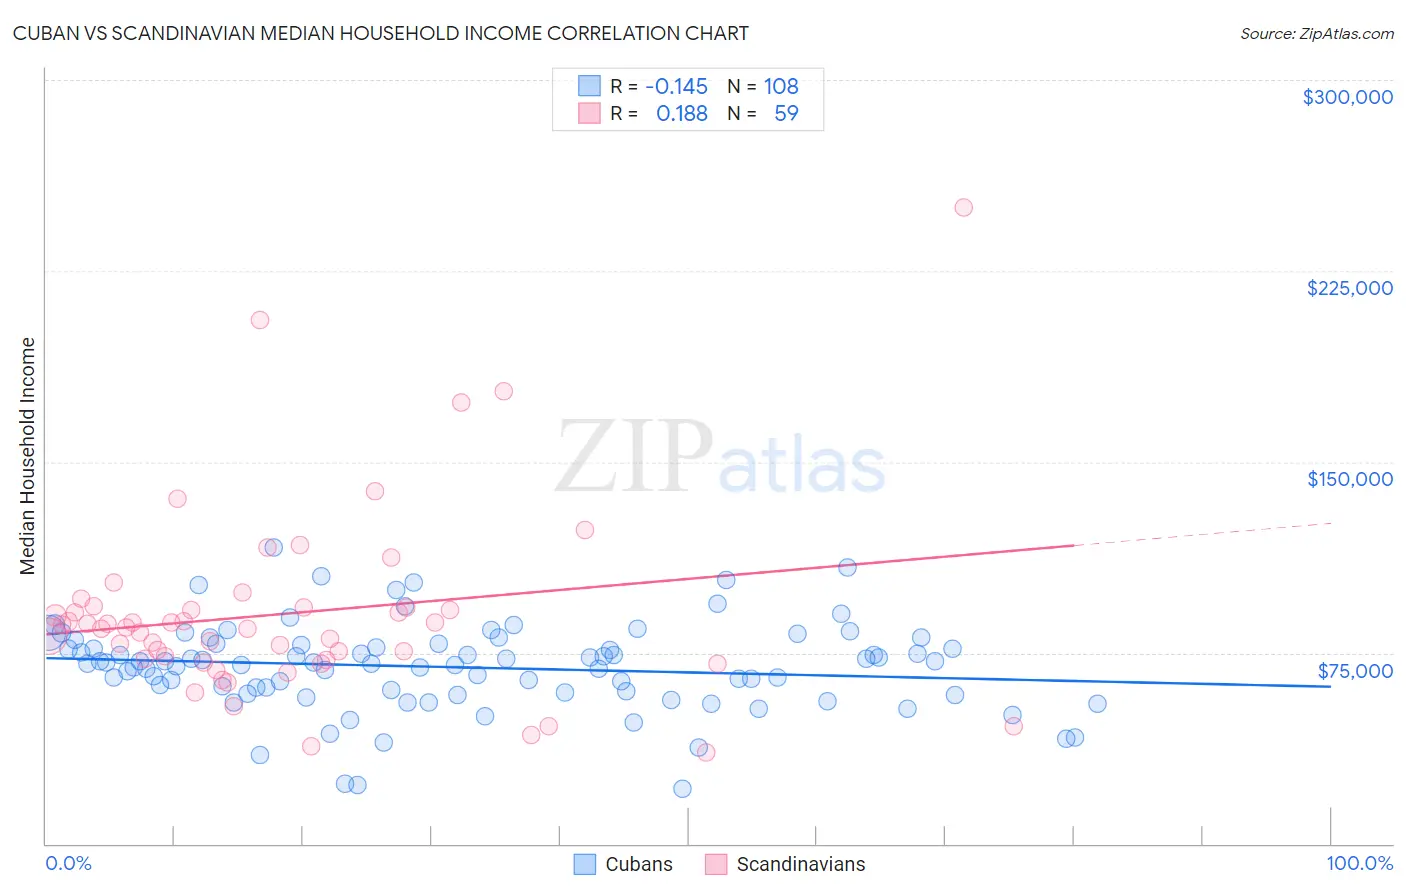
Cuban vs Scandinavian Median Household Income Correlation Chart
The statistical analysis conducted on geographies consisting of 448,852,866 people shows a poor negative correlation between the proportion of Cubans and median household income in the United States with a correlation coefficient (R) of -0.145 and weighted average of $73,392. Similarly, the statistical analysis conducted on geographies consisting of 472,110,165 people shows a poor positive correlation between the proportion of Scandinavians and median household income in the United States with a correlation coefficient (R) of 0.188 and weighted average of $86,073, a difference of 17.3%.
Median Household Income Correlation Summary
| Measurement | Cuban | Scandinavian |
| Minimum | $21,567 | $35,625 |
| Maximum | $116,431 | $250,001 |
| Range | $94,864 | $214,376 |
| Mean | $69,339 | $90,420 |
| Median | $70,955 | $84,951 |
| Interquartile 25% (IQ1) | $59,587 | $72,386 |
| Interquartile 75% (IQ3) | $78,118 | $92,885 |
| Interquartile Range (IQR) | $18,531 | $20,499 |
| Standard Deviation (Sample) | $17,087 | $37,436 |
| Standard Deviation (Population) | $17,007 | $37,118 |
Similar Demographics by Median Household Income
Demographics Similar to Cubans by Median Household Income
In terms of median household income, the demographic groups most similar to Cubans are Haitian ($73,306, a difference of 0.12%), Blackfeet ($73,509, a difference of 0.16%), Immigrants from Cabo Verde ($73,515, a difference of 0.17%), Immigrants from Mexico ($73,160, a difference of 0.32%), and Comanche ($73,747, a difference of 0.48%).
| Demographics | Rating | Rank | Median Household Income |
| Immigrants | Central America | 0.1 /100 | #288 | Tragic $74,217 |
| Fijians | 0.1 /100 | #289 | Tragic $74,205 |
| Bangladeshis | 0.1 /100 | #290 | Tragic $74,112 |
| Hispanics or Latinos | 0.1 /100 | #291 | Tragic $73,823 |
| Comanche | 0.1 /100 | #292 | Tragic $73,747 |
| Immigrants | Cabo Verde | 0.1 /100 | #293 | Tragic $73,515 |
| Blackfeet | 0.1 /100 | #294 | Tragic $73,509 |
| Cubans | 0.1 /100 | #295 | Tragic $73,392 |
| Haitians | 0.1 /100 | #296 | Tragic $73,306 |
| Immigrants | Mexico | 0.0 /100 | #297 | Tragic $73,160 |
| Paiute | 0.0 /100 | #298 | Tragic $72,959 |
| Indonesians | 0.0 /100 | #299 | Tragic $72,856 |
| Immigrants | Dominica | 0.0 /100 | #300 | Tragic $72,760 |
| Cherokee | 0.0 /100 | #301 | Tragic $72,682 |
| Shoshone | 0.0 /100 | #302 | Tragic $72,660 |
Demographics Similar to Scandinavians by Median Household Income
In terms of median household income, the demographic groups most similar to Scandinavians are Norwegian ($86,084, a difference of 0.010%), Irish ($86,145, a difference of 0.080%), Czech ($86,164, a difference of 0.11%), Guamanian/Chamorro ($86,255, a difference of 0.21%), and Immigrants ($85,818, a difference of 0.30%).
| Demographics | Rating | Rank | Median Household Income |
| Immigrants | Uzbekistan | 70.1 /100 | #159 | Good $86,425 |
| Luxembourgers | 70.0 /100 | #160 | Good $86,418 |
| Slavs | 69.7 /100 | #161 | Good $86,398 |
| Guamanians/Chamorros | 67.7 /100 | #162 | Good $86,255 |
| Czechs | 66.4 /100 | #163 | Good $86,164 |
| Irish | 66.2 /100 | #164 | Good $86,145 |
| Norwegians | 65.3 /100 | #165 | Good $86,084 |
| Scandinavians | 65.1 /100 | #166 | Good $86,073 |
| Immigrants | Immigrants | 61.3 /100 | #167 | Good $85,818 |
| Icelanders | 61.0 /100 | #168 | Good $85,797 |
| Colombians | 59.7 /100 | #169 | Average $85,716 |
| Swiss | 59.2 /100 | #170 | Average $85,681 |
| Immigrants | South America | 58.1 /100 | #171 | Average $85,611 |
| Slovenes | 57.4 /100 | #172 | Average $85,562 |
| Immigrants | Cameroon | 53.4 /100 | #173 | Average $85,314 |