Cuban vs Assyrian/Chaldean/Syriac Median Household Income
COMPARE
Cuban
Assyrian/Chaldean/Syriac
Median Household Income
Median Household Income Comparison
Cubans
Assyrians/Chaldeans/Syriacs
$73,392
MEDIAN HOUSEHOLD INCOME
0.1/ 100
METRIC RATING
295th/ 347
METRIC RANK
$91,991
MEDIAN HOUSEHOLD INCOME
98.8/ 100
METRIC RATING
90th/ 347
METRIC RANK
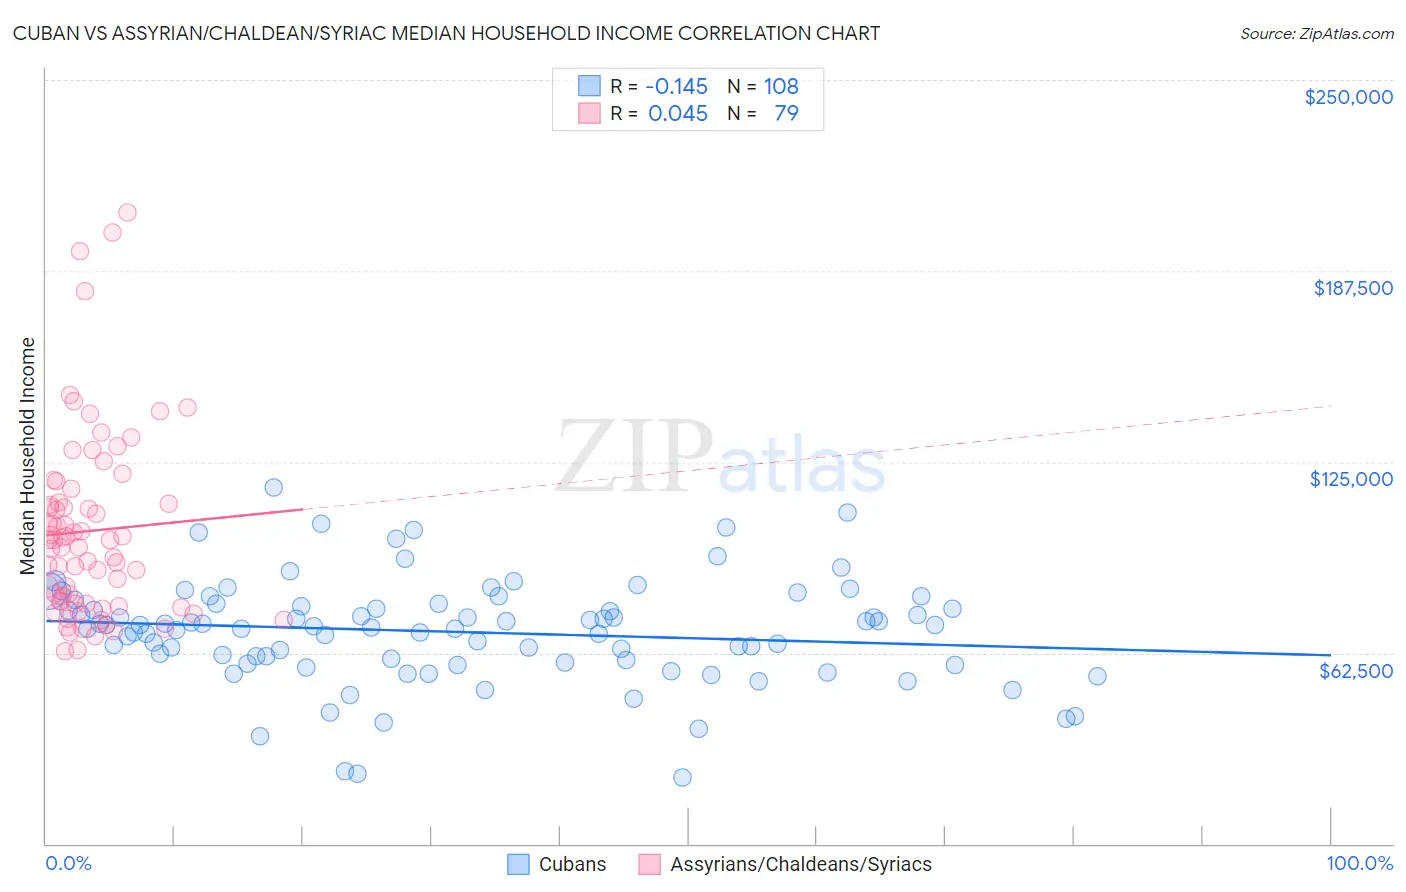
Cuban vs Assyrian/Chaldean/Syriac Median Household Income Correlation Chart
The statistical analysis conducted on geographies consisting of 448,852,866 people shows a poor negative correlation between the proportion of Cubans and median household income in the United States with a correlation coefficient (R) of -0.145 and weighted average of $73,392. Similarly, the statistical analysis conducted on geographies consisting of 110,256,349 people shows no correlation between the proportion of Assyrians/Chaldeans/Syriacs and median household income in the United States with a correlation coefficient (R) of 0.045 and weighted average of $91,991, a difference of 25.3%.
Median Household Income Correlation Summary
| Measurement | Cuban | Assyrian/Chaldean/Syriac |
| Minimum | $21,567 | $63,036 |
| Maximum | $116,431 | $206,750 |
| Range | $94,864 | $143,714 |
| Mean | $69,339 | $102,405 |
| Median | $70,955 | $99,390 |
| Interquartile 25% (IQ1) | $59,587 | $78,587 |
| Interquartile 75% (IQ3) | $78,118 | $111,848 |
| Interquartile Range (IQR) | $18,531 | $33,262 |
| Standard Deviation (Sample) | $17,087 | $30,418 |
| Standard Deviation (Population) | $17,007 | $30,225 |
Similar Demographics by Median Household Income
Demographics Similar to Cubans by Median Household Income
In terms of median household income, the demographic groups most similar to Cubans are Haitian ($73,306, a difference of 0.12%), Blackfeet ($73,509, a difference of 0.16%), Immigrants from Cabo Verde ($73,515, a difference of 0.17%), Immigrants from Mexico ($73,160, a difference of 0.32%), and Comanche ($73,747, a difference of 0.48%).
| Demographics | Rating | Rank | Median Household Income |
| Immigrants | Central America | 0.1 /100 | #288 | Tragic $74,217 |
| Fijians | 0.1 /100 | #289 | Tragic $74,205 |
| Bangladeshis | 0.1 /100 | #290 | Tragic $74,112 |
| Hispanics or Latinos | 0.1 /100 | #291 | Tragic $73,823 |
| Comanche | 0.1 /100 | #292 | Tragic $73,747 |
| Immigrants | Cabo Verde | 0.1 /100 | #293 | Tragic $73,515 |
| Blackfeet | 0.1 /100 | #294 | Tragic $73,509 |
| Cubans | 0.1 /100 | #295 | Tragic $73,392 |
| Haitians | 0.1 /100 | #296 | Tragic $73,306 |
| Immigrants | Mexico | 0.0 /100 | #297 | Tragic $73,160 |
| Paiute | 0.0 /100 | #298 | Tragic $72,959 |
| Indonesians | 0.0 /100 | #299 | Tragic $72,856 |
| Immigrants | Dominica | 0.0 /100 | #300 | Tragic $72,760 |
| Cherokee | 0.0 /100 | #301 | Tragic $72,682 |
| Shoshone | 0.0 /100 | #302 | Tragic $72,660 |
Demographics Similar to Assyrians/Chaldeans/Syriacs by Median Household Income
In terms of median household income, the demographic groups most similar to Assyrians/Chaldeans/Syriacs are Romanian ($91,994, a difference of 0.0%), Immigrants from Vietnam ($91,987, a difference of 0.0%), Immigrants from Canada ($92,029, a difference of 0.040%), Immigrants from Western Europe ($91,936, a difference of 0.060%), and Immigrants from Hungary ($92,094, a difference of 0.11%).
| Demographics | Rating | Rank | Median Household Income |
| Italians | 99.1 /100 | #83 | Exceptional $92,475 |
| Immigrants | Argentina | 99.1 /100 | #84 | Exceptional $92,417 |
| Immigrants | Croatia | 99.0 /100 | #85 | Exceptional $92,225 |
| Immigrants | England | 98.9 /100 | #86 | Exceptional $92,098 |
| Immigrants | Hungary | 98.9 /100 | #87 | Exceptional $92,094 |
| Immigrants | Canada | 98.8 /100 | #88 | Exceptional $92,029 |
| Romanians | 98.8 /100 | #89 | Exceptional $91,994 |
| Assyrians/Chaldeans/Syriacs | 98.8 /100 | #90 | Exceptional $91,991 |
| Immigrants | Vietnam | 98.8 /100 | #91 | Exceptional $91,987 |
| Immigrants | Western Europe | 98.8 /100 | #92 | Exceptional $91,936 |
| Immigrants | Lebanon | 98.7 /100 | #93 | Exceptional $91,887 |
| Immigrants | North America | 98.7 /100 | #94 | Exceptional $91,860 |
| Armenians | 98.7 /100 | #95 | Exceptional $91,807 |
| Jordanians | 98.7 /100 | #96 | Exceptional $91,794 |
| Immigrants | Serbia | 98.6 /100 | #97 | Exceptional $91,730 |