Crow vs Immigrants from South Africa Householder Income Ages 45 - 64 years

COMPARE

Crow
Race
Ancestry
AfghanAfricanAlaska NativeAlaskan AthabascanAlbanianAleutAlsatianAmericanApacheArabArapahoArgentineanArmenianAssyrian/Chaldean/SyriacAustralianAustrianBahamianBangladeshiBarbadianBasqueBelgianBelizeanBermudanBhutaneseBlackfeetBolivianBrazilianBritishBritish West IndianBulgarianBurmeseCajunCambodianCanadianCape VerdeanCarpatho RusynCelticCentral AmericanCentral American IndianCherokeeCheyenneChickasawChileanChineseChippewaChoctawColombianColvilleComancheCosta RicanCreeCreekCroatianCrowCubanCypriotCzechCzechoslovakianDanishDelawareDominicanDutchDutch West IndianEastern EuropeanEcuadorianEgyptianEnglishEstonianEthiopianEuropeanFijianFilipinoFinnishFrenchFrench American IndianFrench CanadianGermanGerman RussianGhanaianGreekGuamanian/ChamorroGuatemalanGuyaneseHaitianHmongHonduranHopiHoumaHungarianIcelanderIndian (Asian)IndonesianInupiatIranianIraqiIrishIroquoisIsraeliItalianJamaicanJapaneseJordanianKenyanKiowaKoreanLaotianLatvianLebaneseLiberianLithuanianLumbeeLuxembourgerMacedonianMalaysianMalteseMarshalleseMenomineeMexicanMexican American IndianMongolianMoroccanNative HawaiianNavajoNepaleseNew ZealanderNicaraguanNigerianNorthern EuropeanNorwegianOkinawanOsageOttawaPaiutePakistaniPalestinianPanamanianParaguayanPennsylvania GermanPeruvianPimaPolishPortuguesePotawatomiPuebloPuerto RicanPuget Sound SalishRomanianRussianSalvadoranSamoanScandinavianScotch-IrishScottishSeminoleSenegaleseSerbianShoshoneSierra LeoneanSiouxSlavicSlovakSloveneSomaliSouth AfricanSouth AmericanSouth American IndianSoviet UnionSpaniardSpanishSpanish AmericanSpanish American IndianSri LankanSubsaharan AfricanSudaneseSwedishSwissSyrianTaiwaneseThaiTlingit-HaidaTohono O'OdhamTonganTrinidadian and TobagonianTsimshianTurkishU.S. Virgin IslanderUgandanUkrainianUruguayanUteVenezuelanVietnameseWelshWest IndianYakamaYaquiYugoslavianYumanYup'ikZimbabwean
Immigration
NonimmigrantsImmigrantsAfghanistanAfricaAlbaniaArgentinaArmeniaAsiaAustraliaAustriaBahamasBangladeshBarbadosBelarusBelgiumBelizeBoliviaBosnia and HerzegovinaBrazilBulgariaBurma/MyanmarCabo VerdeCambodiaCameroonCanadaCaribbeanCentral AmericaChileChinaColombiaCongoCosta RicaCroatiaCubaCzechoslovakiaDenmarkDominicaDominican RepublicEastern AfricaEastern AsiaEastern EuropeEcuadorEgyptEl SalvadorEnglandEritreaEthiopiaEuropeFijiFranceGermanyGhanaGreeceGrenadaGuatemalaGuyanaHaitiHondurasHong KongHungaryIndiaIndonesiaIranIraqIrelandIsraelItalyJamaicaJapanJordanKazakhstanKenyaKoreaKuwaitLaosLatin AmericaLatviaLebanonLiberiaLithuaniaMalaysiaMexicoMicronesiaMiddle AfricaMoldovaMoroccoNepalNetherlandsNicaraguaNigeriaNorth AmericaNorth MacedoniaNorthern AfricaNorthern EuropeNorwayOceaniaPakistanPanamaPeruPhilippinesPolandPortugalRomaniaRussiaSaudi ArabiaScotlandSenegalSerbiaSierra LeoneSingaporeSomaliaSouth AmericaSouth Central AsiaSouth Eastern AsiaSouthern EuropeSpainSri LankaSt. Vincent and the GrenadinesSudanSwedenSwitzerlandSyriaTaiwanThailandTrinidad and TobagoTurkeyUgandaUkraineUruguayUzbekistanVenezuelaVietnamWest IndiesWestern AfricaWestern AsiaWestern EuropeYemenZaireZimbabweAzores
Immigrants from South Africa
Race
Ancestry
AfghanAfricanAlaska NativeAlaskan AthabascanAlbanianAleutAlsatianAmericanApacheArabArapahoArgentineanArmenianAssyrian/Chaldean/SyriacAustralianAustrianBahamianBangladeshiBarbadianBasqueBelgianBelizeanBermudanBhutaneseBlackfeetBolivianBrazilianBritishBritish West IndianBulgarianBurmeseCajunCambodianCanadianCape VerdeanCarpatho RusynCelticCentral AmericanCentral American IndianCherokeeCheyenneChickasawChileanChineseChippewaChoctawColombianColvilleComancheCosta RicanCreeCreekCroatianCubanCypriotCzechCzechoslovakianDanishDelawareDominicanDutchDutch West IndianEastern EuropeanEcuadorianEgyptianEnglishEstonianEthiopianEuropeanFijianFilipinoFinnishFrenchFrench American IndianFrench CanadianGermanGerman RussianGhanaianGreekGuamanian/ChamorroGuatemalanGuyaneseHaitianHmongHonduranHopiHoumaHungarianIcelanderIndian (Asian)IndonesianInupiatIranianIraqiIrishIroquoisIsraeliItalianJamaicanJapaneseJordanianKenyanKiowaKoreanLaotianLatvianLebaneseLiberianLithuanianLumbeeLuxembourgerMacedonianMalaysianMalteseMarshalleseMenomineeMexicanMexican American IndianMongolianMoroccanNative HawaiianNavajoNepaleseNew ZealanderNicaraguanNigerianNorthern EuropeanNorwegianOkinawanOsageOttawaPaiutePakistaniPalestinianPanamanianParaguayanPennsylvania GermanPeruvianPimaPolishPortuguesePotawatomiPuebloPuerto RicanPuget Sound SalishRomanianRussianSalvadoranSamoanScandinavianScotch-IrishScottishSeminoleSenegaleseSerbianShoshoneSierra LeoneanSiouxSlavicSlovakSloveneSomaliSouth AfricanSouth AmericanSouth American IndianSoviet UnionSpaniardSpanishSpanish AmericanSpanish American IndianSri LankanSubsaharan AfricanSudaneseSwedishSwissSyrianTaiwaneseThaiTlingit-HaidaTohono O'OdhamTonganTrinidadian and TobagonianTsimshianTurkishU.S. Virgin IslanderUgandanUkrainianUruguayanUteVenezuelanVietnameseWelshWest IndianYakamaYaquiYugoslavianYumanYup'ikZimbabwean
Immigration
NonimmigrantsImmigrantsAfghanistanAfricaAlbaniaArgentinaArmeniaAsiaAustraliaAustriaBahamasBangladeshBarbadosBelarusBelgiumBelizeBoliviaBosnia and HerzegovinaBrazilBulgariaBurma/MyanmarCabo VerdeCambodiaCameroonCanadaCaribbeanCentral AmericaChileChinaColombiaCongoCosta RicaCroatiaCubaCzechoslovakiaDenmarkDominicaDominican RepublicEastern AfricaEastern AsiaEastern EuropeEcuadorEgyptEl SalvadorEnglandEritreaEthiopiaEuropeFijiFranceGermanyGhanaGreeceGrenadaGuatemalaGuyanaHaitiHondurasHong KongHungaryIndiaIndonesiaIranIraqIrelandIsraelItalyJamaicaJapanJordanKazakhstanKenyaKoreaKuwaitLaosLatin AmericaLatviaLebanonLiberiaLithuaniaMalaysiaMexicoMicronesiaMiddle AfricaMoldovaMoroccoNepalNetherlandsNicaraguaNigeriaNorth AmericaNorth MacedoniaNorthern AfricaNorthern EuropeNorwayOceaniaPakistanPanamaPeruPhilippinesPolandPortugalRomaniaRussiaSaudi ArabiaScotlandSenegalSerbiaSierra LeoneSingaporeSomaliaSouth AfricaSouth AmericaSouth Central AsiaSouth Eastern AsiaSouthern EuropeSpainSri LankaSt. Vincent and the GrenadinesSudanSwedenSwitzerlandSyriaTaiwanThailandTrinidad and TobagoTurkeyUgandaUkraineUruguayUzbekistanVenezuelaVietnamWest IndiesWestern AfricaWestern AsiaWestern EuropeYemenZaireZimbabweAzores
Householder Income Ages 45 - 64 years
Income
Poverty
Unemployment
Labor Participation
Family Structure
Vehicle Availability
Education Level
Disability

Householder Income Ages 45 - 64 years Comparison

Crow

Immigrants from South Africa

Tragic
Exceptional
$74,257
HOUSEHOLDER INCOME AGES 45 - 64 YEARS
0.0/ 100
METRIC RATING
341st/ 347
METRIC RANK
$112,886
HOUSEHOLDER INCOME AGES 45 - 64 YEARS
99.8/ 100
METRIC RATING
51st/ 347
METRIC RANK

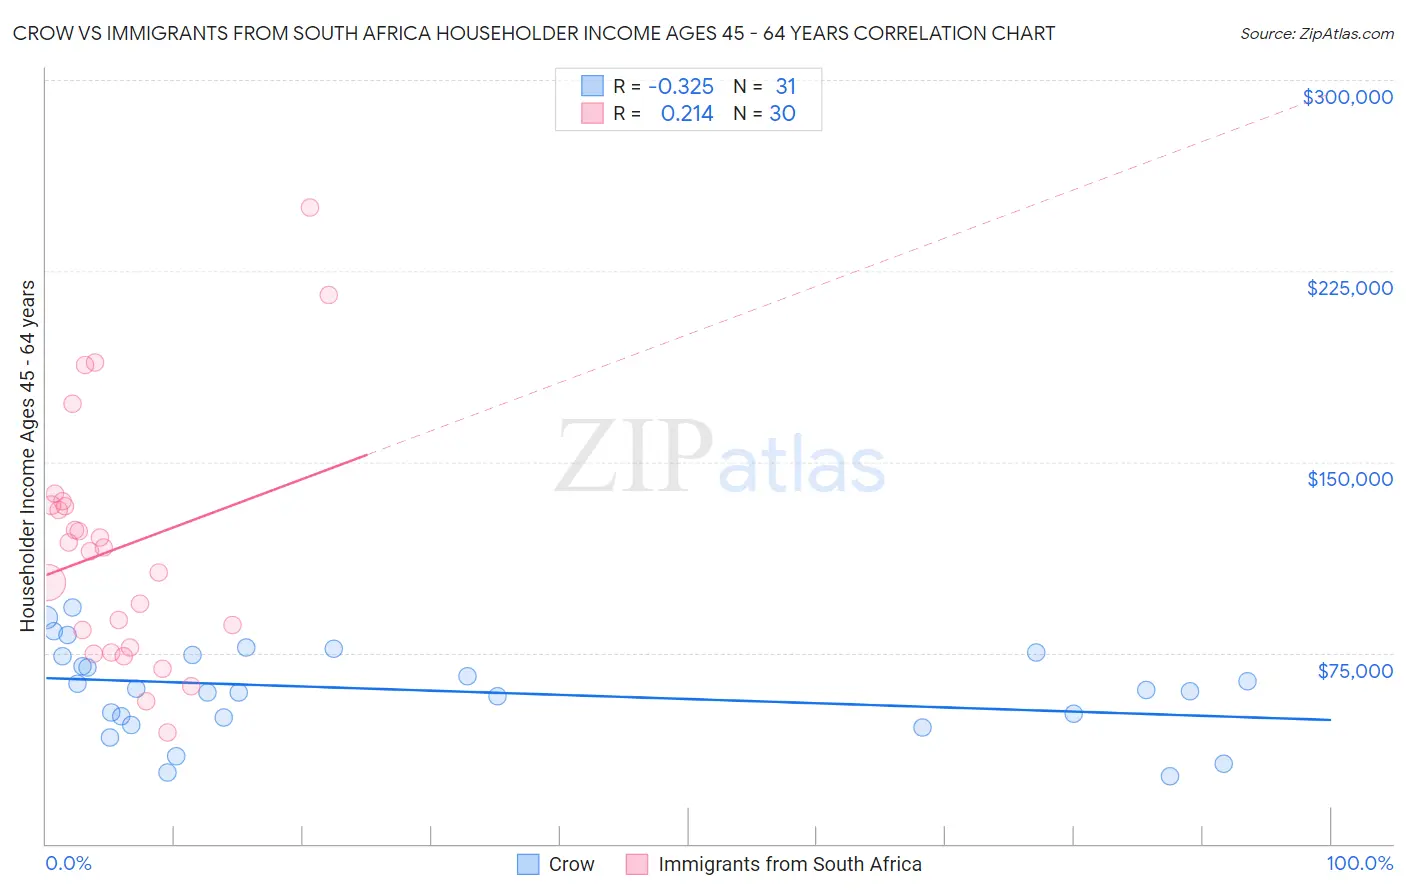
Crow vs Immigrants from South Africa Householder Income Ages 45 - 64 years Correlation Chart

The statistical analysis conducted on geographies consisting of 59,167,326 people shows a mild negative correlation between the proportion of Crow and household income with householder between the ages 45 and 64 in the United States with a correlation coefficient (R) of -0.325 and weighted average of $74,257. Similarly, the statistical analysis conducted on geographies consisting of 233,154,360 people shows a weak positive correlation between the proportion of Immigrants from South Africa and household income with householder between the ages 45 and 64 in the United States with a correlation coefficient (R) of 0.214 and weighted average of $112,886, a difference of 52.0%.
Crow vs Immigrants from South Africa Householder Income Ages 45 - 64 years

Householder Income Ages 45 - 64 years Correlation Summary

MeasurementCrowImmigrants from South Africa
Minimum$26,667$43,750
Maximum$92,611$250,001
Range$65,944$206,251
Mean$60,312$116,416
Median$60,250$115,780
Interquartile 25% (IQ1)$49,750$77,125
Interquartile 75% (IQ3)$74,167$133,043
Interquartile Range (IQR)$24,417$55,918
Standard Deviation (Sample)$17,381$48,210
Standard Deviation (Population)$17,098$47,400

Similar Demographics by Householder Income Ages 45 - 64 years

Demographics Similar to Crow by Householder Income Ages 45 - 64 years

In terms of householder income ages 45 - 64 years, the demographic groups most similar to Crow are Immigrants from Yemen ($74,575, a difference of 0.43%), Tohono O'odham ($73,774, a difference of 0.65%), Kiowa ($74,815, a difference of 0.75%), Pima ($73,365, a difference of 1.2%), and Hopi ($75,562, a difference of 1.8%).
DemographicsRating | RankHouseholder Income Ages 45 - 64 years
Immigrants | Congo
0.0
/100
|
#333
Tragic
$77,850
Menominee
0.0
/100
|
#334
Tragic
$76,903
Cheyenne
0.0
/100
|
#335
Tragic
$76,362
Arapaho
0.0
/100
|
#336
Tragic
$75,945
Pueblo
0.0
/100
|
#337
Tragic
$75,601
Hopi
0.0
/100
|
#338
Tragic
$75,562
Kiowa
0.0
/100
|
#339
Tragic
$74,815
Immigrants | Yemen
0.0
/100
|
#340
Tragic
$74,575
Crow
0.0
/100
|
#341
Tragic
$74,257
Tohono O'odham
0.0
/100
|
#342
Tragic
$73,774
Pima
0.0
/100
|
#343
Tragic
$73,365
Houma
0.0
/100
|
#344
Tragic
$72,093
Navajo
0.0
/100
|
#345
Tragic
$69,759
Puerto Ricans
0.0
/100
|
#346
Tragic
$69,234
Lumbee
0.0
/100
|
#347
Tragic
$65,113

Demographics Similar to Immigrants from South Africa by Householder Income Ages 45 - 64 years

In terms of householder income ages 45 - 64 years, the demographic groups most similar to Immigrants from South Africa are Immigrants from Malaysia ($112,796, a difference of 0.080%), Afghan ($112,676, a difference of 0.19%), Immigrants from Austria ($113,140, a difference of 0.22%), Greek ($112,630, a difference of 0.23%), and Immigrants from Russia ($113,215, a difference of 0.29%).
DemographicsRating | RankHouseholder Income Ages 45 - 64 years
Bulgarians
99.9
/100
|
#44
Exceptional
$113,883
Immigrants | France
99.9
/100
|
#45
Exceptional
$113,680
Immigrants | Greece
99.9
/100
|
#46
Exceptional
$113,548
Australians
99.9
/100
|
#47
Exceptional
$113,533
Immigrants | Indonesia
99.9
/100
|
#48
Exceptional
$113,519
Immigrants | Russia
99.8
/100
|
#49
Exceptional
$113,215
Immigrants | Austria
99.8
/100
|
#50
Exceptional
$113,140
Immigrants | South Africa
99.8
/100
|
#51
Exceptional
$112,886
Immigrants | Malaysia
99.8
/100
|
#52
Exceptional
$112,796
Afghans
99.8
/100
|
#53
Exceptional
$112,676
Greeks
99.8
/100
|
#54
Exceptional
$112,630
Lithuanians
99.8
/100
|
#55
Exceptional
$112,484
Egyptians
99.7
/100
|
#56
Exceptional
$112,256
Immigrants | Scotland
99.7
/100
|
#57
Exceptional
$112,175
Soviet Union
99.7
/100
|
#58
Exceptional
$112,008