Creek vs Immigrants from Indonesia Median Female Earnings
COMPARE
Creek
Immigrants from Indonesia
Median Female Earnings
Median Female Earnings Comparison
Creek
Immigrants from Indonesia
$33,437
MEDIAN FEMALE EARNINGS
0.0/ 100
METRIC RATING
335th/ 347
METRIC RANK
$43,412
MEDIAN FEMALE EARNINGS
100.0/ 100
METRIC RATING
48th/ 347
METRIC RANK
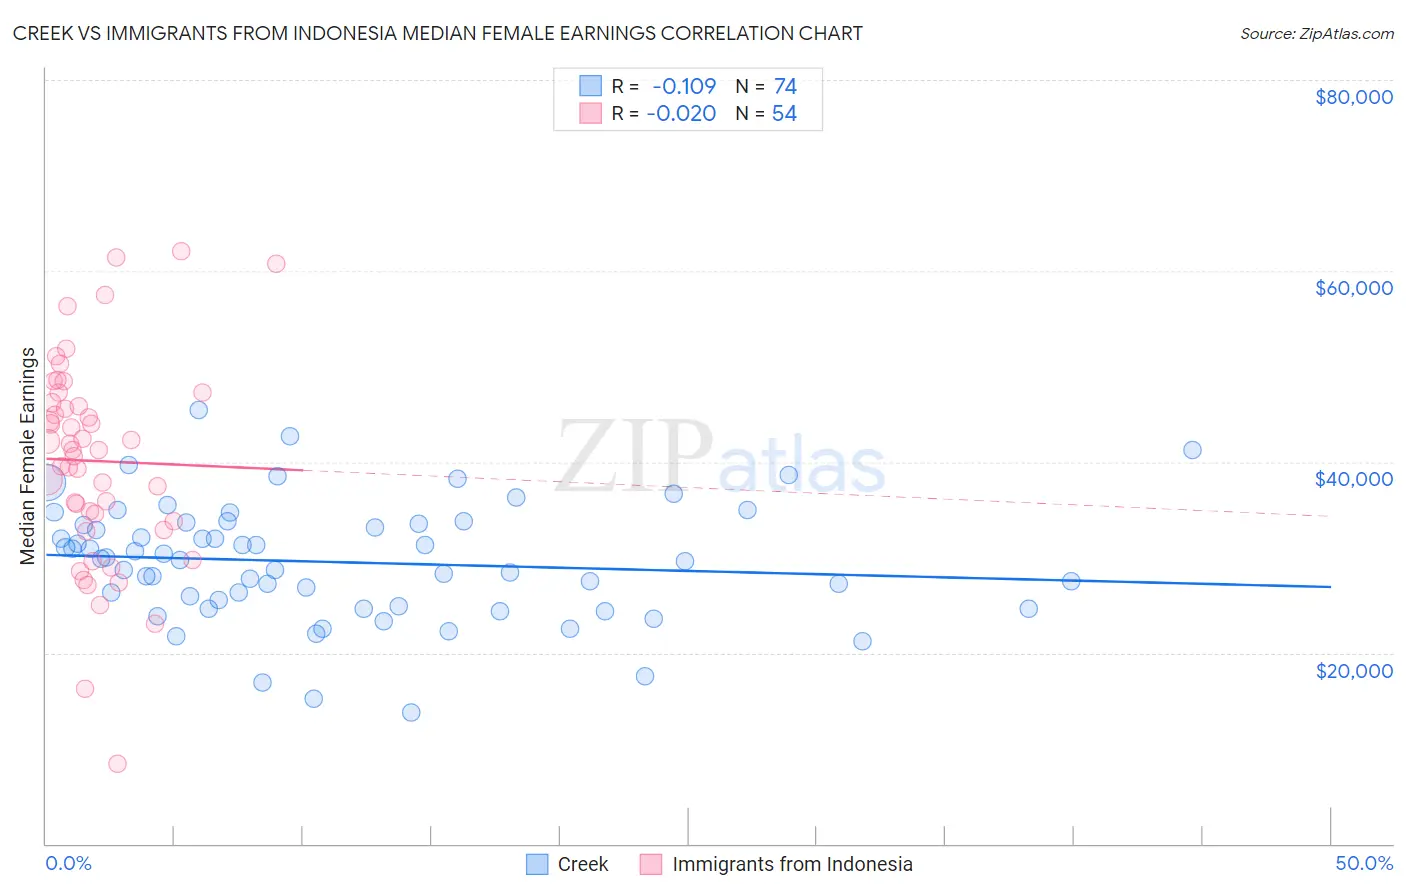
Creek vs Immigrants from Indonesia Median Female Earnings Correlation Chart
The statistical analysis conducted on geographies consisting of 178,409,483 people shows a poor negative correlation between the proportion of Creek and median female earnings in the United States with a correlation coefficient (R) of -0.109 and weighted average of $33,437. Similarly, the statistical analysis conducted on geographies consisting of 215,754,485 people shows no correlation between the proportion of Immigrants from Indonesia and median female earnings in the United States with a correlation coefficient (R) of -0.020 and weighted average of $43,412, a difference of 29.8%.
Median Female Earnings Correlation Summary
| Measurement | Creek | Immigrants from Indonesia |
| Minimum | $13,750 | $8,380 |
| Maximum | $45,402 | $62,036 |
| Range | $31,652 | $53,656 |
| Mean | $29,490 | $40,096 |
| Median | $29,783 | $41,238 |
| Interquartile 25% (IQ1) | $24,936 | $33,750 |
| Interquartile 75% (IQ3) | $33,500 | $46,213 |
| Interquartile Range (IQR) | $8,564 | $12,463 |
| Standard Deviation (Sample) | $6,205 | $10,783 |
| Standard Deviation (Population) | $6,162 | $10,682 |
Similar Demographics by Median Female Earnings
Demographics Similar to Creek by Median Female Earnings
In terms of median female earnings, the demographic groups most similar to Creek are Ottawa ($33,378, a difference of 0.18%), Yakama ($33,354, a difference of 0.25%), Immigrants from Cuba ($33,291, a difference of 0.44%), Spanish American Indian ($33,625, a difference of 0.56%), and Immigrants from Mexico ($33,236, a difference of 0.61%).
| Demographics | Rating | Rank | Median Female Earnings |
| Immigrants | Central America | 0.0 /100 | #328 | Tragic $33,953 |
| Hopi | 0.0 /100 | #329 | Tragic $33,932 |
| Menominee | 0.0 /100 | #330 | Tragic $33,894 |
| Natives/Alaskans | 0.0 /100 | #331 | Tragic $33,806 |
| Choctaw | 0.0 /100 | #332 | Tragic $33,775 |
| Mexicans | 0.0 /100 | #333 | Tragic $33,664 |
| Spanish American Indians | 0.0 /100 | #334 | Tragic $33,625 |
| Creek | 0.0 /100 | #335 | Tragic $33,437 |
| Ottawa | 0.0 /100 | #336 | Tragic $33,378 |
| Yakama | 0.0 /100 | #337 | Tragic $33,354 |
| Immigrants | Cuba | 0.0 /100 | #338 | Tragic $33,291 |
| Immigrants | Mexico | 0.0 /100 | #339 | Tragic $33,236 |
| Tohono O'odham | 0.0 /100 | #340 | Tragic $33,205 |
| Navajo | 0.0 /100 | #341 | Tragic $33,046 |
| Yup'ik | 0.0 /100 | #342 | Tragic $32,730 |
Demographics Similar to Immigrants from Indonesia by Median Female Earnings
In terms of median female earnings, the demographic groups most similar to Immigrants from Indonesia are Immigrants from Serbia ($43,385, a difference of 0.060%), Bolivian ($43,445, a difference of 0.070%), Immigrants from Uzbekistan ($43,363, a difference of 0.11%), Immigrants from Bolivia ($43,467, a difference of 0.13%), and Maltese ($43,357, a difference of 0.13%).
| Demographics | Rating | Rank | Median Female Earnings |
| Bhutanese | 100.0 /100 | #41 | Exceptional $43,648 |
| Immigrants | Denmark | 100.0 /100 | #42 | Exceptional $43,646 |
| Bulgarians | 100.0 /100 | #43 | Exceptional $43,638 |
| Immigrants | Czechoslovakia | 100.0 /100 | #44 | Exceptional $43,571 |
| Immigrants | Europe | 100.0 /100 | #45 | Exceptional $43,523 |
| Immigrants | Bolivia | 100.0 /100 | #46 | Exceptional $43,467 |
| Bolivians | 100.0 /100 | #47 | Exceptional $43,445 |
| Immigrants | Indonesia | 100.0 /100 | #48 | Exceptional $43,412 |
| Immigrants | Serbia | 100.0 /100 | #49 | Exceptional $43,385 |
| Immigrants | Uzbekistan | 100.0 /100 | #50 | Exceptional $43,363 |
| Maltese | 100.0 /100 | #51 | Exceptional $43,357 |
| Immigrants | Lithuania | 99.9 /100 | #52 | Exceptional $43,317 |
| Immigrants | Eastern Europe | 99.9 /100 | #53 | Exceptional $43,309 |
| Australians | 99.9 /100 | #54 | Exceptional $43,308 |
| Egyptians | 99.9 /100 | #55 | Exceptional $43,305 |