Comanche vs Immigrants from the Azores Median Family Income
COMPARE
Comanche
Immigrants from the Azores
Median Family Income
Median Family Income Comparison
Comanche
Immigrants from the Azores
$88,556
MEDIAN FAMILY INCOME
0.1/ 100
METRIC RATING
282nd/ 347
METRIC RANK
$95,402
MEDIAN FAMILY INCOME
2.4/ 100
METRIC RATING
228th/ 347
METRIC RANK
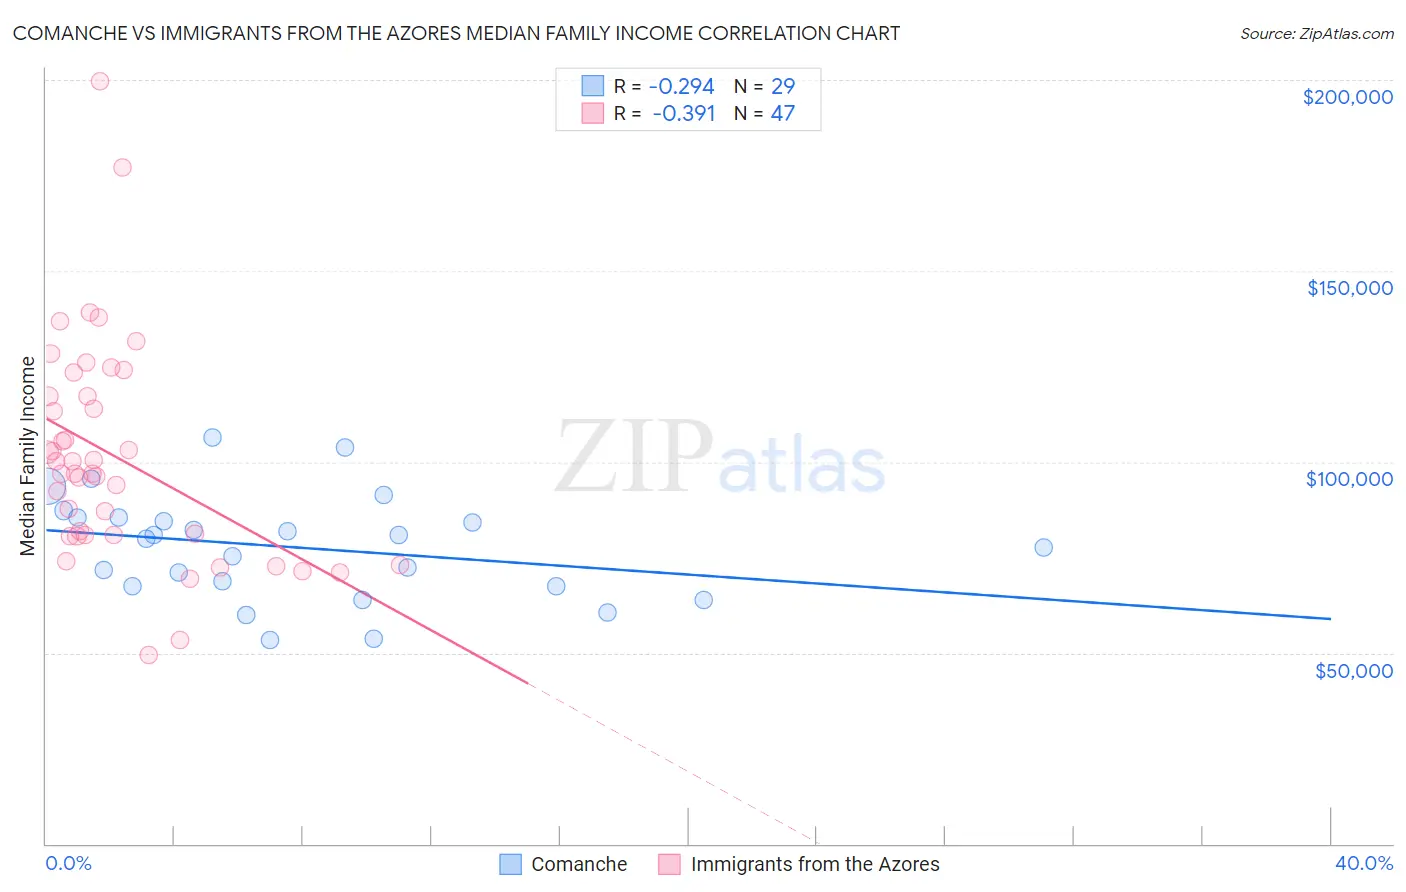
Comanche vs Immigrants from the Azores Median Family Income Correlation Chart
The statistical analysis conducted on geographies consisting of 109,751,078 people shows a weak negative correlation between the proportion of Comanche and median family income in the United States with a correlation coefficient (R) of -0.294 and weighted average of $88,556. Similarly, the statistical analysis conducted on geographies consisting of 46,255,736 people shows a mild negative correlation between the proportion of Immigrants from the Azores and median family income in the United States with a correlation coefficient (R) of -0.391 and weighted average of $95,402, a difference of 7.7%.
Median Family Income Correlation Summary
| Measurement | Comanche | Immigrants from the Azores |
| Minimum | $53,472 | $49,583 |
| Maximum | $106,375 | $199,510 |
| Range | $52,903 | $149,927 |
| Mean | $77,578 | $101,435 |
| Median | $79,900 | $96,945 |
| Interquartile 25% (IQ1) | $67,370 | $80,714 |
| Interquartile 75% (IQ3) | $85,455 | $117,338 |
| Interquartile Range (IQR) | $18,086 | $36,624 |
| Standard Deviation (Sample) | $13,620 | $28,827 |
| Standard Deviation (Population) | $13,383 | $28,519 |
Similar Demographics by Median Family Income
Demographics Similar to Comanche by Median Family Income
In terms of median family income, the demographic groups most similar to Comanche are Blackfeet ($88,717, a difference of 0.18%), Bangladeshi ($88,358, a difference of 0.22%), Indonesian ($88,301, a difference of 0.29%), Guatemalan ($88,295, a difference of 0.29%), and Immigrants from Nicaragua ($88,267, a difference of 0.33%).
| Demographics | Rating | Rank | Median Family Income |
| Immigrants | St. Vincent and the Grenadines | 0.2 /100 | #275 | Tragic $90,094 |
| Immigrants | Zaire | 0.1 /100 | #276 | Tragic $89,285 |
| Immigrants | Jamaica | 0.1 /100 | #277 | Tragic $89,268 |
| Immigrants | Grenada | 0.1 /100 | #278 | Tragic $89,249 |
| Immigrants | Belize | 0.1 /100 | #279 | Tragic $89,197 |
| British West Indians | 0.1 /100 | #280 | Tragic $88,987 |
| Blackfeet | 0.1 /100 | #281 | Tragic $88,717 |
| Comanche | 0.1 /100 | #282 | Tragic $88,556 |
| Bangladeshis | 0.1 /100 | #283 | Tragic $88,358 |
| Indonesians | 0.1 /100 | #284 | Tragic $88,301 |
| Guatemalans | 0.1 /100 | #285 | Tragic $88,295 |
| Immigrants | Nicaragua | 0.1 /100 | #286 | Tragic $88,267 |
| Potawatomi | 0.1 /100 | #287 | Tragic $88,265 |
| Cherokee | 0.1 /100 | #288 | Tragic $88,209 |
| Central American Indians | 0.1 /100 | #289 | Tragic $88,034 |
Demographics Similar to Immigrants from the Azores by Median Family Income
In terms of median family income, the demographic groups most similar to Immigrants from the Azores are Marshallese ($95,293, a difference of 0.11%), Alaska Native ($95,573, a difference of 0.18%), Malaysian ($95,230, a difference of 0.18%), Immigrants from Panama ($95,647, a difference of 0.26%), and Ecuadorian ($95,114, a difference of 0.30%).
| Demographics | Rating | Rank | Median Family Income |
| Immigrants | Ghana | 4.2 /100 | #221 | Tragic $96,544 |
| Immigrants | Nigeria | 4.0 /100 | #222 | Tragic $96,439 |
| Venezuelans | 3.7 /100 | #223 | Tragic $96,281 |
| Immigrants | Nonimmigrants | 3.6 /100 | #224 | Tragic $96,231 |
| Vietnamese | 3.4 /100 | #225 | Tragic $96,123 |
| Immigrants | Panama | 2.7 /100 | #226 | Tragic $95,647 |
| Alaska Natives | 2.6 /100 | #227 | Tragic $95,573 |
| Immigrants | Azores | 2.4 /100 | #228 | Tragic $95,402 |
| Marshallese | 2.2 /100 | #229 | Tragic $95,293 |
| Malaysians | 2.2 /100 | #230 | Tragic $95,230 |
| Ecuadorians | 2.1 /100 | #231 | Tragic $95,114 |
| Immigrants | Venezuela | 1.9 /100 | #232 | Tragic $94,904 |
| Immigrants | Bangladesh | 1.6 /100 | #233 | Tragic $94,665 |
| Immigrants | Western Africa | 1.6 /100 | #234 | Tragic $94,638 |
| Immigrants | Burma/Myanmar | 1.5 /100 | #235 | Tragic $94,472 |