Cherokee vs Immigrants from Latvia Median Family Income
COMPARE
Cherokee
Immigrants from Latvia
Median Family Income
Median Family Income Comparison
Cherokee
Immigrants from Latvia
$88,209
MEDIAN FAMILY INCOME
0.1/ 100
METRIC RATING
288th/ 347
METRIC RANK
$114,826
MEDIAN FAMILY INCOME
99.8/ 100
METRIC RATING
60th/ 347
METRIC RANK
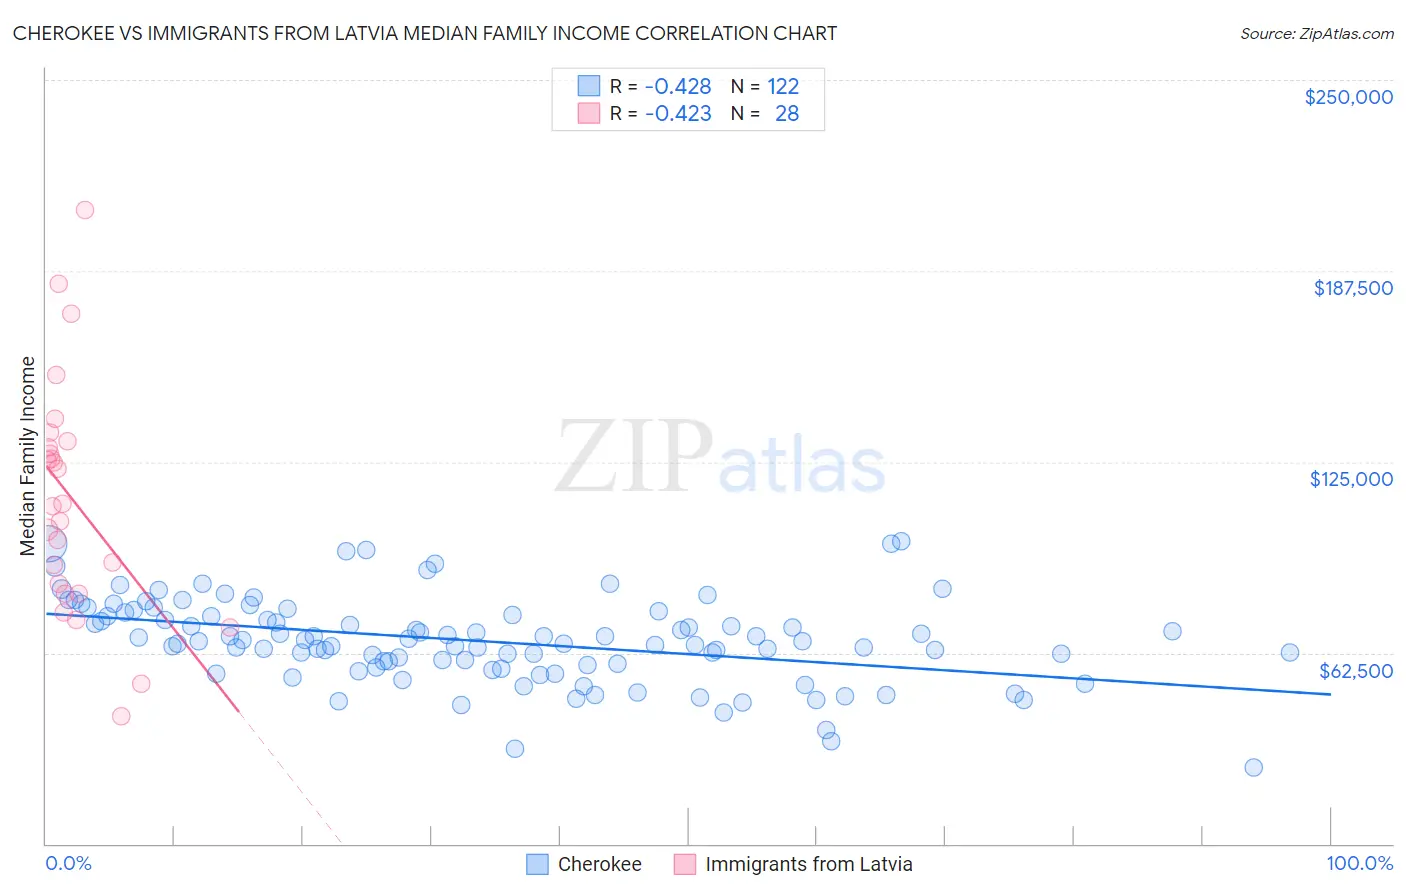
Cherokee vs Immigrants from Latvia Median Family Income Correlation Chart
The statistical analysis conducted on geographies consisting of 493,078,219 people shows a moderate negative correlation between the proportion of Cherokee and median family income in the United States with a correlation coefficient (R) of -0.428 and weighted average of $88,209. Similarly, the statistical analysis conducted on geographies consisting of 113,722,830 people shows a moderate negative correlation between the proportion of Immigrants from Latvia and median family income in the United States with a correlation coefficient (R) of -0.423 and weighted average of $114,826, a difference of 30.2%.
Median Family Income Correlation Summary
| Measurement | Cherokee | Immigrants from Latvia |
| Minimum | $25,000 | $41,641 |
| Maximum | $98,929 | $207,328 |
| Range | $73,929 | $165,687 |
| Mean | $66,366 | $112,663 |
| Median | $66,333 | $110,782 |
| Interquartile 25% (IQ1) | $58,393 | $83,546 |
| Interquartile 75% (IQ3) | $74,712 | $130,754 |
| Interquartile Range (IQR) | $16,319 | $47,207 |
| Standard Deviation (Sample) | $13,972 | $38,081 |
| Standard Deviation (Population) | $13,915 | $37,395 |
Similar Demographics by Median Family Income
Demographics Similar to Cherokee by Median Family Income
In terms of median family income, the demographic groups most similar to Cherokee are Potawatomi ($88,265, a difference of 0.060%), Immigrants from Nicaragua ($88,267, a difference of 0.070%), Indonesian ($88,301, a difference of 0.10%), Guatemalan ($88,295, a difference of 0.10%), and Bangladeshi ($88,358, a difference of 0.17%).
| Demographics | Rating | Rank | Median Family Income |
| Blackfeet | 0.1 /100 | #281 | Tragic $88,717 |
| Comanche | 0.1 /100 | #282 | Tragic $88,556 |
| Bangladeshis | 0.1 /100 | #283 | Tragic $88,358 |
| Indonesians | 0.1 /100 | #284 | Tragic $88,301 |
| Guatemalans | 0.1 /100 | #285 | Tragic $88,295 |
| Immigrants | Nicaragua | 0.1 /100 | #286 | Tragic $88,267 |
| Potawatomi | 0.1 /100 | #287 | Tragic $88,265 |
| Cherokee | 0.1 /100 | #288 | Tragic $88,209 |
| Central American Indians | 0.1 /100 | #289 | Tragic $88,034 |
| Shoshone | 0.1 /100 | #290 | Tragic $87,872 |
| Immigrants | Cabo Verde | 0.1 /100 | #291 | Tragic $87,830 |
| Africans | 0.1 /100 | #292 | Tragic $87,820 |
| Ute | 0.0 /100 | #293 | Tragic $87,596 |
| Fijians | 0.0 /100 | #294 | Tragic $87,387 |
| Yaqui | 0.0 /100 | #295 | Tragic $87,289 |
Demographics Similar to Immigrants from Latvia by Median Family Income
In terms of median family income, the demographic groups most similar to Immigrants from Latvia are Immigrants from Netherlands ($114,987, a difference of 0.14%), Immigrants from Belarus ($114,586, a difference of 0.21%), Mongolian ($114,553, a difference of 0.24%), Immigrants from Indonesia ($115,162, a difference of 0.29%), and Greek ($115,192, a difference of 0.32%).
| Demographics | Rating | Rank | Median Family Income |
| Immigrants | Norway | 99.9 /100 | #53 | Exceptional $115,847 |
| Immigrants | Europe | 99.9 /100 | #54 | Exceptional $115,523 |
| Lithuanians | 99.8 /100 | #55 | Exceptional $115,395 |
| New Zealanders | 99.8 /100 | #56 | Exceptional $115,230 |
| Greeks | 99.8 /100 | #57 | Exceptional $115,192 |
| Immigrants | Indonesia | 99.8 /100 | #58 | Exceptional $115,162 |
| Immigrants | Netherlands | 99.8 /100 | #59 | Exceptional $114,987 |
| Immigrants | Latvia | 99.8 /100 | #60 | Exceptional $114,826 |
| Immigrants | Belarus | 99.8 /100 | #61 | Exceptional $114,586 |
| Mongolians | 99.8 /100 | #62 | Exceptional $114,553 |
| Immigrants | Pakistan | 99.8 /100 | #63 | Exceptional $114,406 |
| Immigrants | Scotland | 99.7 /100 | #64 | Exceptional $114,392 |
| Egyptians | 99.7 /100 | #65 | Exceptional $114,119 |
| Paraguayans | 99.7 /100 | #66 | Exceptional $114,016 |
| Immigrants | Spain | 99.7 /100 | #67 | Exceptional $113,815 |