Cherokee vs Cypriot Median Family Income
COMPARE
Cherokee
Cypriot
Median Family Income
Median Family Income Comparison
Cherokee
Cypriots
$88,209
MEDIAN FAMILY INCOME
0.1/ 100
METRIC RATING
288th/ 347
METRIC RANK
$127,064
MEDIAN FAMILY INCOME
100.0/ 100
METRIC RATING
12th/ 347
METRIC RANK
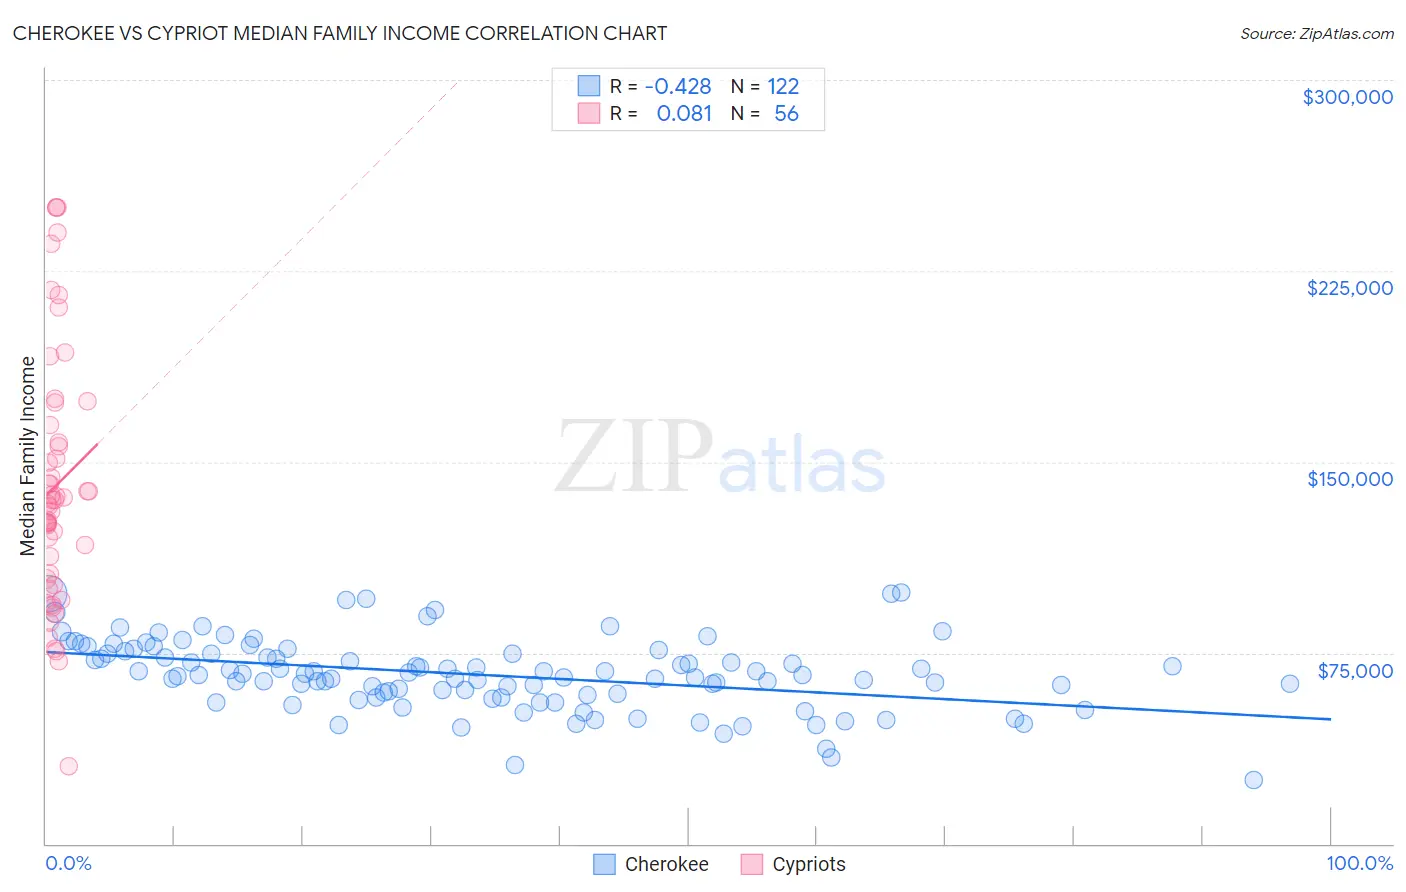
Cherokee vs Cypriot Median Family Income Correlation Chart
The statistical analysis conducted on geographies consisting of 493,078,219 people shows a moderate negative correlation between the proportion of Cherokee and median family income in the United States with a correlation coefficient (R) of -0.428 and weighted average of $88,209. Similarly, the statistical analysis conducted on geographies consisting of 61,838,668 people shows a slight positive correlation between the proportion of Cypriots and median family income in the United States with a correlation coefficient (R) of 0.081 and weighted average of $127,064, a difference of 44.1%.
Median Family Income Correlation Summary
| Measurement | Cherokee | Cypriot |
| Minimum | $25,000 | $30,441 |
| Maximum | $98,929 | $250,001 |
| Range | $73,929 | $219,560 |
| Mean | $66,366 | $140,451 |
| Median | $66,333 | $134,246 |
| Interquartile 25% (IQ1) | $58,393 | $104,944 |
| Interquartile 75% (IQ3) | $74,712 | $161,047 |
| Interquartile Range (IQR) | $16,319 | $56,103 |
| Standard Deviation (Sample) | $13,972 | $49,252 |
| Standard Deviation (Population) | $13,915 | $48,811 |
Similar Demographics by Median Family Income
Demographics Similar to Cherokee by Median Family Income
In terms of median family income, the demographic groups most similar to Cherokee are Potawatomi ($88,265, a difference of 0.060%), Immigrants from Nicaragua ($88,267, a difference of 0.070%), Indonesian ($88,301, a difference of 0.10%), Guatemalan ($88,295, a difference of 0.10%), and Bangladeshi ($88,358, a difference of 0.17%).
| Demographics | Rating | Rank | Median Family Income |
| Blackfeet | 0.1 /100 | #281 | Tragic $88,717 |
| Comanche | 0.1 /100 | #282 | Tragic $88,556 |
| Bangladeshis | 0.1 /100 | #283 | Tragic $88,358 |
| Indonesians | 0.1 /100 | #284 | Tragic $88,301 |
| Guatemalans | 0.1 /100 | #285 | Tragic $88,295 |
| Immigrants | Nicaragua | 0.1 /100 | #286 | Tragic $88,267 |
| Potawatomi | 0.1 /100 | #287 | Tragic $88,265 |
| Cherokee | 0.1 /100 | #288 | Tragic $88,209 |
| Central American Indians | 0.1 /100 | #289 | Tragic $88,034 |
| Shoshone | 0.1 /100 | #290 | Tragic $87,872 |
| Immigrants | Cabo Verde | 0.1 /100 | #291 | Tragic $87,830 |
| Africans | 0.1 /100 | #292 | Tragic $87,820 |
| Ute | 0.0 /100 | #293 | Tragic $87,596 |
| Fijians | 0.0 /100 | #294 | Tragic $87,387 |
| Yaqui | 0.0 /100 | #295 | Tragic $87,289 |
Demographics Similar to Cypriots by Median Family Income
In terms of median family income, the demographic groups most similar to Cypriots are Immigrants from Israel ($127,430, a difference of 0.29%), Immigrants from Australia ($126,620, a difference of 0.35%), Immigrants from Ireland ($127,584, a difference of 0.41%), Immigrants from South Central Asia ($125,956, a difference of 0.88%), and Eastern European ($125,546, a difference of 1.2%).
| Demographics | Rating | Rank | Median Family Income |
| Iranians | 100.0 /100 | #5 | Exceptional $133,839 |
| Thais | 100.0 /100 | #6 | Exceptional $131,281 |
| Immigrants | Hong Kong | 100.0 /100 | #7 | Exceptional $131,067 |
| Immigrants | Iran | 100.0 /100 | #8 | Exceptional $130,894 |
| Okinawans | 100.0 /100 | #9 | Exceptional $129,979 |
| Immigrants | Ireland | 100.0 /100 | #10 | Exceptional $127,584 |
| Immigrants | Israel | 100.0 /100 | #11 | Exceptional $127,430 |
| Cypriots | 100.0 /100 | #12 | Exceptional $127,064 |
| Immigrants | Australia | 100.0 /100 | #13 | Exceptional $126,620 |
| Immigrants | South Central Asia | 100.0 /100 | #14 | Exceptional $125,956 |
| Eastern Europeans | 100.0 /100 | #15 | Exceptional $125,546 |
| Immigrants | China | 100.0 /100 | #16 | Exceptional $125,540 |
| Indians (Asian) | 100.0 /100 | #17 | Exceptional $125,312 |
| Immigrants | Eastern Asia | 100.0 /100 | #18 | Exceptional $125,150 |
| Immigrants | Belgium | 100.0 /100 | #19 | Exceptional $123,831 |