Central American vs Puerto Rican Median Household Income
COMPARE
Central American
Puerto Rican
Median Household Income
Median Household Income Comparison
Central Americans
Puerto Ricans
$78,803
MEDIAN HOUSEHOLD INCOME
1.7/ 100
METRIC RATING
246th/ 347
METRIC RANK
$59,197
MEDIAN HOUSEHOLD INCOME
0.0/ 100
METRIC RATING
345th/ 347
METRIC RANK
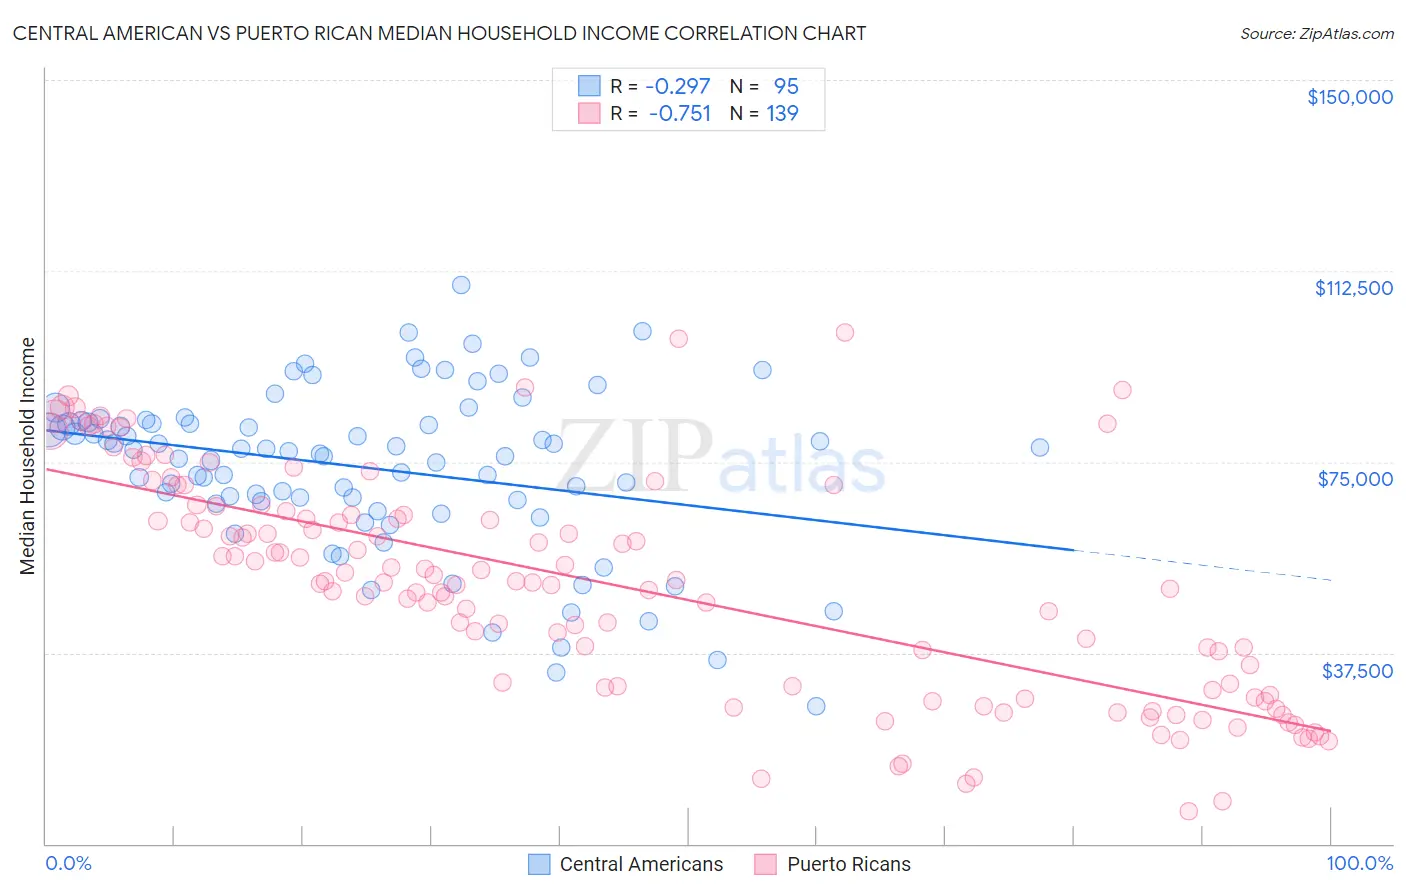
Central American vs Puerto Rican Median Household Income Correlation Chart
The statistical analysis conducted on geographies consisting of 503,881,037 people shows a weak negative correlation between the proportion of Central Americans and median household income in the United States with a correlation coefficient (R) of -0.297 and weighted average of $78,803. Similarly, the statistical analysis conducted on geographies consisting of 527,459,436 people shows a strong negative correlation between the proportion of Puerto Ricans and median household income in the United States with a correlation coefficient (R) of -0.751 and weighted average of $59,197, a difference of 33.1%.
Median Household Income Correlation Summary
| Measurement | Central American | Puerto Rican |
| Minimum | $26,979 | $6,449 |
| Maximum | $109,623 | $100,425 |
| Range | $82,644 | $93,976 |
| Mean | $73,852 | $50,898 |
| Median | $77,087 | $51,527 |
| Interquartile 25% (IQ1) | $67,287 | $30,679 |
| Interquartile 75% (IQ3) | $82,754 | $65,376 |
| Interquartile Range (IQR) | $15,467 | $34,697 |
| Standard Deviation (Sample) | $15,929 | $21,767 |
| Standard Deviation (Population) | $15,845 | $21,689 |
Similar Demographics by Median Household Income
Demographics Similar to Central Americans by Median Household Income
In terms of median household income, the demographic groups most similar to Central Americans are Inupiat ($78,841, a difference of 0.050%), Immigrants from Burma/Myanmar ($78,682, a difference of 0.15%), Marshallese ($78,930, a difference of 0.16%), Immigrants from Barbados ($78,989, a difference of 0.24%), and Sudanese ($78,529, a difference of 0.35%).
| Demographics | Rating | Rank | Median Household Income |
| Alaska Natives | 2.7 /100 | #239 | Tragic $79,509 |
| Immigrants | Western Africa | 2.7 /100 | #240 | Tragic $79,490 |
| Immigrants | Nonimmigrants | 2.6 /100 | #241 | Tragic $79,429 |
| Immigrants | Sudan | 2.1 /100 | #242 | Tragic $79,103 |
| Immigrants | Barbados | 1.9 /100 | #243 | Tragic $78,989 |
| Marshallese | 1.9 /100 | #244 | Tragic $78,930 |
| Inupiat | 1.8 /100 | #245 | Tragic $78,841 |
| Central Americans | 1.7 /100 | #246 | Tragic $78,803 |
| Immigrants | Burma/Myanmar | 1.6 /100 | #247 | Tragic $78,682 |
| Sudanese | 1.5 /100 | #248 | Tragic $78,529 |
| West Indians | 1.4 /100 | #249 | Tragic $78,455 |
| Immigrants | Laos | 1.3 /100 | #250 | Tragic $78,327 |
| Mexican American Indians | 1.2 /100 | #251 | Tragic $78,166 |
| Immigrants | West Indies | 1.0 /100 | #252 | Tragic $77,956 |
| Immigrants | St. Vincent and the Grenadines | 0.9 /100 | #253 | Tragic $77,690 |
Demographics Similar to Puerto Ricans by Median Household Income
In terms of median household income, the demographic groups most similar to Puerto Ricans are Navajo ($59,159, a difference of 0.060%), Tohono O'odham ($61,663, a difference of 4.2%), Houma ($62,575, a difference of 5.7%), Pima ($63,262, a difference of 6.9%), and Crow ($63,681, a difference of 7.6%).
| Demographics | Rating | Rank | Median Household Income |
| Creek | 0.0 /100 | #333 | Tragic $67,715 |
| Blacks/African Americans | 0.0 /100 | #334 | Tragic $67,573 |
| Cheyenne | 0.0 /100 | #335 | Tragic $66,974 |
| Immigrants | Congo | 0.0 /100 | #336 | Tragic $66,768 |
| Kiowa | 0.0 /100 | #337 | Tragic $65,914 |
| Immigrants | Yemen | 0.0 /100 | #338 | Tragic $65,194 |
| Hopi | 0.0 /100 | #339 | Tragic $65,043 |
| Pueblo | 0.0 /100 | #340 | Tragic $64,692 |
| Crow | 0.0 /100 | #341 | Tragic $63,681 |
| Pima | 0.0 /100 | #342 | Tragic $63,262 |
| Houma | 0.0 /100 | #343 | Tragic $62,575 |
| Tohono O'odham | 0.0 /100 | #344 | Tragic $61,663 |
| Puerto Ricans | 0.0 /100 | #345 | Tragic $59,197 |
| Navajo | 0.0 /100 | #346 | Tragic $59,159 |
| Lumbee | 0.0 /100 | #347 | Tragic $54,644 |