Celtic vs Immigrants from Japan Householder Income Over 65 years

COMPARE

Celtic
Race
Ancestry
AfghanAfricanAlaska NativeAlaskan AthabascanAlbanianAleutAlsatianAmericanApacheArabArapahoArgentineanArmenianAssyrian/Chaldean/SyriacAustralianAustrianBahamianBangladeshiBarbadianBasqueBelgianBelizeanBermudanBhutaneseBlackfeetBolivianBrazilianBritishBritish West IndianBulgarianBurmeseCajunCambodianCanadianCape VerdeanCarpatho RusynCelticCentral AmericanCentral American IndianCherokeeCheyenneChickasawChileanChineseChippewaChoctawColombianColvilleComancheCosta RicanCreeCreekCroatianCrowCubanCypriotCzechCzechoslovakianDanishDelawareDominicanDutchDutch West IndianEastern EuropeanEcuadorianEgyptianEnglishEstonianEthiopianEuropeanFijianFilipinoFinnishFrenchFrench American IndianFrench CanadianGermanGerman RussianGhanaianGreekGuamanian/ChamorroGuatemalanGuyaneseHaitianHmongHonduranHopiHoumaHungarianIcelanderIndian (Asian)IndonesianInupiatIranianIraqiIrishIroquoisIsraeliItalianJamaicanJapaneseJordanianKenyanKiowaKoreanLaotianLatvianLebaneseLiberianLithuanianLumbeeLuxembourgerMacedonianMalaysianMalteseMarshalleseMenomineeMexicanMexican American IndianMongolianMoroccanNative HawaiianNavajoNepaleseNew ZealanderNicaraguanNigerianNorthern EuropeanNorwegianOkinawanOsageOttawaPaiutePakistaniPalestinianPanamanianParaguayanPennsylvania GermanPeruvianPimaPolishPortuguesePotawatomiPuebloPuerto RicanPuget Sound SalishRomanianRussianSalvadoranSamoanScandinavianScotch-IrishScottishSeminoleSenegaleseSerbianShoshoneSierra LeoneanSiouxSlavicSlovakSloveneSomaliSouth AfricanSouth AmericanSouth American IndianSoviet UnionSpaniardSpanishSpanish AmericanSpanish American IndianSri LankanSubsaharan AfricanSudaneseSwedishSwissSyrianTaiwaneseThaiTlingit-HaidaTohono O'OdhamTonganTrinidadian and TobagonianTsimshianTurkishU.S. Virgin IslanderUgandanUkrainianUruguayanUteVenezuelanVietnameseWelshWest IndianYakamaYaquiYugoslavianYumanYup'ikZimbabwean
Immigration
NonimmigrantsImmigrantsAfghanistanAfricaAlbaniaArgentinaArmeniaAsiaAustraliaAustriaBahamasBangladeshBarbadosBelarusBelgiumBelizeBoliviaBosnia and HerzegovinaBrazilBulgariaBurma/MyanmarCabo VerdeCambodiaCameroonCanadaCaribbeanCentral AmericaChileChinaColombiaCongoCosta RicaCroatiaCubaCzechoslovakiaDenmarkDominicaDominican RepublicEastern AfricaEastern AsiaEastern EuropeEcuadorEgyptEl SalvadorEnglandEritreaEthiopiaEuropeFijiFranceGermanyGhanaGreeceGrenadaGuatemalaGuyanaHaitiHondurasHong KongHungaryIndiaIndonesiaIranIraqIrelandIsraelItalyJamaicaJordanKazakhstanKenyaKoreaKuwaitLaosLatin AmericaLatviaLebanonLiberiaLithuaniaMalaysiaMexicoMicronesiaMiddle AfricaMoldovaMoroccoNepalNetherlandsNicaraguaNigeriaNorth AmericaNorth MacedoniaNorthern AfricaNorthern EuropeNorwayOceaniaPakistanPanamaPeruPhilippinesPolandPortugalRomaniaRussiaSaudi ArabiaScotlandSenegalSerbiaSierra LeoneSingaporeSomaliaSouth AfricaSouth AmericaSouth Central AsiaSouth Eastern AsiaSouthern EuropeSpainSri LankaSt. Vincent and the GrenadinesSudanSwedenSwitzerlandSyriaTaiwanThailandTrinidad and TobagoTurkeyUgandaUkraineUruguayUzbekistanVenezuelaVietnamWest IndiesWestern AfricaWestern AsiaWestern EuropeYemenZaireZimbabweAzores
Immigrants from Japan
Race
Ancestry
AfghanAfricanAlaska NativeAlaskan AthabascanAlbanianAleutAlsatianAmericanApacheArabArapahoArgentineanArmenianAssyrian/Chaldean/SyriacAustralianAustrianBahamianBangladeshiBarbadianBasqueBelgianBelizeanBermudanBhutaneseBlackfeetBolivianBrazilianBritishBritish West IndianBulgarianBurmeseCajunCambodianCanadianCape VerdeanCarpatho RusynCentral AmericanCentral American IndianCherokeeCheyenneChickasawChileanChineseChippewaChoctawColombianColvilleComancheCosta RicanCreeCreekCroatianCrowCubanCypriotCzechCzechoslovakianDanishDelawareDominicanDutchDutch West IndianEastern EuropeanEcuadorianEgyptianEnglishEstonianEthiopianEuropeanFijianFilipinoFinnishFrenchFrench American IndianFrench CanadianGermanGerman RussianGhanaianGreekGuamanian/ChamorroGuatemalanGuyaneseHaitianHmongHonduranHopiHoumaHungarianIcelanderIndian (Asian)IndonesianInupiatIranianIraqiIrishIroquoisIsraeliItalianJamaicanJapaneseJordanianKenyanKiowaKoreanLaotianLatvianLebaneseLiberianLithuanianLumbeeLuxembourgerMacedonianMalaysianMalteseMarshalleseMenomineeMexicanMexican American IndianMongolianMoroccanNative HawaiianNavajoNepaleseNew ZealanderNicaraguanNigerianNorthern EuropeanNorwegianOkinawanOsageOttawaPaiutePakistaniPalestinianPanamanianParaguayanPennsylvania GermanPeruvianPimaPolishPortuguesePotawatomiPuebloPuerto RicanPuget Sound SalishRomanianRussianSalvadoranSamoanScandinavianScotch-IrishScottishSeminoleSenegaleseSerbianShoshoneSierra LeoneanSiouxSlavicSlovakSloveneSomaliSouth AfricanSouth AmericanSouth American IndianSoviet UnionSpaniardSpanishSpanish AmericanSpanish American IndianSri LankanSubsaharan AfricanSudaneseSwedishSwissSyrianTaiwaneseThaiTlingit-HaidaTohono O'OdhamTonganTrinidadian and TobagonianTsimshianTurkishU.S. Virgin IslanderUgandanUkrainianUruguayanUteVenezuelanVietnameseWelshWest IndianYakamaYaquiYugoslavianYumanYup'ikZimbabwean
Immigration
NonimmigrantsImmigrantsAfghanistanAfricaAlbaniaArgentinaArmeniaAsiaAustraliaAustriaBahamasBangladeshBarbadosBelarusBelgiumBelizeBoliviaBosnia and HerzegovinaBrazilBulgariaBurma/MyanmarCabo VerdeCambodiaCameroonCanadaCaribbeanCentral AmericaChileChinaColombiaCongoCosta RicaCroatiaCubaCzechoslovakiaDenmarkDominicaDominican RepublicEastern AfricaEastern AsiaEastern EuropeEcuadorEgyptEl SalvadorEnglandEritreaEthiopiaEuropeFijiFranceGermanyGhanaGreeceGrenadaGuatemalaGuyanaHaitiHondurasHong KongHungaryIndiaIndonesiaIranIraqIrelandIsraelItalyJamaicaJapanJordanKazakhstanKenyaKoreaKuwaitLaosLatin AmericaLatviaLebanonLiberiaLithuaniaMalaysiaMexicoMicronesiaMiddle AfricaMoldovaMoroccoNepalNetherlandsNicaraguaNigeriaNorth AmericaNorth MacedoniaNorthern AfricaNorthern EuropeNorwayOceaniaPakistanPanamaPeruPhilippinesPolandPortugalRomaniaRussiaSaudi ArabiaScotlandSenegalSerbiaSierra LeoneSingaporeSomaliaSouth AfricaSouth AmericaSouth Central AsiaSouth Eastern AsiaSouthern EuropeSpainSri LankaSt. Vincent and the GrenadinesSudanSwedenSwitzerlandSyriaTaiwanThailandTrinidad and TobagoTurkeyUgandaUkraineUruguayUzbekistanVenezuelaVietnamWest IndiesWestern AfricaWestern AsiaWestern EuropeYemenZaireZimbabweAzores
Householder Income Over 65 years
Income
Poverty
Unemployment
Labor Participation
Family Structure
Vehicle Availability
Education Level
Disability

Householder Income Over 65 years Comparison

Celtics

Immigrants from Japan

Average
Exceptional
$60,608
HOUSEHOLDER INCOME OVER 65 YEARS
40.7/ 100
METRIC RATING
181st/ 347
METRIC RANK
$69,774
HOUSEHOLDER INCOME OVER 65 YEARS
100.0/ 100
METRIC RATING
23rd/ 347
METRIC RANK

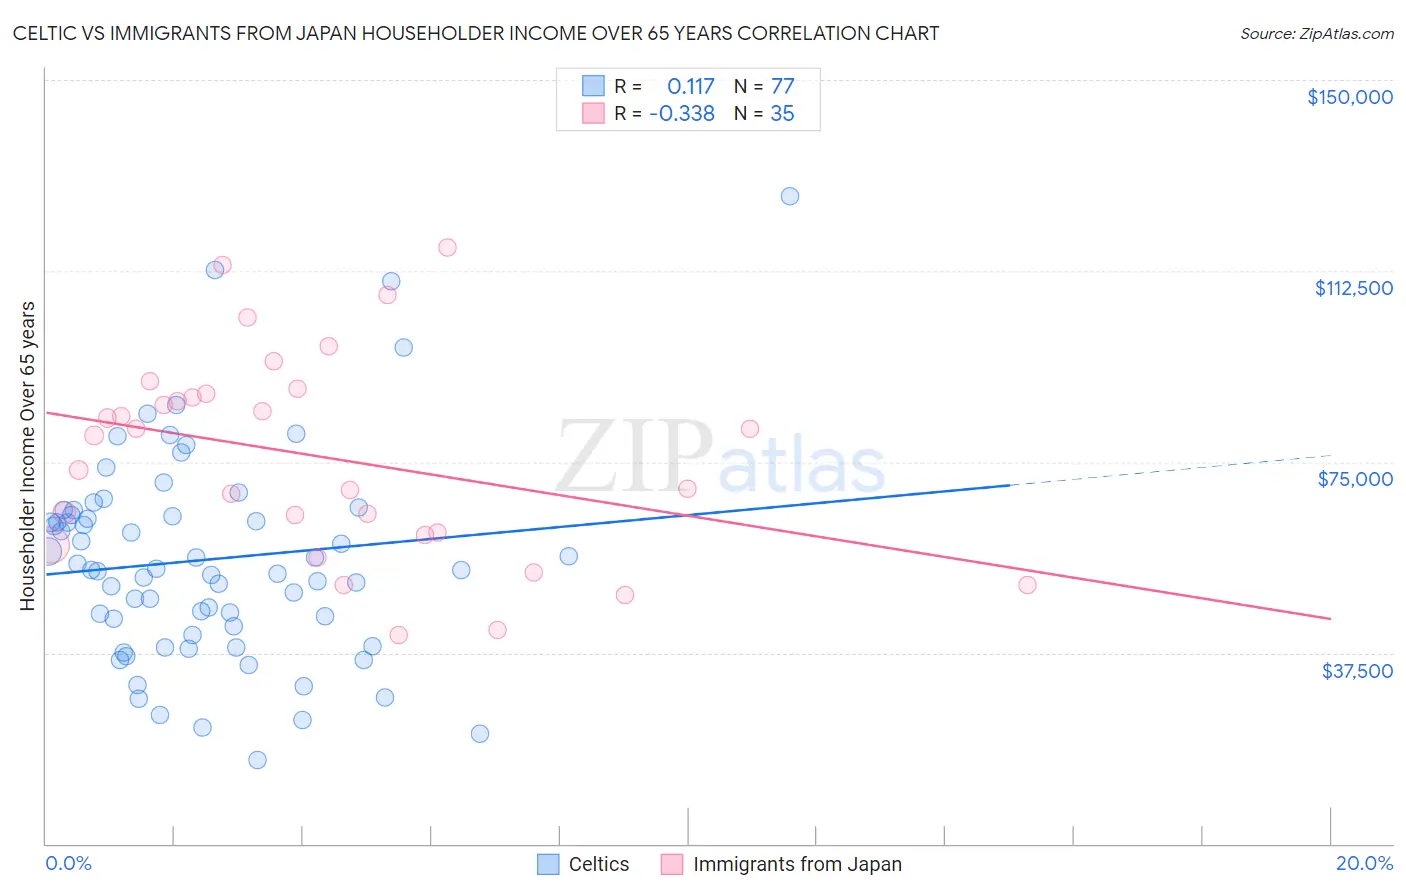
Celtic vs Immigrants from Japan Householder Income Over 65 years Correlation Chart

The statistical analysis conducted on geographies consisting of 168,665,390 people shows a poor positive correlation between the proportion of Celtics and household income with householder over the age of 65 in the United States with a correlation coefficient (R) of 0.117 and weighted average of $60,608. Similarly, the statistical analysis conducted on geographies consisting of 339,138,699 people shows a mild negative correlation between the proportion of Immigrants from Japan and household income with householder over the age of 65 in the United States with a correlation coefficient (R) of -0.338 and weighted average of $69,774, a difference of 15.1%.
Celtic vs Immigrants from Japan Householder Income Over 65 years

Householder Income Over 65 years Correlation Summary

MeasurementCelticImmigrants from Japan
Minimum$16,365$41,071
Maximum$127,250$117,174
Range$110,885$76,103
Mean$55,793$75,956
Median$53,750$80,209
Interquartile 25% (IQ1)$41,861$60,655
Interquartile 75% (IQ3)$65,041$88,495
Interquartile Range (IQR)$23,179$27,840
Standard Deviation (Sample)$20,641$19,879
Standard Deviation (Population)$20,507$19,593

Similar Demographics by Householder Income Over 65 years

Demographics Similar to Celtics by Householder Income Over 65 years

In terms of householder income over 65 years, the demographic groups most similar to Celtics are Czechoslovakian ($60,581, a difference of 0.040%), Immigrants from Morocco ($60,647, a difference of 0.060%), Welsh ($60,666, a difference of 0.10%), Kenyan ($60,514, a difference of 0.15%), and Yup'ik ($60,727, a difference of 0.20%).
DemographicsRating | RankHouseholder Income Over 65 years
Luxembourgers
50.0
/100
|
#174
Average
$60,967
Spaniards
47.3
/100
|
#175
Average
$60,866
Spanish
45.5
/100
|
#176
Average
$60,795
Alaska Natives
44.3
/100
|
#177
Average
$60,748
Yup'ik
43.7
/100
|
#178
Average
$60,727
Welsh
42.2
/100
|
#179
Average
$60,666
Immigrants | Morocco
41.7
/100
|
#180
Average
$60,647
Celtics
40.7
/100
|
#181
Average
$60,608
Czechoslovakians
40.0
/100
|
#182
Average
$60,581
Kenyans
38.4
/100
|
#183
Fair
$60,514
Iraqis
37.2
/100
|
#184
Fair
$60,466
Albanians
32.0
/100
|
#185
Fair
$60,249
Slovenes
31.8
/100
|
#186
Fair
$60,241
Immigrants | Thailand
31.3
/100
|
#187
Fair
$60,217
Immigrants | Eritrea
28.6
/100
|
#188
Fair
$60,096

Demographics Similar to Immigrants from Japan by Householder Income Over 65 years

In terms of householder income over 65 years, the demographic groups most similar to Immigrants from Japan are Immigrants from Sweden ($69,722, a difference of 0.070%), Immigrants from Belgium ($69,703, a difference of 0.10%), Immigrants from Israel ($69,857, a difference of 0.12%), Immigrants from Eastern Asia ($69,872, a difference of 0.14%), and Immigrants from South Central Asia ($70,103, a difference of 0.47%).
DemographicsRating | RankHouseholder Income Over 65 years
Okinawans
100.0
/100
|
#16
Exceptional
$70,846
Immigrants | Korea
100.0
/100
|
#17
Exceptional
$70,696
Eastern Europeans
100.0
/100
|
#18
Exceptional
$70,470
Indians (Asian)
100.0
/100
|
#19
Exceptional
$70,238
Immigrants | South Central Asia
100.0
/100
|
#20
Exceptional
$70,103
Immigrants | Eastern Asia
100.0
/100
|
#21
Exceptional
$69,872
Immigrants | Israel
100.0
/100
|
#22
Exceptional
$69,857
Immigrants | Japan
100.0
/100
|
#23
Exceptional
$69,774
Immigrants | Sweden
100.0
/100
|
#24
Exceptional
$69,722
Immigrants | Belgium
100.0
/100
|
#25
Exceptional
$69,703
Immigrants | Sri Lanka
100.0
/100
|
#26
Exceptional
$69,426
Immigrants | Switzerland
100.0
/100
|
#27
Exceptional
$69,343
Immigrants | China
100.0
/100
|
#28
Exceptional
$69,174
Immigrants | Australia
100.0
/100
|
#29
Exceptional
$69,164
Immigrants | Northern Europe
100.0
/100
|
#30
Exceptional
$69,003