Belgian vs Panamanian Median Household Income
COMPARE
Belgian
Panamanian
Median Household Income
Median Household Income Comparison
Belgians
Panamanians
$84,008
MEDIAN HOUSEHOLD INCOME
33.2/ 100
METRIC RATING
187th/ 347
METRIC RANK
$82,272
MEDIAN HOUSEHOLD INCOME
14.0/ 100
METRIC RATING
214th/ 347
METRIC RANK
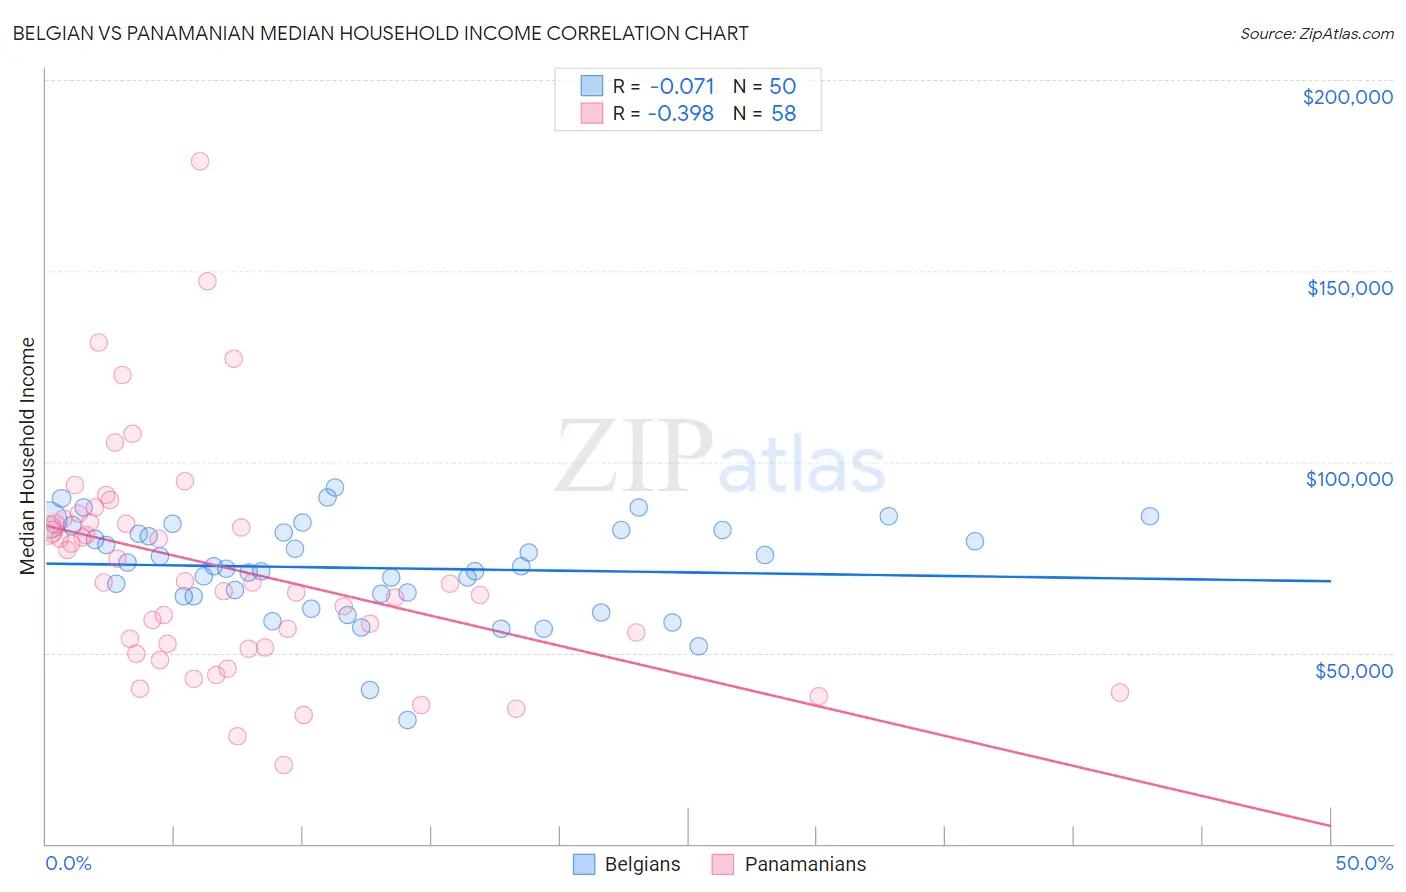
Belgian vs Panamanian Median Household Income Correlation Chart
The statistical analysis conducted on geographies consisting of 355,773,334 people shows a slight negative correlation between the proportion of Belgians and median household income in the United States with a correlation coefficient (R) of -0.071 and weighted average of $84,008. Similarly, the statistical analysis conducted on geographies consisting of 281,034,556 people shows a mild negative correlation between the proportion of Panamanians and median household income in the United States with a correlation coefficient (R) of -0.398 and weighted average of $82,272, a difference of 2.1%.
Median Household Income Correlation Summary
| Measurement | Belgian | Panamanian |
| Minimum | $32,500 | $20,556 |
| Maximum | $93,194 | $178,834 |
| Range | $60,694 | $158,278 |
| Mean | $72,191 | $72,362 |
| Median | $72,683 | $68,346 |
| Interquartile 25% (IQ1) | $64,851 | $51,530 |
| Interquartile 75% (IQ3) | $82,059 | $83,972 |
| Interquartile Range (IQR) | $17,208 | $32,442 |
| Standard Deviation (Sample) | $12,788 | $29,634 |
| Standard Deviation (Population) | $12,659 | $29,377 |
Similar Demographics by Median Household Income
Demographics Similar to Belgians by Median Household Income
In terms of median household income, the demographic groups most similar to Belgians are Puget Sound Salish ($84,011, a difference of 0.0%), Tlingit-Haida ($83,968, a difference of 0.050%), Kenyan ($84,085, a difference of 0.090%), Immigrants from Colombia ($83,902, a difference of 0.13%), and Slovak ($83,798, a difference of 0.25%).
| Demographics | Rating | Rank | Median Household Income |
| Immigrants | Portugal | 44.2 /100 | #180 | Average $84,740 |
| Hawaiians | 44.1 /100 | #181 | Average $84,729 |
| Uruguayans | 43.5 /100 | #182 | Average $84,691 |
| Spaniards | 42.7 /100 | #183 | Average $84,644 |
| Immigrants | Eastern Africa | 37.4 /100 | #184 | Fair $84,299 |
| Kenyans | 34.2 /100 | #185 | Fair $84,085 |
| Puget Sound Salish | 33.2 /100 | #186 | Fair $84,011 |
| Belgians | 33.2 /100 | #187 | Fair $84,008 |
| Tlingit-Haida | 32.6 /100 | #188 | Fair $83,968 |
| Immigrants | Colombia | 31.7 /100 | #189 | Fair $83,902 |
| Slovaks | 30.2 /100 | #190 | Fair $83,798 |
| Iraqis | 29.6 /100 | #191 | Fair $83,753 |
| Welsh | 28.0 /100 | #192 | Fair $83,628 |
| Finns | 27.7 /100 | #193 | Fair $83,607 |
| Ghanaians | 27.4 /100 | #194 | Fair $83,582 |
Demographics Similar to Panamanians by Median Household Income
In terms of median household income, the demographic groups most similar to Panamanians are Vietnamese ($82,248, a difference of 0.030%), Yugoslavian ($82,186, a difference of 0.10%), Nepalese ($82,410, a difference of 0.17%), Venezuelan ($82,432, a difference of 0.20%), and Salvadoran ($82,449, a difference of 0.22%).
| Demographics | Rating | Rank | Median Household Income |
| Dutch | 20.3 /100 | #207 | Fair $82,971 |
| French Canadians | 18.7 /100 | #208 | Poor $82,810 |
| Immigrants | Iraq | 16.7 /100 | #209 | Poor $82,594 |
| Immigrants | Uruguay | 16.4 /100 | #210 | Poor $82,560 |
| Salvadorans | 15.4 /100 | #211 | Poor $82,449 |
| Venezuelans | 15.3 /100 | #212 | Poor $82,432 |
| Nepalese | 15.1 /100 | #213 | Poor $82,410 |
| Panamanians | 14.0 /100 | #214 | Poor $82,272 |
| Vietnamese | 13.8 /100 | #215 | Poor $82,248 |
| Yugoslavians | 13.3 /100 | #216 | Poor $82,186 |
| Ecuadorians | 12.5 /100 | #217 | Poor $82,070 |
| Whites/Caucasians | 12.2 /100 | #218 | Poor $82,029 |
| Nigerians | 10.3 /100 | #219 | Poor $81,725 |
| Immigrants | Venezuela | 9.0 /100 | #220 | Tragic $81,506 |
| Immigrants | Ghana | 9.0 /100 | #221 | Tragic $81,489 |