Bahamian vs Immigrants from Japan Median Female Earnings
COMPARE
Bahamian
Immigrants from Japan
Median Female Earnings
Median Female Earnings Comparison
Bahamians
Immigrants from Japan
$35,125
MEDIAN FEMALE EARNINGS
0.0/ 100
METRIC RATING
305th/ 347
METRIC RANK
$45,323
MEDIAN FEMALE EARNINGS
100.0/ 100
METRIC RATING
20th/ 347
METRIC RANK
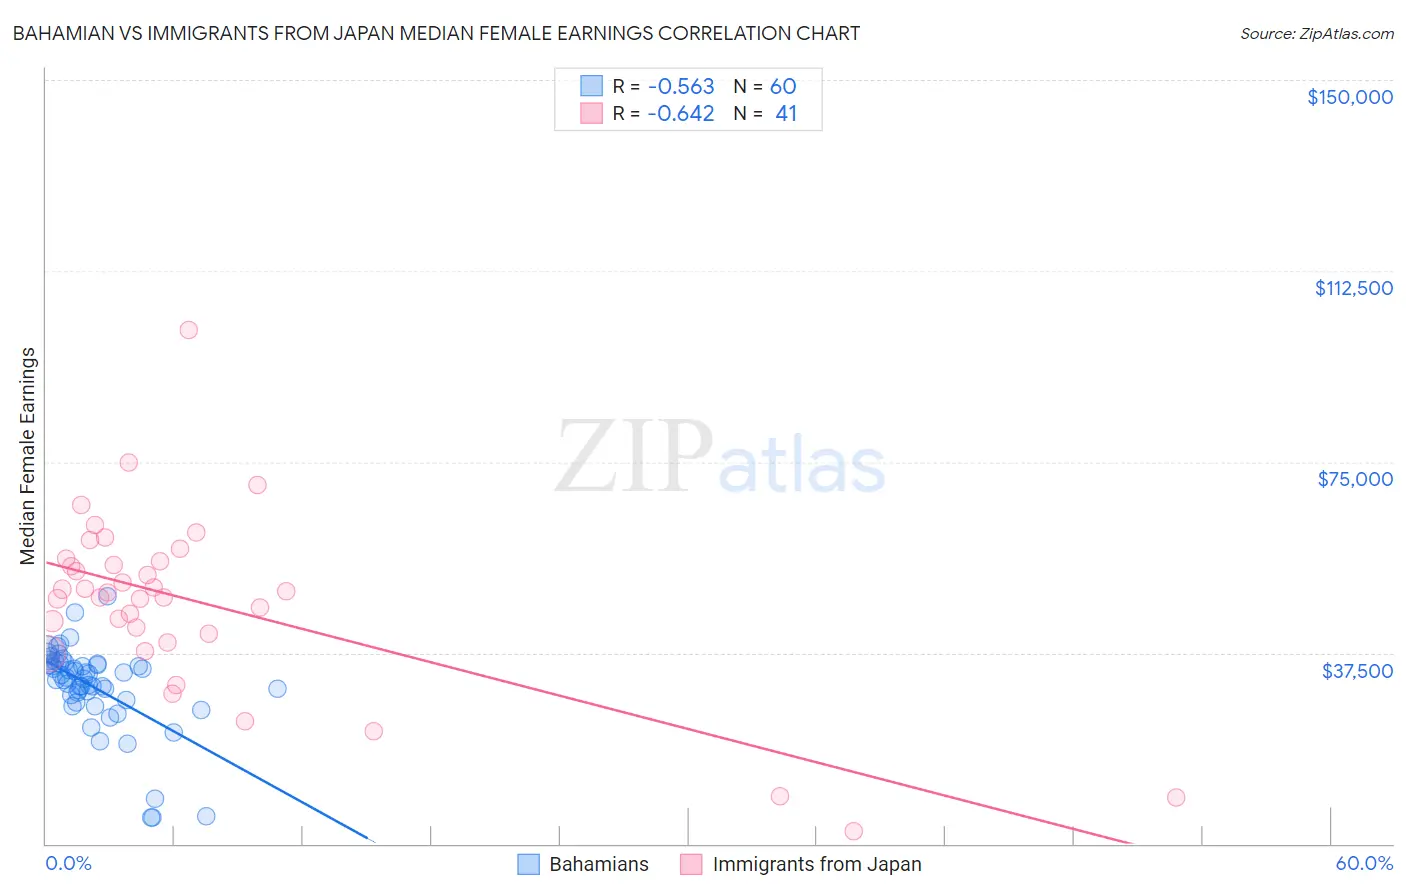
Bahamian vs Immigrants from Japan Median Female Earnings Correlation Chart
The statistical analysis conducted on geographies consisting of 112,672,199 people shows a substantial negative correlation between the proportion of Bahamians and median female earnings in the United States with a correlation coefficient (R) of -0.563 and weighted average of $35,125. Similarly, the statistical analysis conducted on geographies consisting of 340,067,986 people shows a significant negative correlation between the proportion of Immigrants from Japan and median female earnings in the United States with a correlation coefficient (R) of -0.642 and weighted average of $45,323, a difference of 29.0%.
Median Female Earnings Correlation Summary
| Measurement | Bahamian | Immigrants from Japan |
| Minimum | $5,063 | $2,499 |
| Maximum | $48,590 | $100,821 |
| Range | $43,527 | $98,322 |
| Mean | $30,808 | $47,310 |
| Median | $32,617 | $49,462 |
| Interquartile 25% (IQ1) | $28,645 | $40,316 |
| Interquartile 75% (IQ3) | $35,290 | $55,693 |
| Interquartile Range (IQR) | $6,645 | $15,376 |
| Standard Deviation (Sample) | $8,476 | $17,852 |
| Standard Deviation (Population) | $8,405 | $17,633 |
Similar Demographics by Median Female Earnings
Demographics Similar to Bahamians by Median Female Earnings
In terms of median female earnings, the demographic groups most similar to Bahamians are Fijian ($35,114, a difference of 0.030%), Sioux ($35,063, a difference of 0.18%), Immigrants from Bahamas ($35,027, a difference of 0.28%), Honduran ($35,013, a difference of 0.32%), and Chippewa ($35,003, a difference of 0.35%).
| Demographics | Rating | Rank | Median Female Earnings |
| Immigrants | Micronesia | 0.0 /100 | #298 | Tragic $35,477 |
| Immigrants | Guatemala | 0.0 /100 | #299 | Tragic $35,444 |
| Yuman | 0.0 /100 | #300 | Tragic $35,377 |
| Pima | 0.0 /100 | #301 | Tragic $35,326 |
| Blacks/African Americans | 0.0 /100 | #302 | Tragic $35,315 |
| Immigrants | Latin America | 0.0 /100 | #303 | Tragic $35,307 |
| Crow | 0.0 /100 | #304 | Tragic $35,266 |
| Bahamians | 0.0 /100 | #305 | Tragic $35,125 |
| Fijians | 0.0 /100 | #306 | Tragic $35,114 |
| Sioux | 0.0 /100 | #307 | Tragic $35,063 |
| Immigrants | Bahamas | 0.0 /100 | #308 | Tragic $35,027 |
| Hondurans | 0.0 /100 | #309 | Tragic $35,013 |
| Chippewa | 0.0 /100 | #310 | Tragic $35,003 |
| Ute | 0.0 /100 | #311 | Tragic $34,960 |
| Yaqui | 0.0 /100 | #312 | Tragic $34,943 |
Demographics Similar to Immigrants from Japan by Median Female Earnings
In terms of median female earnings, the demographic groups most similar to Immigrants from Japan are Eastern European ($45,385, a difference of 0.14%), Cypriot ($45,570, a difference of 0.55%), Cambodian ($45,014, a difference of 0.69%), Immigrants from Greece ($44,976, a difference of 0.77%), and Burmese ($44,911, a difference of 0.92%).
| Demographics | Rating | Rank | Median Female Earnings |
| Immigrants | Australia | 100.0 /100 | #13 | Exceptional $46,573 |
| Soviet Union | 100.0 /100 | #14 | Exceptional $46,556 |
| Immigrants | Eastern Asia | 100.0 /100 | #15 | Exceptional $46,502 |
| Indians (Asian) | 100.0 /100 | #16 | Exceptional $46,481 |
| Immigrants | South Central Asia | 100.0 /100 | #17 | Exceptional $46,324 |
| Cypriots | 100.0 /100 | #18 | Exceptional $45,570 |
| Eastern Europeans | 100.0 /100 | #19 | Exceptional $45,385 |
| Immigrants | Japan | 100.0 /100 | #20 | Exceptional $45,323 |
| Cambodians | 100.0 /100 | #21 | Exceptional $45,014 |
| Immigrants | Greece | 100.0 /100 | #22 | Exceptional $44,976 |
| Burmese | 100.0 /100 | #23 | Exceptional $44,911 |
| Immigrants | Korea | 100.0 /100 | #24 | Exceptional $44,847 |
| Immigrants | Sweden | 100.0 /100 | #25 | Exceptional $44,774 |
| Immigrants | Belarus | 100.0 /100 | #26 | Exceptional $44,757 |
| Turks | 100.0 /100 | #27 | Exceptional $44,695 |