Zip Codes with the Highest Percentage of Population Employed in Arts, Entertainment & Recreation in Terre Haute, IN
RELATED REPORTS & OPTIONS
Arts, Entertainment & Recreation
Terre Haute
Compare Zip Codes
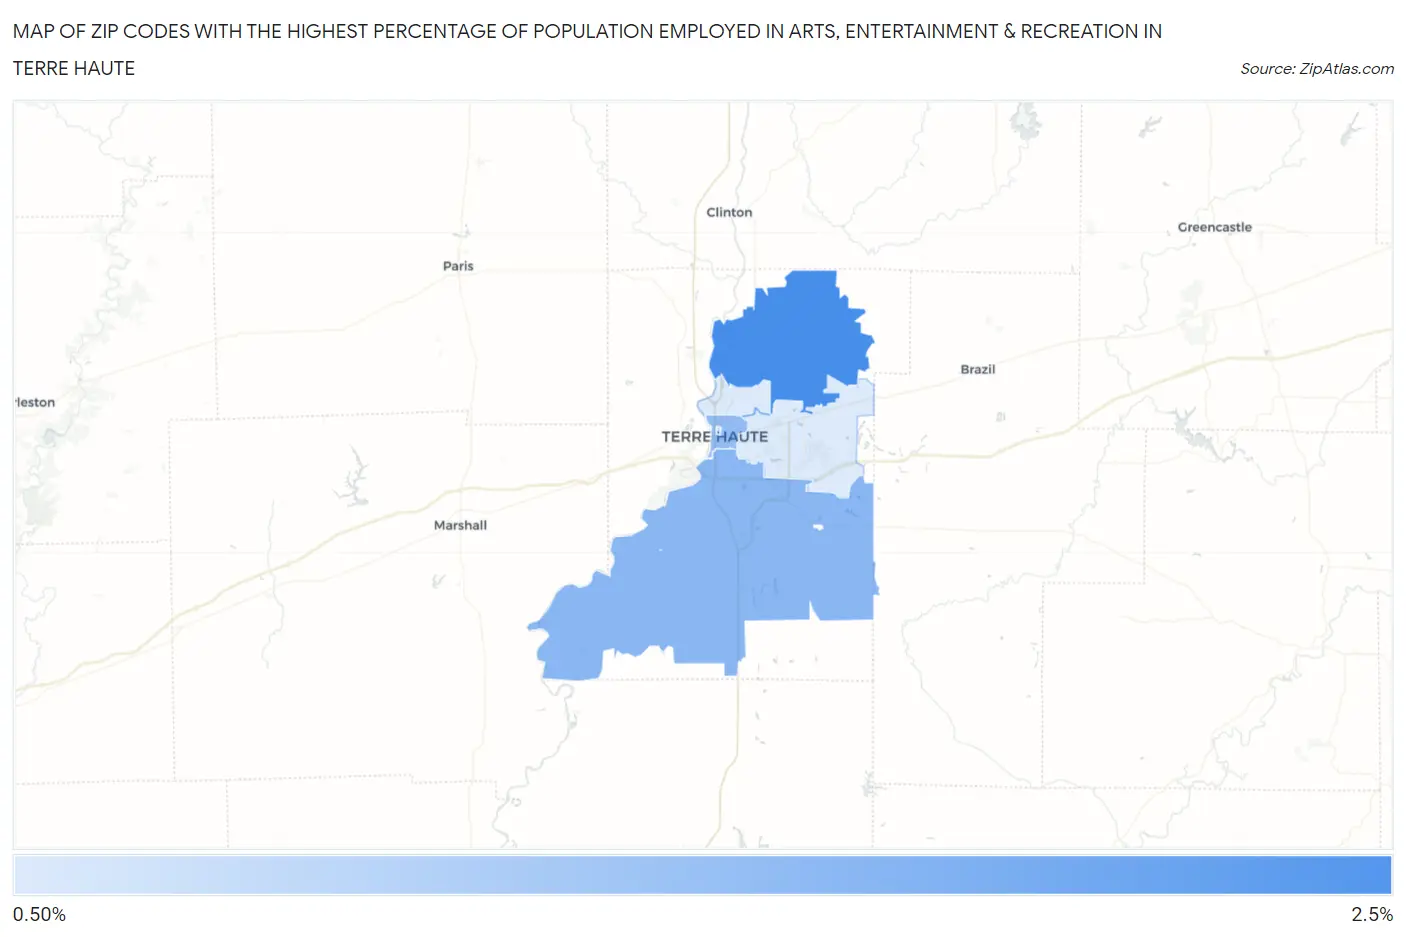
Map of Zip Codes with the Highest Percentage of Population Employed in Arts, Entertainment & Recreation in Terre Haute
0.0%
2.5%
Zip Codes with the Highest Percentage of Population Employed in Arts, Entertainment & Recreation in Terre Haute, IN
| Zip Code | % Employed | vs State | vs National | |
| 1. | 47805 | 2.1% | 1.6%(+0.419)#157 | 2.1%(-0.024)#9,441 |
| 2. | 47802 | 1.5% | 1.6%(-0.134)#235 | 2.1%(-0.577)#13,204 |
| 3. | 47807 | 1.4% | 1.6%(-0.213)#249 | 2.1%(-0.656)#13,775 |
| 4. | 47809 | 1.1% | 1.6%(-0.526)#299 | 2.1%(-0.969)#16,131 |
| 5. | 47804 | 0.83% | 1.6%(-0.811)#357 | 2.1%(-1.25)#18,208 |
| 6. | 47803 | 0.83% | 1.6%(-0.814)#358 | 2.1%(-1.26)#18,228 |
1
Common Questions
What are the Top 5 Zip Codes with the Highest Percentage of Population Employed in Arts, Entertainment & Recreation in Terre Haute, IN?
Top 5 Zip Codes with the Highest Percentage of Population Employed in Arts, Entertainment & Recreation in Terre Haute, IN are:
What zip code has the Highest Percentage of Population Employed in Arts, Entertainment & Recreation in Terre Haute, IN?
47805 has the Highest Percentage of Population Employed in Arts, Entertainment & Recreation in Terre Haute, IN with 2.1%.
What is the Percentage of Population Employed in Arts, Entertainment & Recreation in Terre Haute, IN?
Percentage of Population Employed in Arts, Entertainment & Recreation in Terre Haute is 1.2%.
What is the Percentage of Population Employed in Arts, Entertainment & Recreation in Indiana?
Percentage of Population Employed in Arts, Entertainment & Recreation in Indiana is 1.6%.
What is the Percentage of Population Employed in Arts, Entertainment & Recreation in the United States?
Percentage of Population Employed in Arts, Entertainment & Recreation in the United States is 2.1%.