Zip Codes with the Highest Percentage of Population Employed in Accommodation & Food Services in Terre Haute, IN
RELATED REPORTS & OPTIONS
Accommodation & Food Services
Terre Haute
Compare Zip Codes
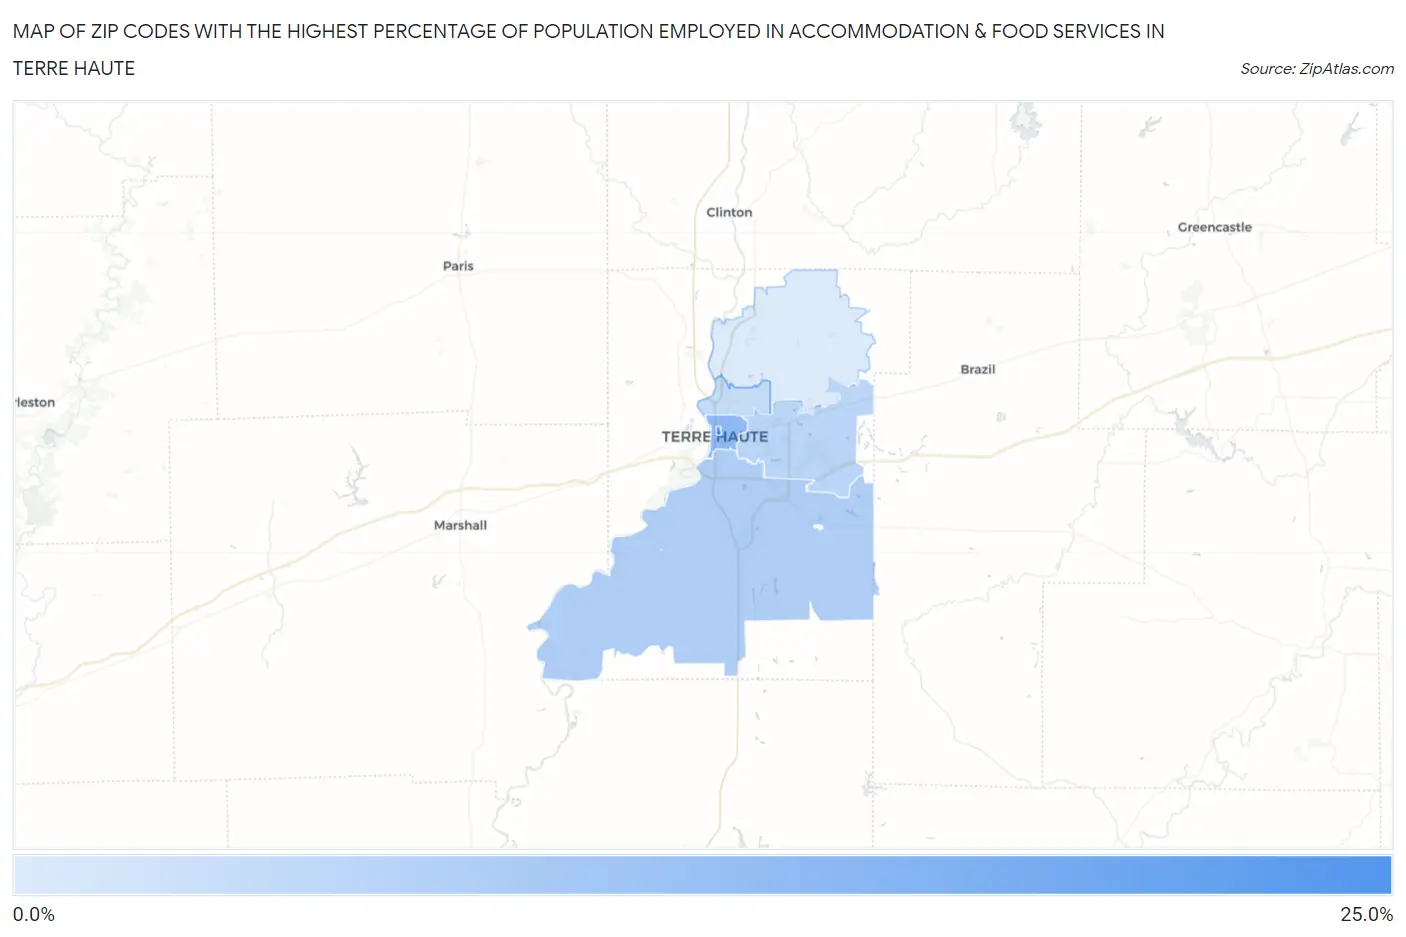
Map of Zip Codes with the Highest Percentage of Population Employed in Accommodation & Food Services in Terre Haute
0.0%
25.0%
Zip Codes with the Highest Percentage of Population Employed in Accommodation & Food Services in Terre Haute, IN
| Zip Code | % Employed | vs State | vs National | |
| 1. | 47809 | 23.9% | 6.4%(+17.5)#8 | 6.9%(+17.1)#562 |
| 2. | 47807 | 13.4% | 6.4%(+6.98)#31 | 6.9%(+6.54)#2,172 |
| 3. | 47802 | 9.1% | 6.4%(+2.64)#126 | 6.9%(+2.20)#5,838 |
| 4. | 47803 | 7.4% | 6.4%(+0.968)#202 | 6.9%(+0.525)#9,241 |
| 5. | 47804 | 5.9% | 6.4%(-0.566)#313 | 6.9%(-1.01)#13,873 |
| 6. | 47805 | 2.9% | 6.4%(-3.54)#575 | 6.9%(-3.99)#23,512 |
1
Common Questions
What are the Top 5 Zip Codes with the Highest Percentage of Population Employed in Accommodation & Food Services in Terre Haute, IN?
Top 5 Zip Codes with the Highest Percentage of Population Employed in Accommodation & Food Services in Terre Haute, IN are:
What zip code has the Highest Percentage of Population Employed in Accommodation & Food Services in Terre Haute, IN?
47809 has the Highest Percentage of Population Employed in Accommodation & Food Services in Terre Haute, IN with 23.9%.
What is the Percentage of Population Employed in Accommodation & Food Services in Terre Haute, IN?
Percentage of Population Employed in Accommodation & Food Services in Terre Haute is 10.5%.
What is the Percentage of Population Employed in Accommodation & Food Services in Indiana?
Percentage of Population Employed in Accommodation & Food Services in Indiana is 6.4%.
What is the Percentage of Population Employed in Accommodation & Food Services in the United States?
Percentage of Population Employed in Accommodation & Food Services in the United States is 6.9%.