Zip Codes with the Highest Percentage of Population Employed in Food Preparation & Serving in Fort Wayne, IN
RELATED REPORTS & OPTIONS
Food Preparation & Serving
Fort Wayne
Compare Zip Codes
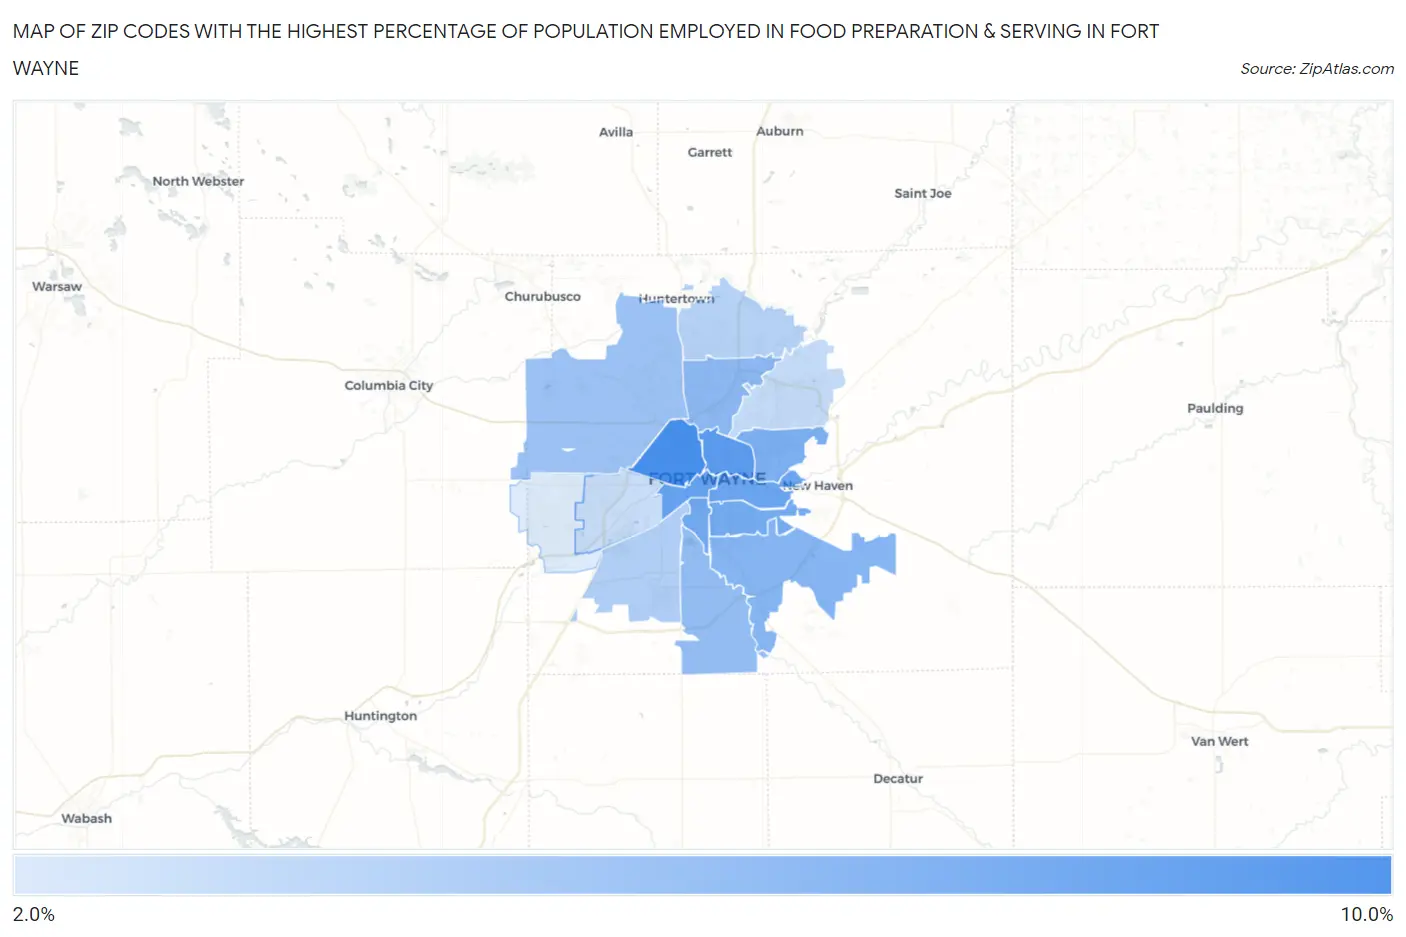
Map of Zip Codes with the Highest Percentage of Population Employed in Food Preparation & Serving in Fort Wayne
0.0%
10.0%
Zip Codes with the Highest Percentage of Population Employed in Food Preparation & Serving in Fort Wayne, IN
| Zip Code | % Employed | vs State | vs National | |
| 1. | 46808 | 9.6% | 5.3%(+4.31)#64 | 5.3%(+4.34)#2,946 |
| 2. | 46805 | 8.7% | 5.3%(+3.41)#86 | 5.3%(+3.44)#3,808 |
| 3. | 46802 | 8.2% | 5.3%(+2.88)#103 | 5.3%(+2.91)#4,447 |
| 4. | 46803 | 7.8% | 5.3%(+2.49)#112 | 5.3%(+2.52)#5,041 |
| 5. | 46807 | 7.5% | 5.3%(+2.17)#121 | 5.3%(+2.20)#5,583 |
| 6. | 46806 | 7.4% | 5.3%(+2.04)#127 | 5.3%(+2.07)#5,833 |
| 7. | 46815 | 7.0% | 5.3%(+1.69)#145 | 5.3%(+1.72)#6,553 |
| 8. | 46816 | 6.6% | 5.3%(+1.28)#175 | 5.3%(+1.31)#7,603 |
| 9. | 46825 | 6.2% | 5.3%(+0.905)#208 | 5.3%(+0.934)#8,679 |
| 10. | 46819 | 5.9% | 5.3%(+0.631)#241 | 5.3%(+0.659)#9,523 |
| 11. | 46818 | 5.6% | 5.3%(+0.271)#271 | 5.3%(+0.300)#10,758 |
| 12. | 46809 | 4.5% | 5.3%(-0.855)#381 | 5.3%(-0.827)#15,175 |
| 13. | 46845 | 4.2% | 5.3%(-1.07)#407 | 5.3%(-1.04)#16,115 |
| 14. | 46835 | 3.6% | 5.3%(-1.76)#481 | 5.3%(-1.73)#18,970 |
| 15. | 46804 | 3.4% | 5.3%(-1.89)#491 | 5.3%(-1.86)#19,492 |
| 16. | 46814 | 2.4% | 5.3%(-2.89)#582 | 5.3%(-2.86)#23,402 |
1
Common Questions
What are the Top 10 Zip Codes with the Highest Percentage of Population Employed in Food Preparation & Serving in Fort Wayne, IN?
Top 10 Zip Codes with the Highest Percentage of Population Employed in Food Preparation & Serving in Fort Wayne, IN are:
What zip code has the Highest Percentage of Population Employed in Food Preparation & Serving in Fort Wayne, IN?
46808 has the Highest Percentage of Population Employed in Food Preparation & Serving in Fort Wayne, IN with 9.6%.
What is the Percentage of Population Employed in Food Preparation & Serving in Fort Wayne, IN?
Percentage of Population Employed in Food Preparation & Serving in Fort Wayne is 6.5%.
What is the Percentage of Population Employed in Food Preparation & Serving in Indiana?
Percentage of Population Employed in Food Preparation & Serving in Indiana is 5.3%.
What is the Percentage of Population Employed in Food Preparation & Serving in the United States?
Percentage of Population Employed in Food Preparation & Serving in the United States is 5.3%.