Wendell, ID
Wendell Map
Wendell Overview
2,900
TOTAL POPULATION
1,571
MALE POPULATION
1,329
FEMALE POPULATION
118.21
MALES / 100 FEMALES
84.60
FEMALES / 100 MALES
34.7
MEDIAN AGE
4.3
AVG FAMILY SIZE
3.0
AVG HOUSEHOLD SIZE
$20,571
PER CAPITA INCOME
$51,579
AVG FAMILY INCOME
$46,875
AVG HOUSEHOLD INCOME
17.4%
WAGE / INCOME GAP [ % ]
82.6¢/ $1
WAGE / INCOME GAP [ $ ]
$9,692
FAMILY INCOME DEFICIT
0.39
INEQUALITY / GINI INDEX
1,352
LABOR FORCE [ PEOPLE ]
61.5%
PERCENT IN LABOR FORCE
2.1%
UNEMPLOYMENT RATE
Wendell Zip Codes
Wendell Area Codes
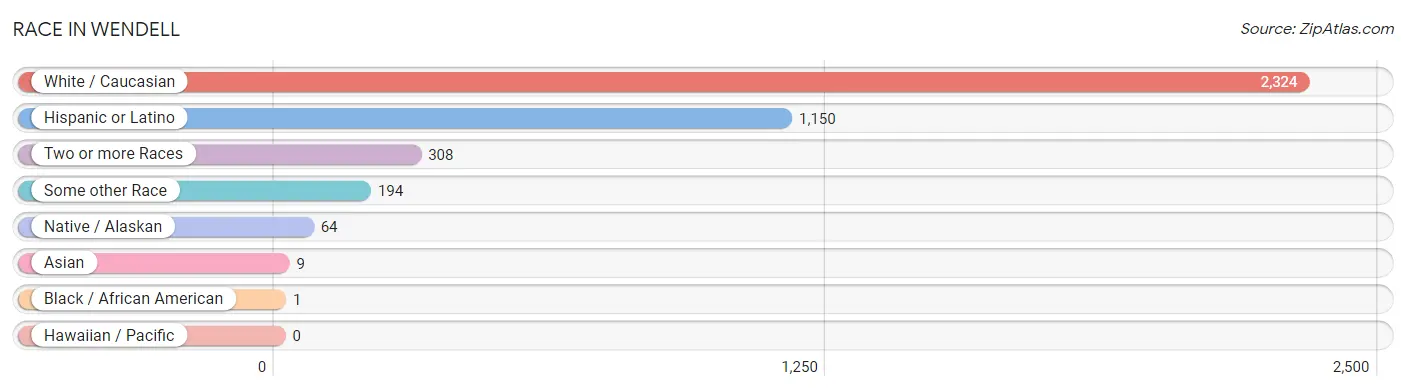
Race in Wendell
The most populous races in Wendell are White / Caucasian (2,324 | 80.1%), Hispanic or Latino (1,150 | 39.7%), and Two or more Races (308 | 10.6%).
| Race | # Population | % Population |
| Asian | 9 | 0.3% |
| Black / African American | 1 | 0.0% |
| Hawaiian / Pacific | 0 | 0.0% |
| Hispanic or Latino | 1,150 | 39.7% |
| Native / Alaskan | 64 | 2.2% |
| White / Caucasian | 2,324 | 80.1% |
| Two or more Races | 308 | 10.6% |
| Some other Race | 194 | 6.7% |
| Total | 2,900 | 100.0% |
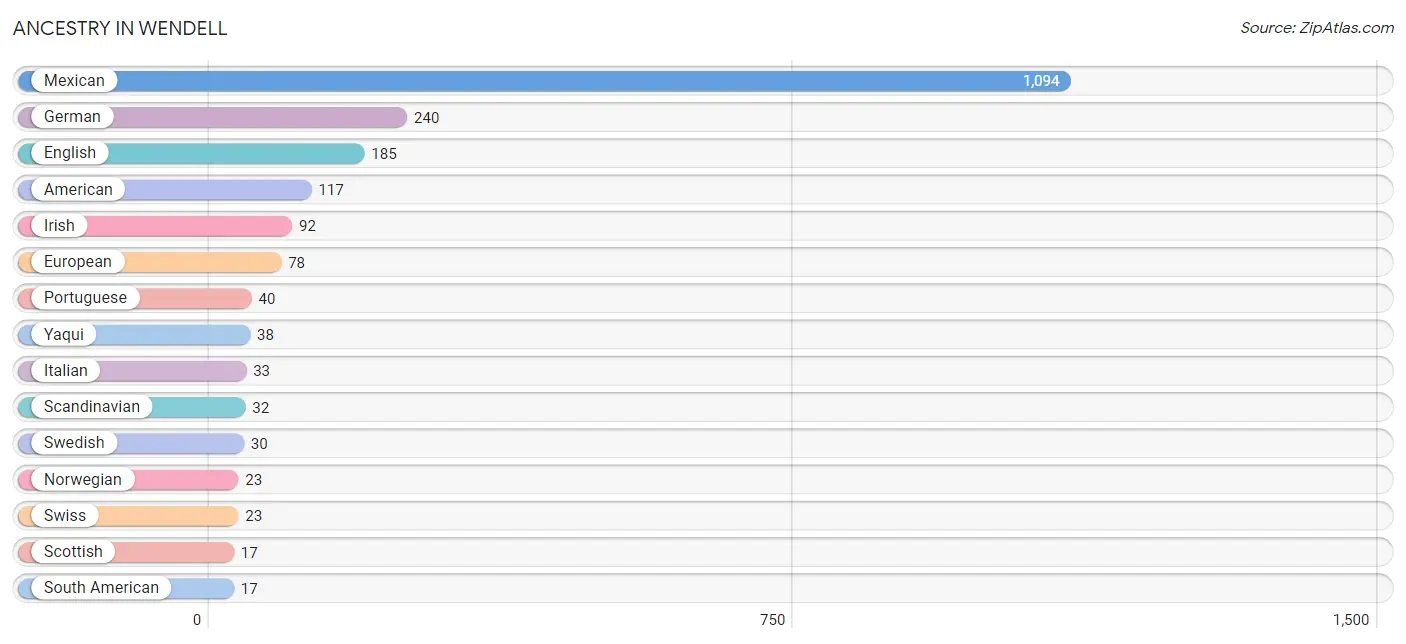
Ancestry in Wendell
The most populous ancestries reported in Wendell are Mexican (1,094 | 37.7%), German (240 | 8.3%), English (185 | 6.4%), American (117 | 4.0%), and Irish (92 | 3.2%), together accounting for 59.6% of all Wendell residents.
| Ancestry | # Population | % Population |
| American | 117 | 4.0% |
| Arab | 2 | 0.1% |
| Argentinean | 1 | 0.0% |
| Australian | 6 | 0.2% |
| Bhutanese | 9 | 0.3% |
| Colombian | 16 | 0.5% |
| Czech | 7 | 0.2% |
| Delaware | 8 | 0.3% |
| Dutch | 10 | 0.3% |
| English | 185 | 6.4% |
| European | 78 | 2.7% |
| French | 8 | 0.3% |
| German | 240 | 8.3% |
| Greek | 7 | 0.2% |
| Irish | 92 | 3.2% |
| Italian | 33 | 1.1% |
| Mexican | 1,094 | 37.7% |
| Mexican American Indian | 10 | 0.3% |
| Norwegian | 23 | 0.8% |
| Polish | 5 | 0.2% |
| Portuguese | 40 | 1.4% |
| Russian | 9 | 0.3% |
| Scandinavian | 32 | 1.1% |
| Scotch-Irish | 11 | 0.4% |
| Scottish | 17 | 0.6% |
| South American | 17 | 0.6% |
| Spaniard | 11 | 0.4% |
| Swedish | 30 | 1.0% |
| Swiss | 23 | 0.8% |
| Welsh | 13 | 0.4% |
| Yakama | 2 | 0.1% |
| Yaqui | 38 | 1.3% | View All 32 Rows |
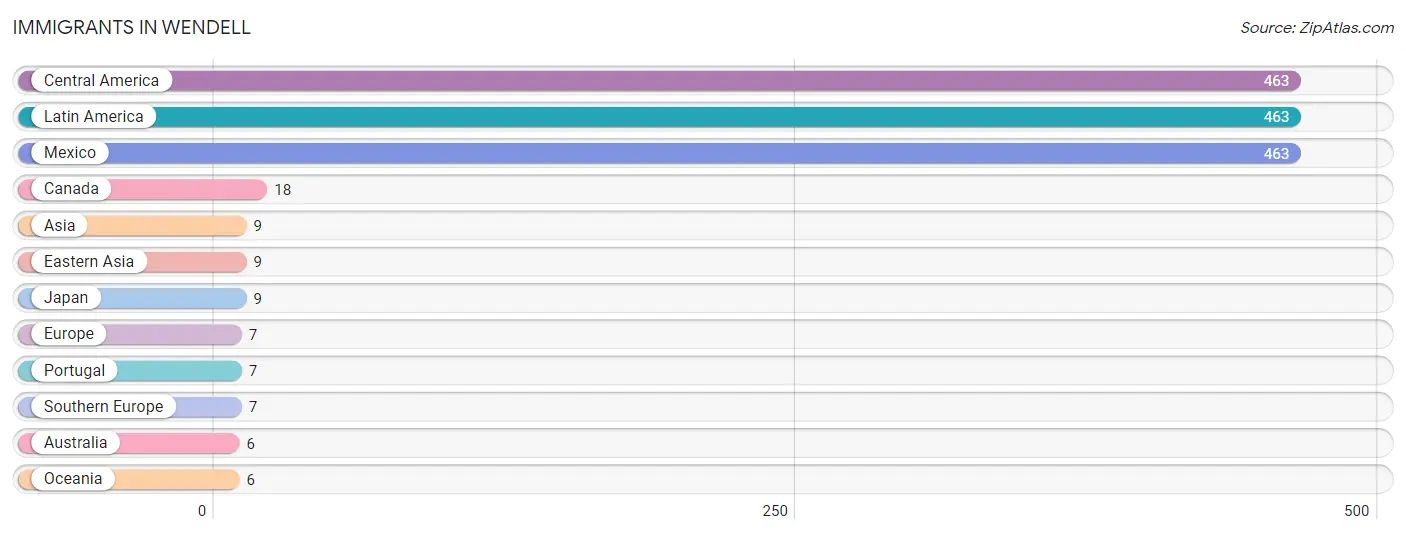
Immigrants in Wendell
The most numerous immigrant groups reported in Wendell came from Central America (463 | 16.0%), Latin America (463 | 16.0%), Mexico (463 | 16.0%), Canada (18 | 0.6%), and Asia (9 | 0.3%), together accounting for 48.8% of all Wendell residents.
| Immigration Origin | # Population | % Population |
| Asia | 9 | 0.3% |
| Australia | 6 | 0.2% |
| Canada | 18 | 0.6% |
| Central America | 463 | 16.0% |
| Eastern Asia | 9 | 0.3% |
| Europe | 7 | 0.2% |
| Japan | 9 | 0.3% |
| Latin America | 463 | 16.0% |
| Mexico | 463 | 16.0% |
| Oceania | 6 | 0.2% |
| Portugal | 7 | 0.2% |
| Southern Europe | 7 | 0.2% | View All 12 Rows |
Sex and Age in Wendell
Sex and Age in Wendell
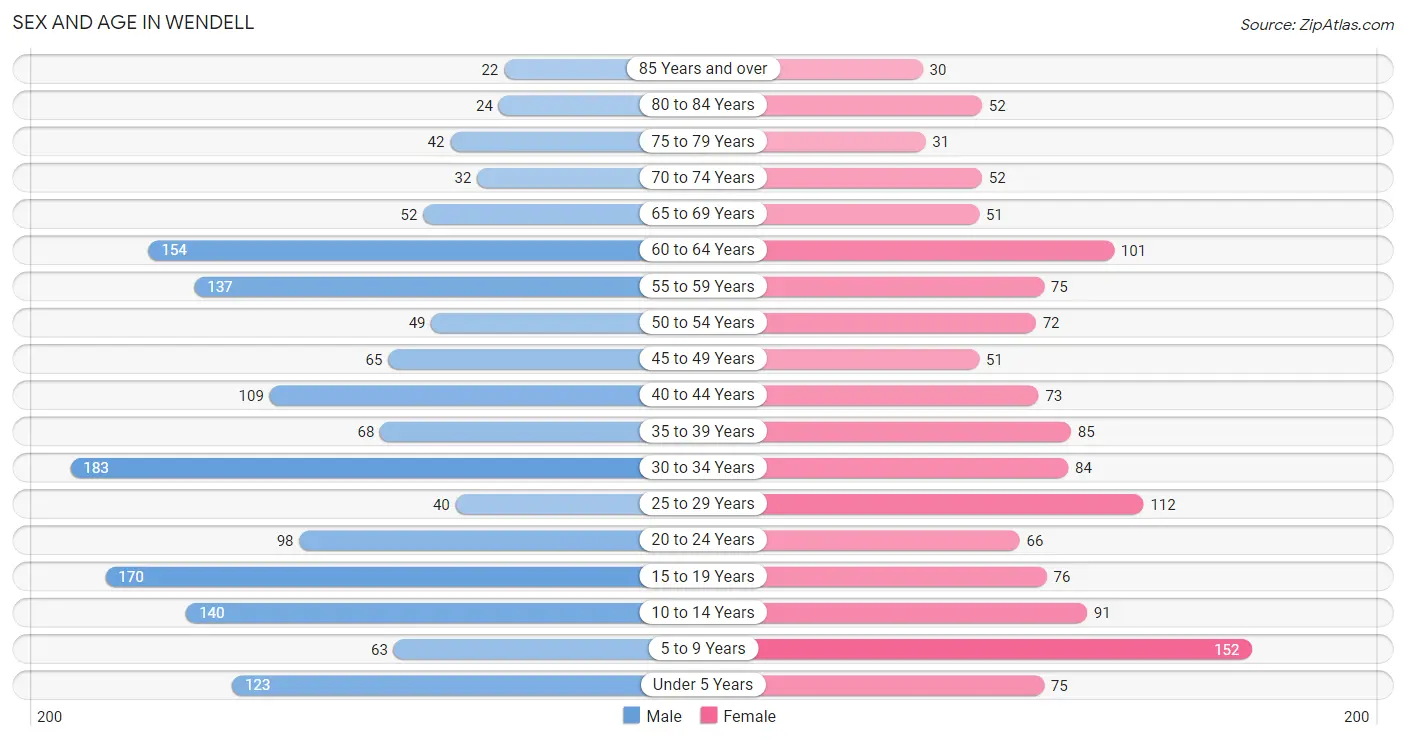
The most populous age groups in Wendell are 30 to 34 Years (183 | 11.7%) for men and 5 to 9 Years (152 | 11.4%) for women.
| Age Bracket | Male | Female |
| Under 5 Years | 123 (7.8%) | 75 (5.6%) |
| 5 to 9 Years | 63 (4.0%) | 152 (11.4%) |
| 10 to 14 Years | 140 (8.9%) | 91 (6.9%) |
| 15 to 19 Years | 170 (10.8%) | 76 (5.7%) |
| 20 to 24 Years | 98 (6.2%) | 66 (5.0%) |
| 25 to 29 Years | 40 (2.5%) | 112 (8.4%) |
| 30 to 34 Years | 183 (11.7%) | 84 (6.3%) |
| 35 to 39 Years | 68 (4.3%) | 85 (6.4%) |
| 40 to 44 Years | 109 (6.9%) | 73 (5.5%) |
| 45 to 49 Years | 65 (4.1%) | 51 (3.8%) |
| 50 to 54 Years | 49 (3.1%) | 72 (5.4%) |
| 55 to 59 Years | 137 (8.7%) | 75 (5.6%) |
| 60 to 64 Years | 154 (9.8%) | 101 (7.6%) |
| 65 to 69 Years | 52 (3.3%) | 51 (3.8%) |
| 70 to 74 Years | 32 (2.0%) | 52 (3.9%) |
| 75 to 79 Years | 42 (2.7%) | 31 (2.3%) |
| 80 to 84 Years | 24 (1.5%) | 52 (3.9%) |
| 85 Years and over | 22 (1.4%) | 30 (2.3%) |
| Total | 1,571 (100.0%) | 1,329 (100.0%) |
Families and Households in Wendell
Median Family Size in Wendell
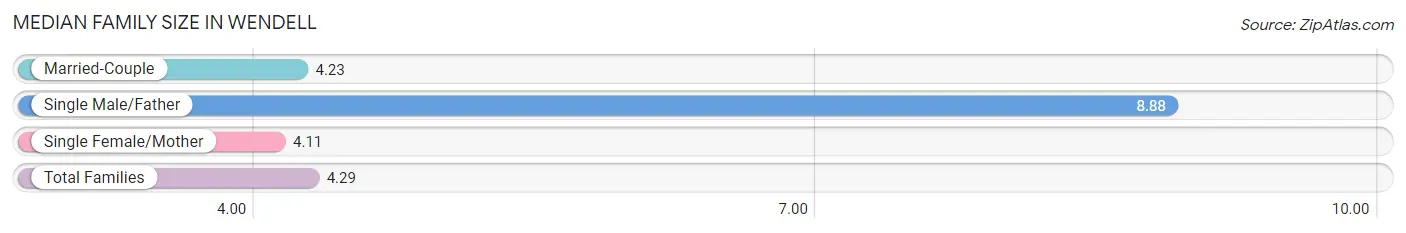
The median family size in Wendell is 4.29 persons per family, with single male/father families (8 | 1.4%) accounting for the largest median family size of 8.88 persons per family. On the other hand, single female/mother families (35 | 6.2%) represent the smallest median family size with 4.11 persons per family.
| Family Type | # Families | Family Size |
| Married-Couple | 519 (92.3%) | 4.23 |
| Single Male/Father | 8 (1.4%) | 8.88 |
| Single Female/Mother | 35 (6.2%) | 4.11 |
| Total Families | 562 (100.0%) | 4.29 |
Median Household Size in Wendell
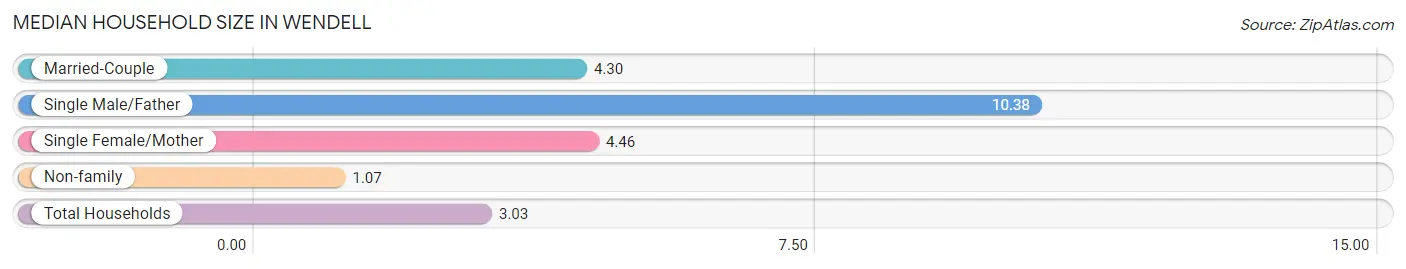
The median household size in Wendell is 3.03 persons per household, with single male/father households (8 | 0.8%) accounting for the largest median household size of 10.38 persons per household. non-family households (391 | 41.0%) represent the smallest median household size with 1.07 persons per household.
| Household Type | # Households | Household Size |
| Married-Couple | 519 (54.5%) | 4.30 |
| Single Male/Father | 8 (0.8%) | 10.38 |
| Single Female/Mother | 35 (3.7%) | 4.46 |
| Non-family | 391 (41.0%) | 1.07 |
| Total Households | 953 (100.0%) | 3.03 |
Household Size by Marriage Status in Wendell
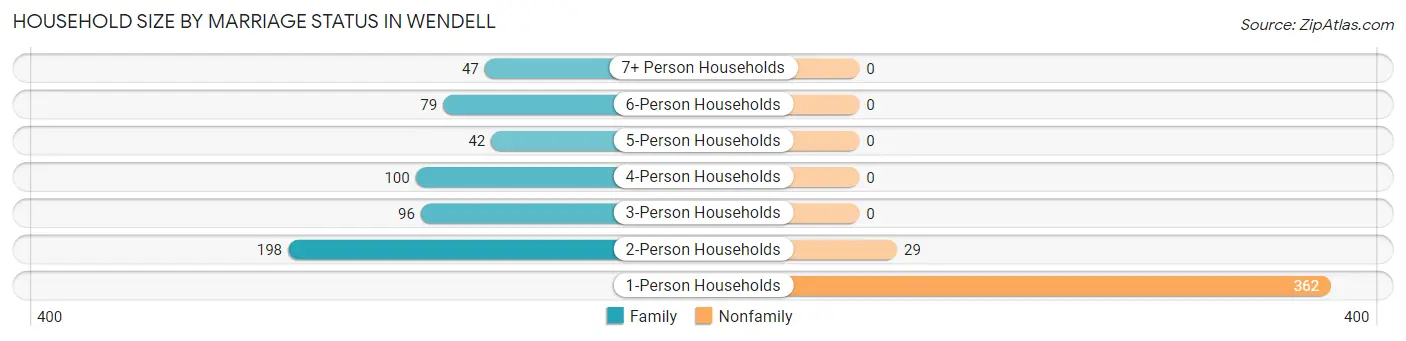
Out of a total of 953 households in Wendell, 562 (59.0%) are family households, while 391 (41.0%) are nonfamily households. The most numerous type of family households are 2-person households, comprising 198, and the most common type of nonfamily households are 1-person households, comprising 362.
| Household Size | Family Households | Nonfamily Households |
| 1-Person Households | - | 362 (38.0%) |
| 2-Person Households | 198 (20.8%) | 29 (3.0%) |
| 3-Person Households | 96 (10.1%) | 0 (0.0%) |
| 4-Person Households | 100 (10.5%) | 0 (0.0%) |
| 5-Person Households | 42 (4.4%) | 0 (0.0%) |
| 6-Person Households | 79 (8.3%) | 0 (0.0%) |
| 7+ Person Households | 47 (4.9%) | 0 (0.0%) |
| Total | 562 (59.0%) | 391 (41.0%) |
Female Fertility in Wendell
Fertility by Age in Wendell
Average fertility rate in Wendell is 95.0 births per 1,000 women. Women in the age bracket of 20 to 34 years have the highest fertility rate with 141.0 births per 1,000 women. Women in the age bracket of 20 to 34 years acount for 71.2% of all women with births.
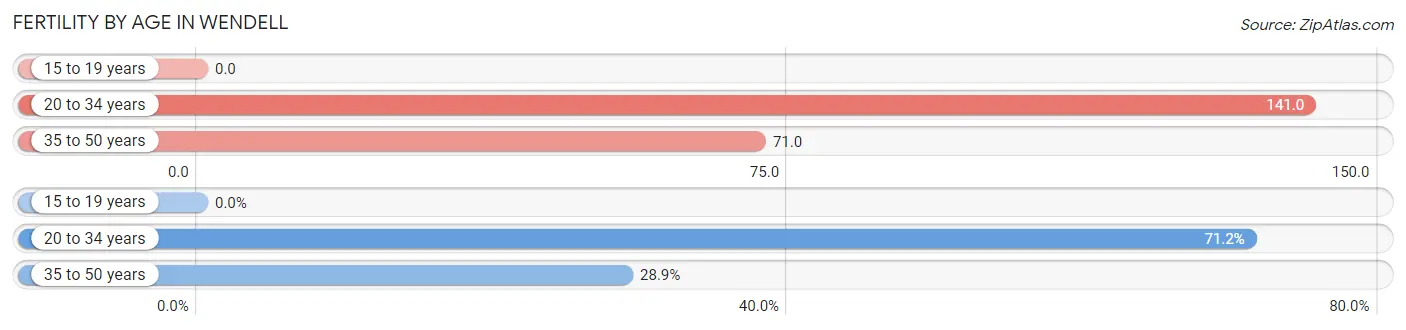
| Age Bracket | Women with Births | Births / 1,000 Women |
| 15 to 19 years | 0 (0.0%) | 0.0 |
| 20 to 34 years | 37 (71.2%) | 141.0 |
| 35 to 50 years | 15 (28.8%) | 71.0 |
| Total | 52 (100.0%) | 95.0 |
Fertility by Age by Marriage Status in Wendell
51.9% of women with births (52) in Wendell are married. The highest percentage of unmarried women with births falls into 20 to 34 years age bracket with 48.6% of them unmarried at the time of birth, while the lowest percentage of unmarried women with births belong to 35 to 50 years age bracket with 46.7% of them unmarried.
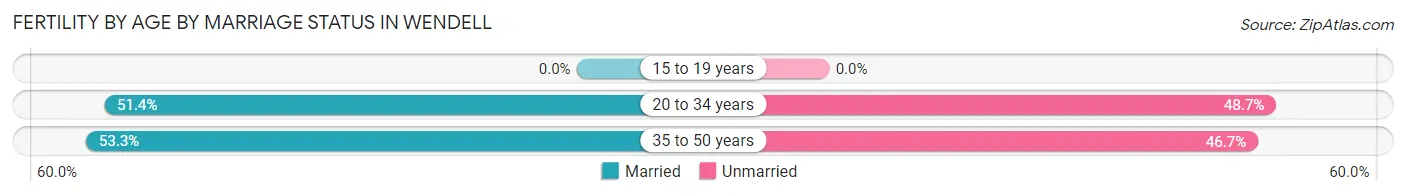
| Age Bracket | Married | Unmarried |
| 15 to 19 years | 0 (0.0%) | 0 (0.0%) |
| 20 to 34 years | 19 (51.3%) | 18 (48.6%) |
| 35 to 50 years | 8 (53.3%) | 7 (46.7%) |
| Total | 27 (51.9%) | 25 (48.1%) |
Fertility by Education in Wendell
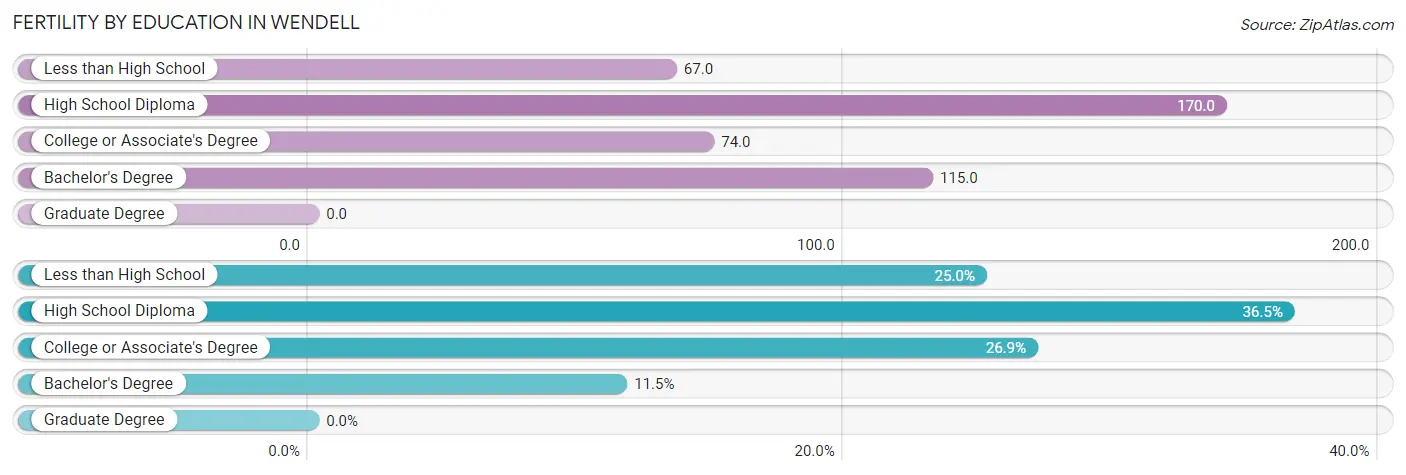
| Educational Attainment | Women with Births | Births / 1,000 Women |
| Less than High School | 13 (25.0%) | 67.0 |
| High School Diploma | 19 (36.5%) | 170.0 |
| College or Associate's Degree | 14 (26.9%) | 74.0 |
| Bachelor's Degree | 6 (11.5%) | 115.0 |
| Graduate Degree | 0 (0.0%) | 0.0 |
| Total | 52 (100.0%) | 95.0 |
Fertility by Education by Marriage Status in Wendell
48.1% of women with births in Wendell are unmarried. Women with the educational attainment of bachelor's degree are most likely to be married with 100.0% of them married at childbirth, while women with the educational attainment of less than high school are least likely to be married with 100.0% of them unmarried at childbirth.
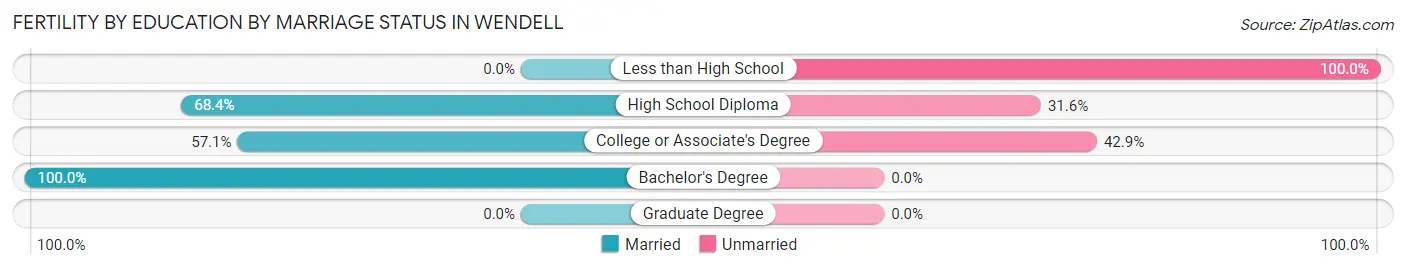
| Educational Attainment | Married | Unmarried |
| Less than High School | 0 (0.0%) | 13 (100.0%) |
| High School Diploma | 13 (68.4%) | 6 (31.6%) |
| College or Associate's Degree | 8 (57.1%) | 6 (42.9%) |
| Bachelor's Degree | 6 (100.0%) | 0 (0.0%) |
| Graduate Degree | 0 (0.0%) | 0 (0.0%) |
| Total | 27 (51.9%) | 25 (48.1%) |
Income in Wendell
Income Overview in Wendell
Per Capita Income in Wendell is $20,571, while median incomes of families and households are $51,579 and $46,875 respectively.
| Characteristic | Number | Measure |
| Per Capita Income | 2,900 | $20,571 |
| Median Family Income | 562 | $51,579 |
| Mean Family Income | 562 | $65,887 |
| Median Household Income | 953 | $46,875 |
| Mean Household Income | 953 | $55,675 |
| Income Deficit | 562 | $9,692 |
| Wage / Income Gap (%) | 2,900 | 17.43% |
| Wage / Income Gap ($) | 2,900 | 82.57¢ per $1 |
| Gini / Inequality Index | 2,900 | 0.39 |
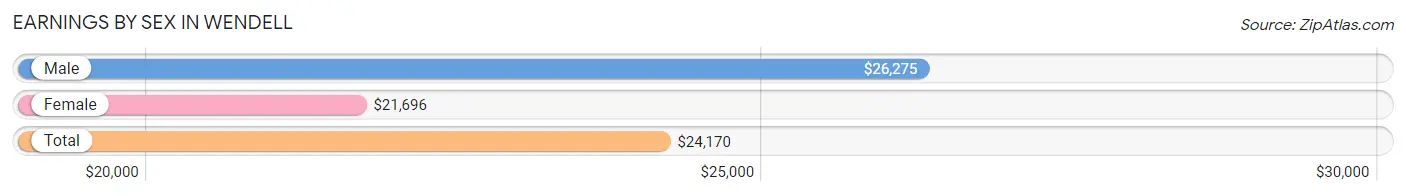
Earnings by Sex in Wendell
Average Earnings in Wendell are $24,170, $26,275 for men and $21,696 for women, a difference of 17.4%.
| Sex | Number | Average Earnings |
| Male | 867 (62.2%) | $26,275 |
| Female | 526 (37.8%) | $21,696 |
| Total | 1,393 (100.0%) | $24,170 |
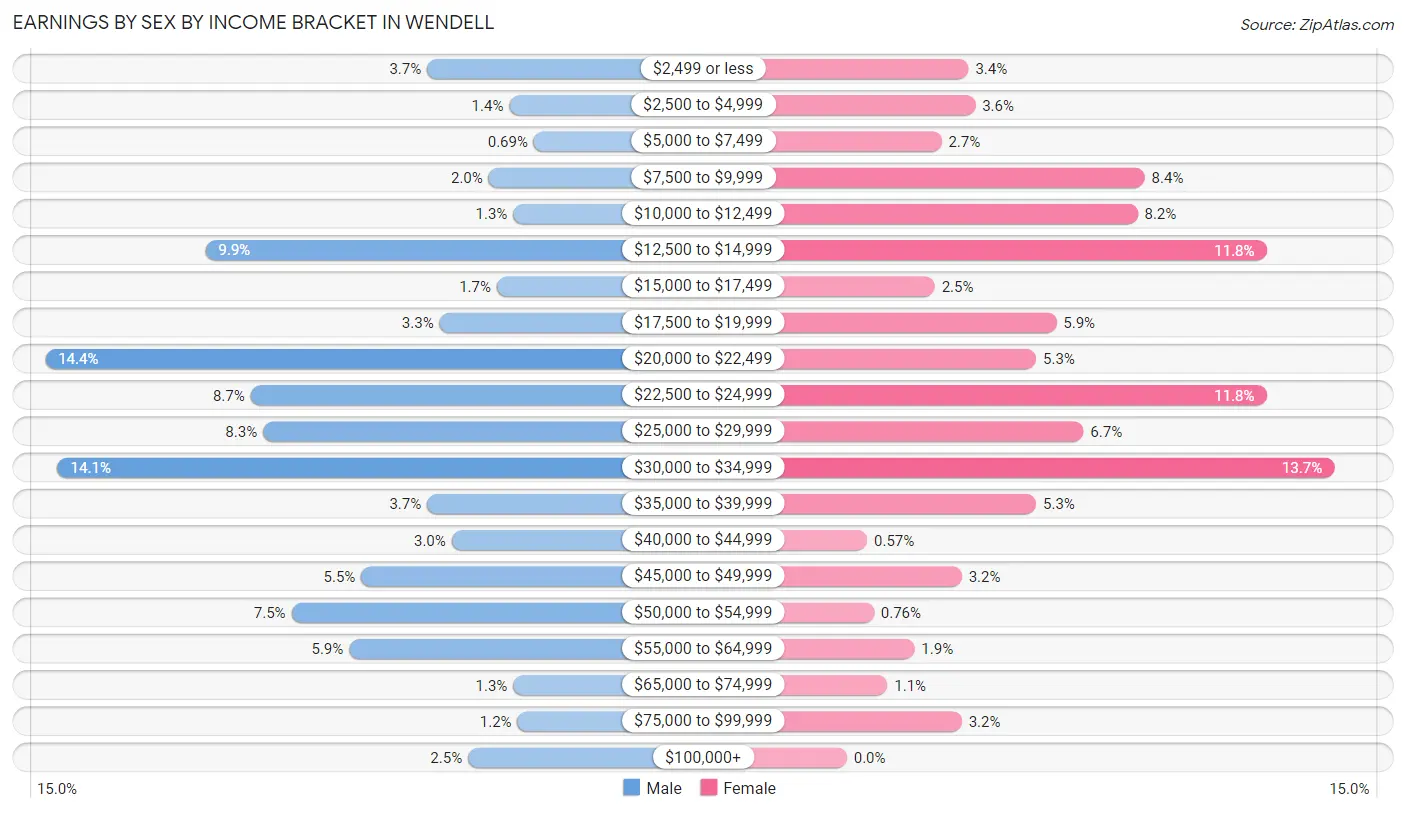
Earnings by Sex by Income Bracket in Wendell
The most common earnings brackets in Wendell are $20,000 to $22,499 for men (125 | 14.4%) and $30,000 to $34,999 for women (72 | 13.7%).
| Income | Male | Female |
| $2,499 or less | 32 (3.7%) | 18 (3.4%) |
| $2,500 to $4,999 | 12 (1.4%) | 19 (3.6%) |
| $5,000 to $7,499 | 6 (0.7%) | 14 (2.7%) |
| $7,500 to $9,999 | 17 (2.0%) | 44 (8.4%) |
| $10,000 to $12,499 | 11 (1.3%) | 43 (8.2%) |
| $12,500 to $14,999 | 86 (9.9%) | 62 (11.8%) |
| $15,000 to $17,499 | 15 (1.7%) | 13 (2.5%) |
| $17,500 to $19,999 | 29 (3.3%) | 31 (5.9%) |
| $20,000 to $22,499 | 125 (14.4%) | 28 (5.3%) |
| $22,500 to $24,999 | 75 (8.6%) | 62 (11.8%) |
| $25,000 to $29,999 | 72 (8.3%) | 35 (6.7%) |
| $30,000 to $34,999 | 122 (14.1%) | 72 (13.7%) |
| $35,000 to $39,999 | 32 (3.7%) | 28 (5.3%) |
| $40,000 to $44,999 | 26 (3.0%) | 3 (0.6%) |
| $45,000 to $49,999 | 48 (5.5%) | 17 (3.2%) |
| $50,000 to $54,999 | 65 (7.5%) | 4 (0.8%) |
| $55,000 to $64,999 | 51 (5.9%) | 10 (1.9%) |
| $65,000 to $74,999 | 11 (1.3%) | 6 (1.1%) |
| $75,000 to $99,999 | 10 (1.1%) | 17 (3.2%) |
| $100,000+ | 22 (2.5%) | 0 (0.0%) |
| Total | 867 (100.0%) | 526 (100.0%) |
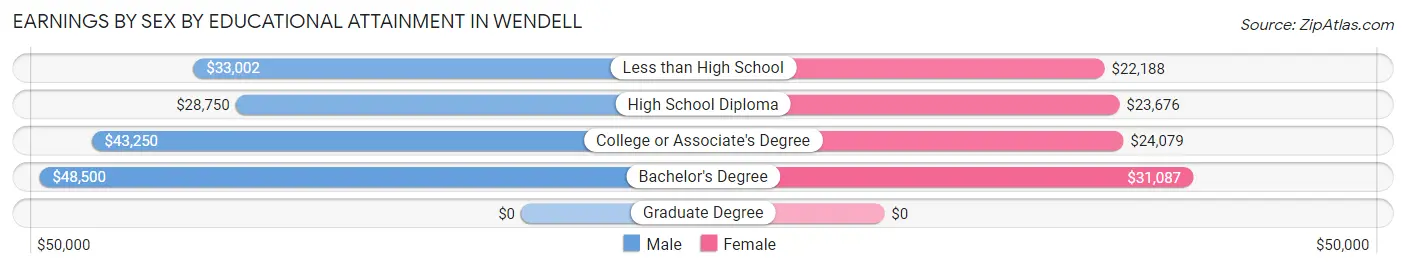
Earnings by Sex by Educational Attainment in Wendell
Average earnings in Wendell are $32,853 for men and $23,662 for women, a difference of 28.0%. Men with an educational attainment of bachelor's degree enjoy the highest average annual earnings of $48,500, while those with high school diploma education earn the least with $28,750. Women with an educational attainment of bachelor's degree earn the most with the average annual earnings of $31,087, while those with less than high school education have the smallest earnings of $22,188.
| Educational Attainment | Male Income | Female Income |
| Less than High School | $33,002 | $22,188 |
| High School Diploma | $28,750 | $23,676 |
| College or Associate's Degree | $43,250 | $24,079 |
| Bachelor's Degree | $48,500 | $31,087 |
| Graduate Degree | - | - |
| Total | $32,853 | $23,662 |
Family Income in Wendell
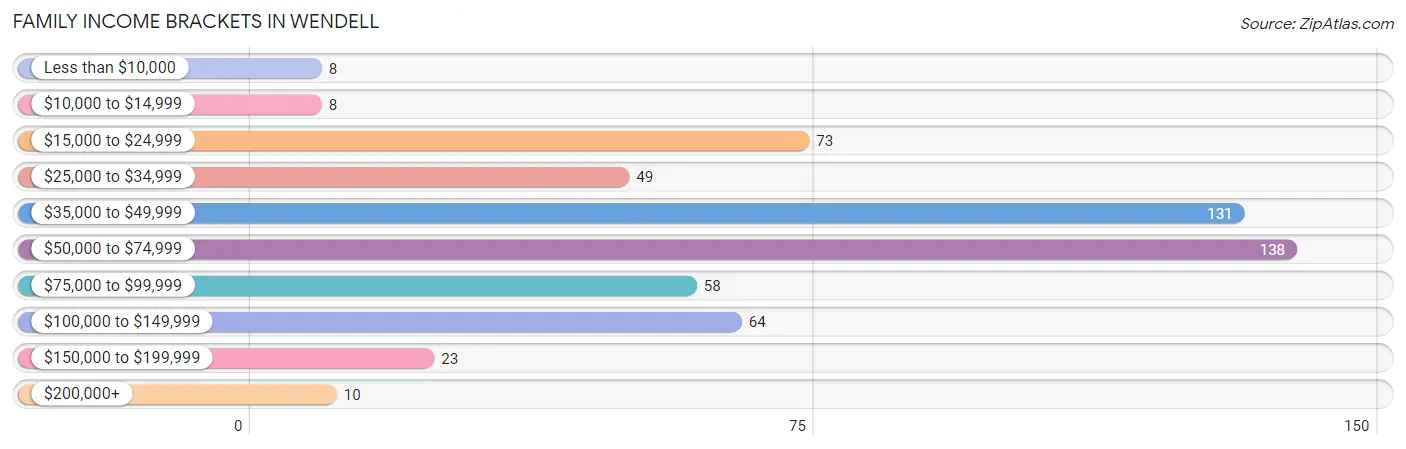
Family Income Brackets in Wendell
According to the Wendell family income data, there are 138 families falling into the $50,000 to $74,999 income range, which is the most common income bracket and makes up 24.6% of all families. Conversely, the less than $10,000 income bracket is the least frequent group with only 8 families (1.4%) belonging to this category.
| Income Bracket | # Families | % Families |
| Less than $10,000 | 8 | 1.4% |
| $10,000 to $14,999 | 8 | 1.4% |
| $15,000 to $24,999 | 73 | 13.0% |
| $25,000 to $34,999 | 49 | 8.7% |
| $35,000 to $49,999 | 131 | 23.3% |
| $50,000 to $74,999 | 138 | 24.6% |
| $75,000 to $99,999 | 58 | 10.3% |
| $100,000 to $149,999 | 64 | 11.4% |
| $150,000 to $199,999 | 23 | 4.1% |
| $200,000+ | 10 | 1.8% |
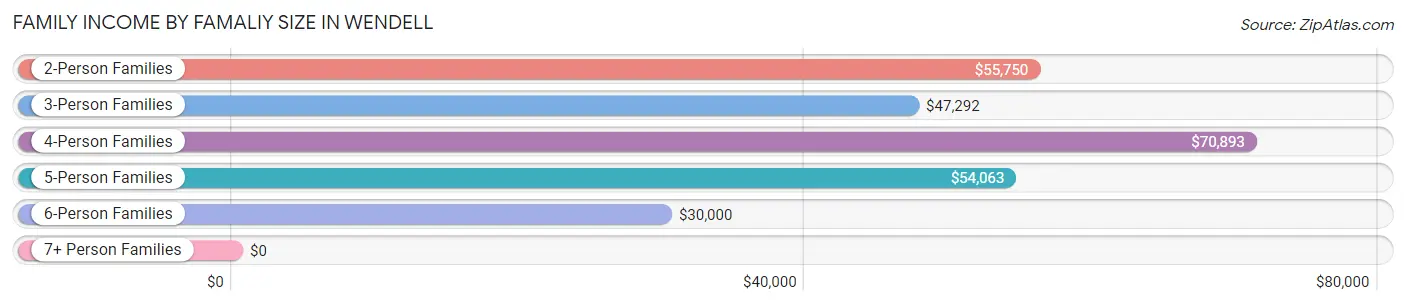
Family Income by Famaliy Size in Wendell
4-person families (91 | 16.2%) account for the highest median family income in Wendell with $70,893 per family, while 2-person families (203 | 36.1%) have the highest median income of $27,875 per family member.
| Income Bracket | # Families | Median Income |
| 2-Person Families | 203 (36.1%) | $55,750 |
| 3-Person Families | 100 (17.8%) | $47,292 |
| 4-Person Families | 91 (16.2%) | $70,893 |
| 5-Person Families | 51 (9.1%) | $54,063 |
| 6-Person Families | 84 (14.9%) | $30,000 |
| 7+ Person Families | 33 (5.9%) | $0 |
| Total | 562 (100.0%) | $51,579 |
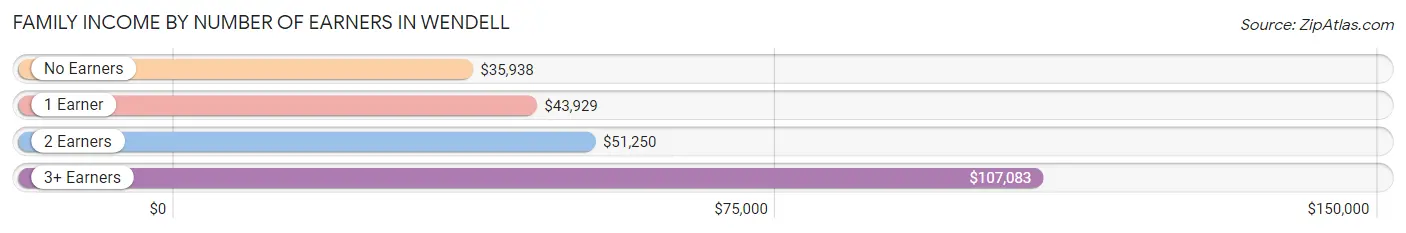
Family Income by Number of Earners in Wendell
The median family income in Wendell is $51,579, with families comprising 3+ earners (73) having the highest median family income of $107,083, while families with no earners (87) have the lowest median family income of $35,938, accounting for 13.0% and 15.5% of families, respectively.
| Number of Earners | # Families | Median Income |
| No Earners | 87 (15.5%) | $35,938 |
| 1 Earner | 162 (28.8%) | $43,929 |
| 2 Earners | 240 (42.7%) | $51,250 |
| 3+ Earners | 73 (13.0%) | $107,083 |
| Total | 562 (100.0%) | $51,579 |
Household Income in Wendell
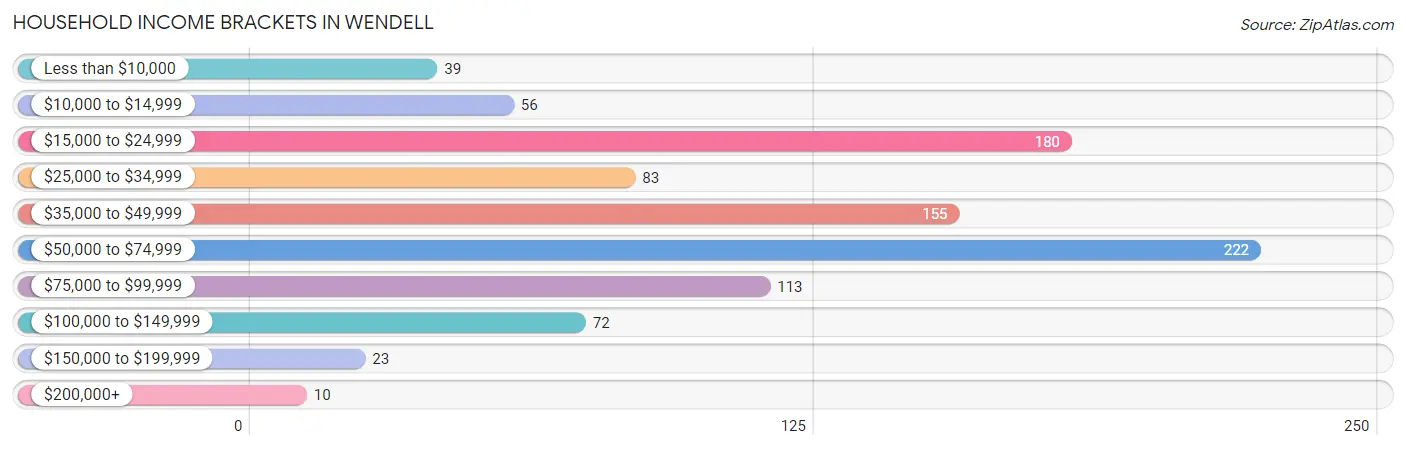
Household Income Brackets in Wendell
With 222 households falling in the category, the $50,000 to $74,999 income range is the most frequent in Wendell, accounting for 23.3% of all households. In contrast, only 10 households (1.1%) fall into the $200,000+ income bracket, making it the least populous group.
| Income Bracket | # Households | % Households |
| Less than $10,000 | 39 | 4.1% |
| $10,000 to $14,999 | 56 | 5.9% |
| $15,000 to $24,999 | 180 | 18.9% |
| $25,000 to $34,999 | 83 | 8.7% |
| $35,000 to $49,999 | 155 | 16.3% |
| $50,000 to $74,999 | 222 | 23.3% |
| $75,000 to $99,999 | 113 | 11.9% |
| $100,000 to $149,999 | 72 | 7.6% |
| $150,000 to $199,999 | 23 | 2.4% |
| $200,000+ | 10 | 1.0% |
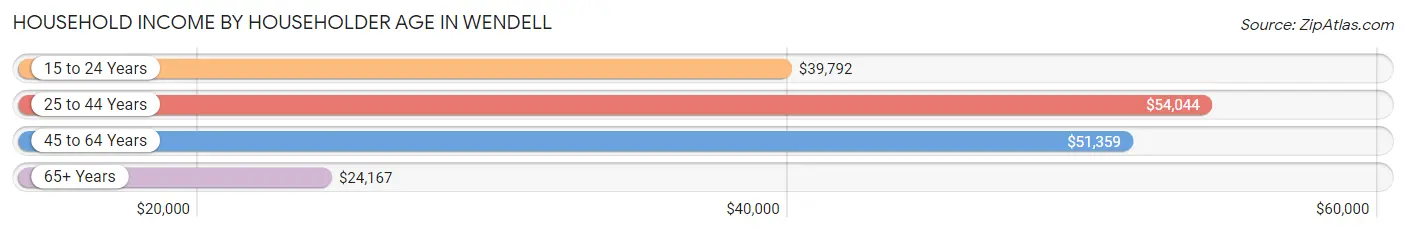
Household Income by Householder Age in Wendell
The median household income in Wendell is $46,875, with the highest median household income of $54,044 found in the 25 to 44 years age bracket for the primary householder. A total of 257 households (27.0%) fall into this category. Meanwhile, the 65+ years age bracket for the primary householder has the lowest median household income of $24,167, with 234 households (24.5%) in this group.
| Income Bracket | # Households | Median Income |
| 15 to 24 Years | 45 (4.7%) | $39,792 |
| 25 to 44 Years | 257 (27.0%) | $54,044 |
| 45 to 64 Years | 417 (43.8%) | $51,359 |
| 65+ Years | 234 (24.5%) | $24,167 |
| Total | 953 (100.0%) | $46,875 |
Poverty in Wendell
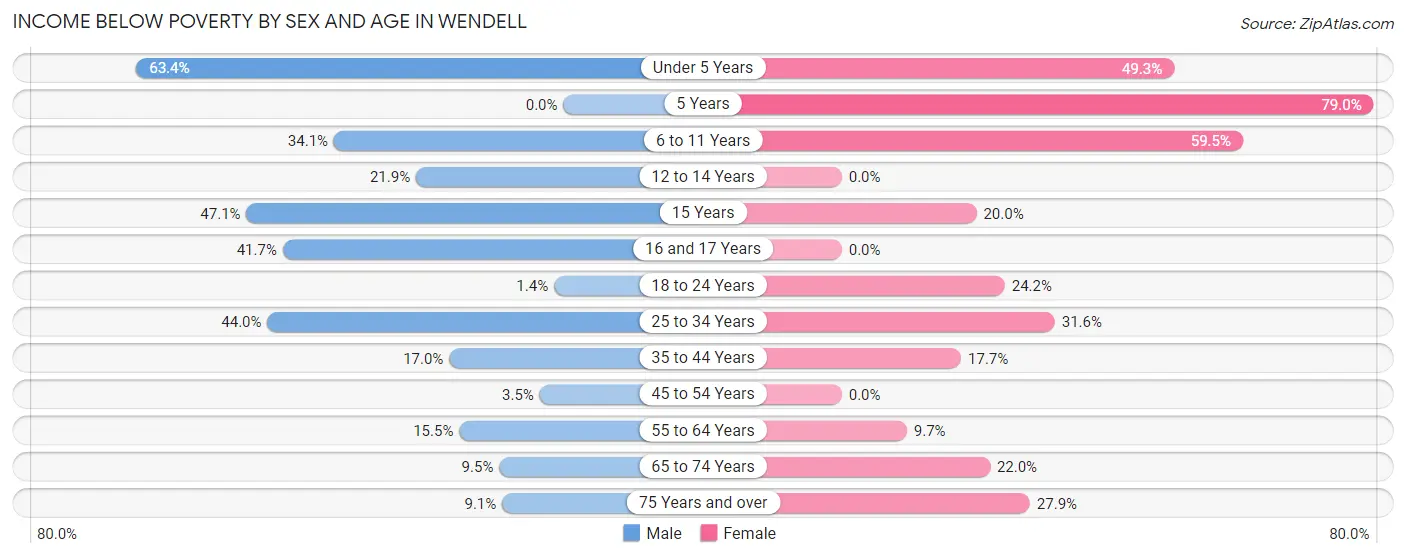
Income Below Poverty by Sex and Age in Wendell
With 24.7% poverty level for males and 25.6% for females among the residents of Wendell, under 5 year old males and 5 year old females are the most vulnerable to poverty, with 78 males (63.4%) and 15 females (78.9%) in their respective age groups living below the poverty level.
| Age Bracket | Male | Female |
| Under 5 Years | 78 (63.4%) | 37 (49.3%) |
| 5 Years | 0 (0.0%) | 15 (78.9%) |
| 6 to 11 Years | 46 (34.1%) | 103 (59.5%) |
| 12 to 14 Years | 14 (21.9%) | 0 (0.0%) |
| 15 Years | 24 (47.1%) | 1 (20.0%) |
| 16 and 17 Years | 30 (41.7%) | 0 (0.0%) |
| 18 to 24 Years | 2 (1.4%) | 23 (24.2%) |
| 25 to 34 Years | 98 (44.0%) | 62 (31.6%) |
| 35 to 44 Years | 30 (17.0%) | 28 (17.7%) |
| 45 to 54 Years | 4 (3.5%) | 0 (0.0%) |
| 55 to 64 Years | 45 (15.5%) | 17 (9.7%) |
| 65 to 74 Years | 8 (9.5%) | 22 (22.0%) |
| 75 Years and over | 8 (9.1%) | 31 (27.9%) |
| Total | 387 (24.7%) | 339 (25.6%) |
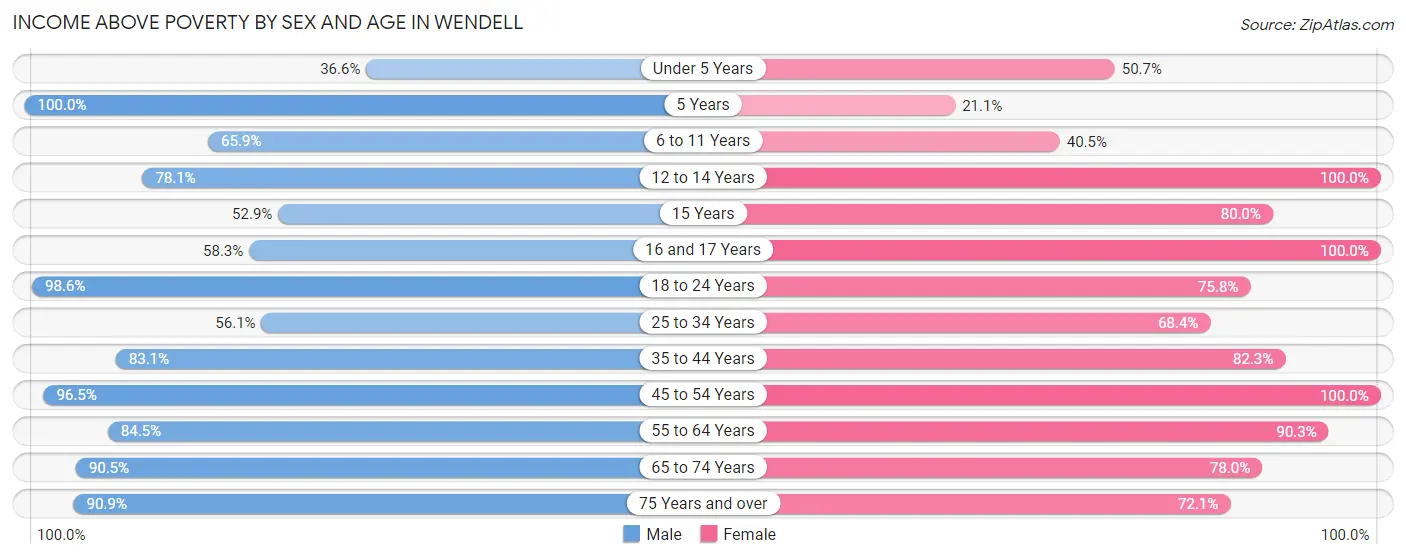
Income Above Poverty by Sex and Age in Wendell
According to the poverty statistics in Wendell, males aged 5 years and females aged 12 to 14 years are the age groups that are most secure financially, with 100.0% of males and 100.0% of females in these age groups living above the poverty line.
| Age Bracket | Male | Female |
| Under 5 Years | 45 (36.6%) | 38 (50.7%) |
| 5 Years | 3 (100.0%) | 4 (21.0%) |
| 6 to 11 Years | 89 (65.9%) | 70 (40.5%) |
| 12 to 14 Years | 50 (78.1%) | 50 (100.0%) |
| 15 Years | 27 (52.9%) | 4 (80.0%) |
| 16 and 17 Years | 42 (58.3%) | 41 (100.0%) |
| 18 to 24 Years | 142 (98.6%) | 72 (75.8%) |
| 25 to 34 Years | 125 (56.0%) | 134 (68.4%) |
| 35 to 44 Years | 147 (83.1%) | 130 (82.3%) |
| 45 to 54 Years | 110 (96.5%) | 123 (100.0%) |
| 55 to 64 Years | 246 (84.5%) | 159 (90.3%) |
| 65 to 74 Years | 76 (90.5%) | 78 (78.0%) |
| 75 Years and over | 80 (90.9%) | 80 (72.1%) |
| Total | 1,182 (75.3%) | 983 (74.4%) |
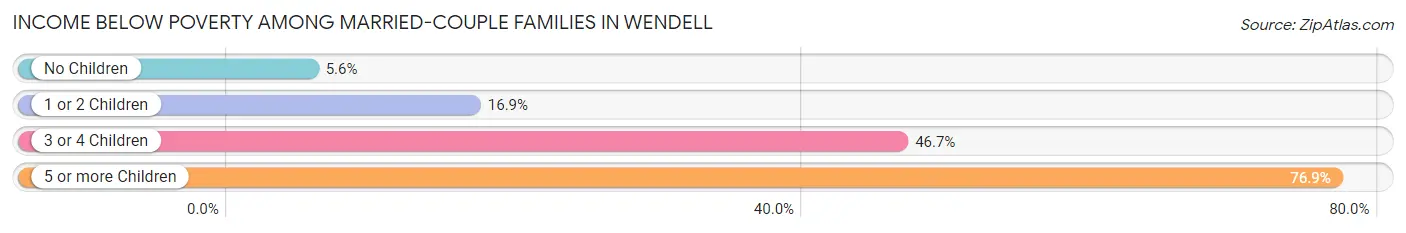
Income Below Poverty Among Married-Couple Families in Wendell
The poverty statistics for married-couple families in Wendell show that 19.3% or 100 of the total 519 families live below the poverty line. Families with 5 or more children have the highest poverty rate of 76.9%, comprising of 20 families. On the other hand, families with no children have the lowest poverty rate of 5.6%, which includes 15 families.
| Children | Above Poverty | Below Poverty |
| No Children | 252 (94.4%) | 15 (5.6%) |
| 1 or 2 Children | 113 (83.1%) | 23 (16.9%) |
| 3 or 4 Children | 48 (53.3%) | 42 (46.7%) |
| 5 or more Children | 6 (23.1%) | 20 (76.9%) |
| Total | 419 (80.7%) | 100 (19.3%) |
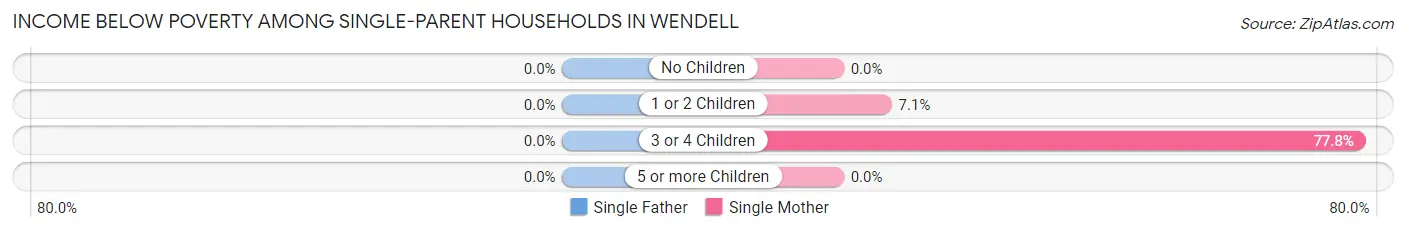
Income Below Poverty Among Single-Parent Households in Wendell
| Children | Single Father | Single Mother |
| No Children | 0 (0.0%) | 0 (0.0%) |
| 1 or 2 Children | 0 (0.0%) | 1 (7.1%) |
| 3 or 4 Children | 0 (0.0%) | 7 (77.8%) |
| 5 or more Children | 0 (0.0%) | 0 (0.0%) |
| Total | 0 (0.0%) | 8 (22.9%) |
Income Below Poverty Among Married-Couple vs Single-Parent Households in Wendell
The poverty data for Wendell shows that 100 of the married-couple family households (19.3%) and 8 of the single-parent households (18.6%) are living below the poverty level. Within the married-couple family households, those with 5 or more children have the highest poverty rate, with 20 households (76.9%) falling below the poverty line. Among the single-parent households, those with 3 or 4 children have the highest poverty rate, with 7 household (41.2%) living below poverty.
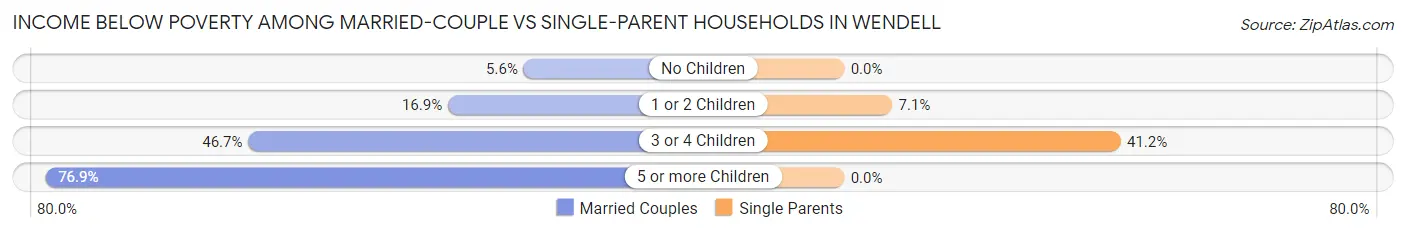
| Children | Married-Couple Families | Single-Parent Households |
| No Children | 15 (5.6%) | 0 (0.0%) |
| 1 or 2 Children | 23 (16.9%) | 1 (7.1%) |
| 3 or 4 Children | 42 (46.7%) | 7 (41.2%) |
| 5 or more Children | 20 (76.9%) | 0 (0.0%) |
| Total | 100 (19.3%) | 8 (18.6%) |
Employment Characteristics in Wendell
Employment by Class of Employer in Wendell
Among the 1,281 employed individuals in Wendell, private company employees (898 | 70.1%), self-employed (incorporated) (142 | 11.1%), and state government employees (79 | 6.2%) make up the most common classes of employment.
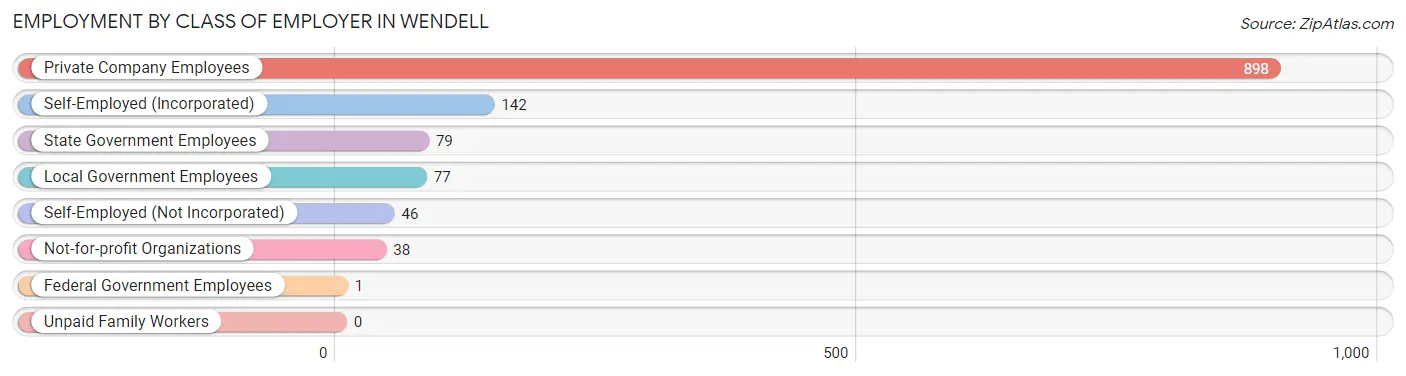
| Employer Class | # Employees | % Employees |
| Private Company Employees | 898 | 70.1% |
| Self-Employed (Incorporated) | 142 | 11.1% |
| Self-Employed (Not Incorporated) | 46 | 3.6% |
| Not-for-profit Organizations | 38 | 3.0% |
| Local Government Employees | 77 | 6.0% |
| State Government Employees | 79 | 6.2% |
| Federal Government Employees | 1 | 0.1% |
| Unpaid Family Workers | 0 | 0.0% |
| Total | 1,281 | 100.0% |
Employment Status by Age in Wendell
According to the labor force statistics for Wendell, out of the total population over 16 years of age (2,199), 61.5% or 1,352 individuals are in the labor force, with 2.1% or 28 of them unemployed. The age group with the highest labor force participation rate is 20 to 24 years, with 93.3% or 153 individuals in the labor force. Within the labor force, the 20 to 24 years age range has the highest percentage of unemployed individuals, with 12.4% or 19 of them being unemployed.
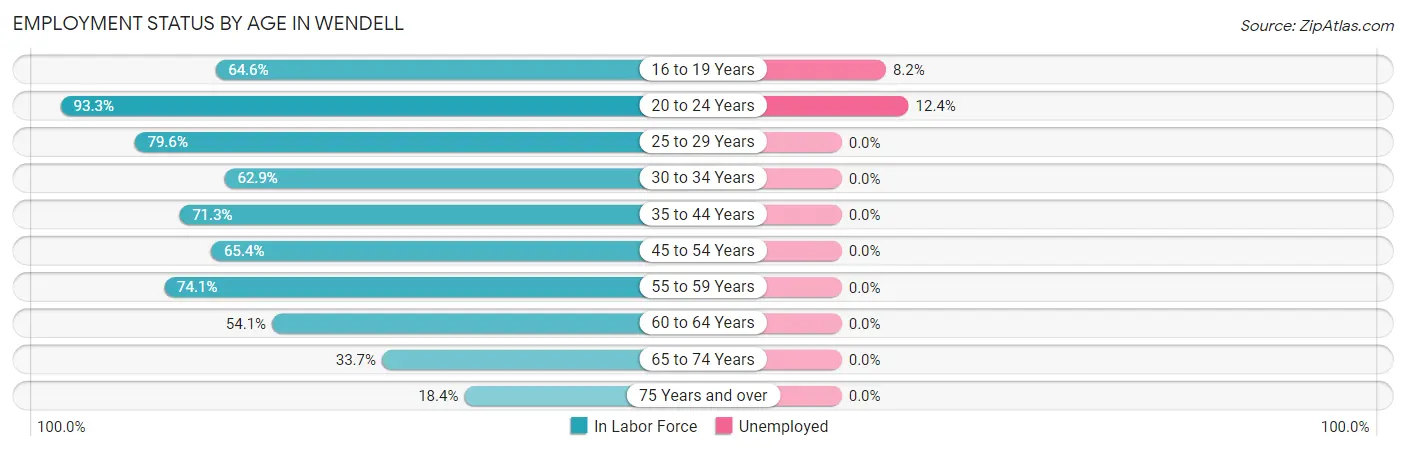
| Age Bracket | In Labor Force | Unemployed |
| 16 to 19 Years | 122 (64.6%) | 10 (8.2%) |
| 20 to 24 Years | 153 (93.3%) | 19 (12.4%) |
| 25 to 29 Years | 121 (79.6%) | 0 (0.0%) |
| 30 to 34 Years | 168 (62.9%) | 0 (0.0%) |
| 35 to 44 Years | 239 (71.3%) | 0 (0.0%) |
| 45 to 54 Years | 155 (65.4%) | 0 (0.0%) |
| 55 to 59 Years | 157 (74.1%) | 0 (0.0%) |
| 60 to 64 Years | 138 (54.1%) | 0 (0.0%) |
| 65 to 74 Years | 63 (33.7%) | 0 (0.0%) |
| 75 Years and over | 37 (18.4%) | 0 (0.0%) |
| Total | 1,352 (61.5%) | 28 (2.1%) |
Employment Status by Educational Attainment in Wendell
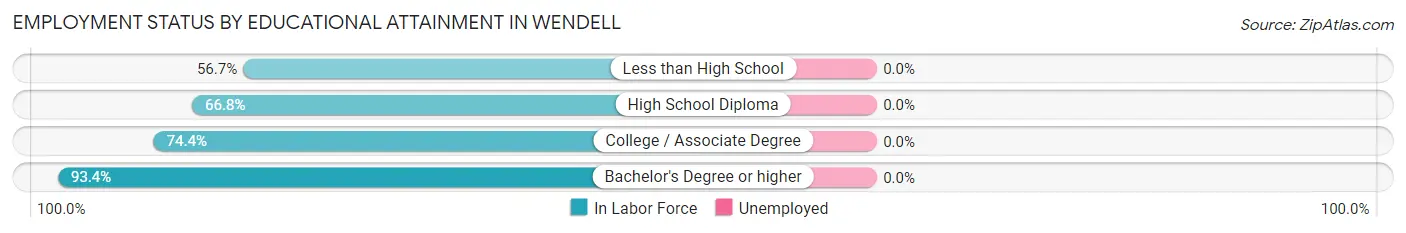
| Educational Attainment | In Labor Force | Unemployed |
| Less than High School | 358 (56.7%) | 0 (0.0%) |
| High School Diploma | 211 (66.8%) | 0 (0.0%) |
| College / Associate Degree | 268 (74.4%) | 0 (0.0%) |
| Bachelor's Degree or higher | 141 (93.4%) | 0 (0.0%) |
| Total | 978 (67.1%) | 0 (0.0%) |
Employment Occupations by Sex in Wendell
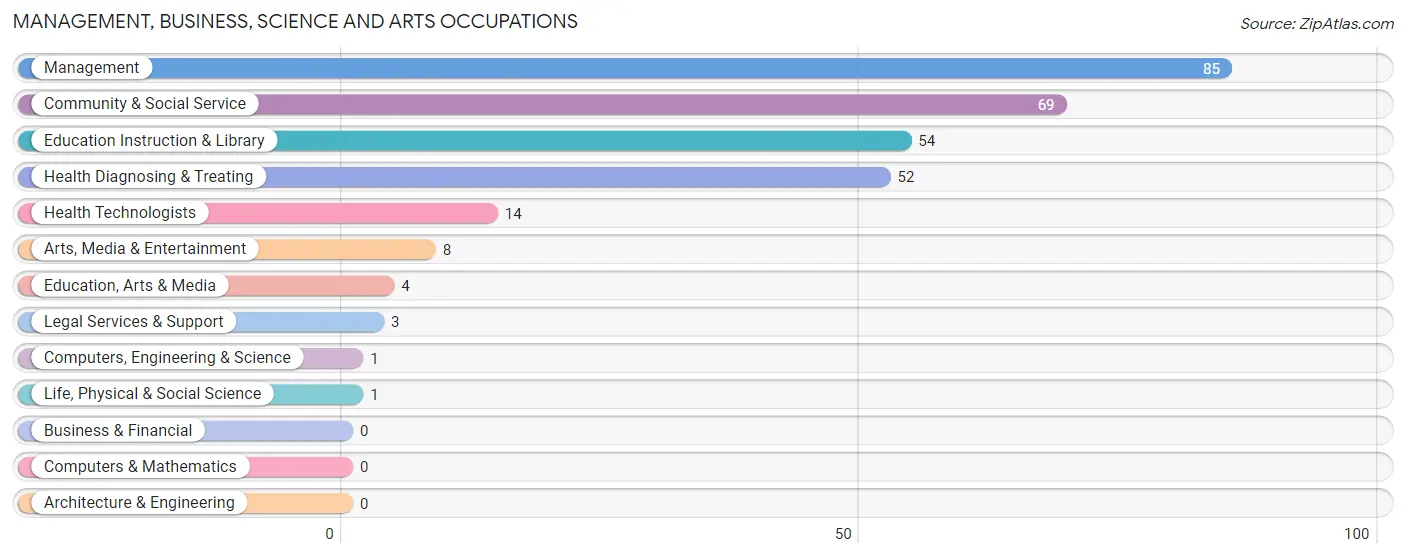
Management, Business, Science and Arts Occupations
The most common Management, Business, Science and Arts occupations in Wendell are Management (85 | 6.4%), Community & Social Service (69 | 5.2%), Education Instruction & Library (54 | 4.1%), Health Diagnosing & Treating (52 | 3.9%), and Health Technologists (14 | 1.1%).
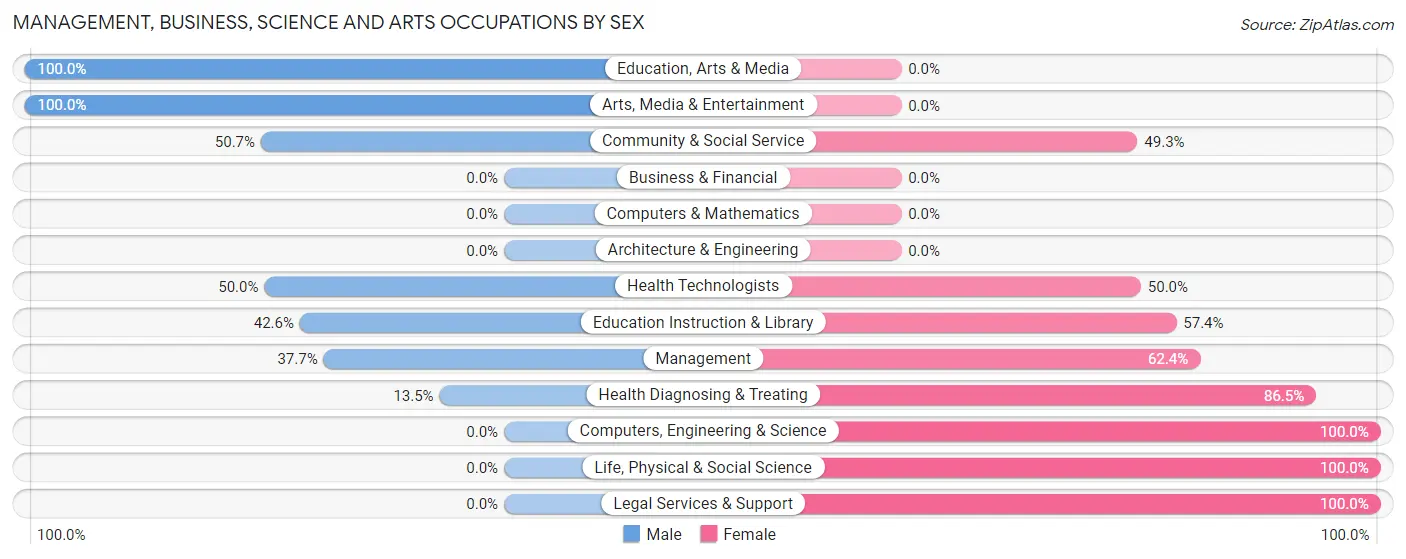
Management, Business, Science and Arts Occupations by Sex
Within the Management, Business, Science and Arts occupations in Wendell, the most male-oriented occupations are Education, Arts & Media (100.0%), Arts, Media & Entertainment (100.0%), and Community & Social Service (50.7%), while the most female-oriented occupations are Computers, Engineering & Science (100.0%), Life, Physical & Social Science (100.0%), and Legal Services & Support (100.0%).
| Occupation | Male | Female |
| Management | 32 (37.7%) | 53 (62.4%) |
| Business & Financial | 0 (0.0%) | 0 (0.0%) |
| Computers, Engineering & Science | 0 (0.0%) | 1 (100.0%) |
| Computers & Mathematics | 0 (0.0%) | 0 (0.0%) |
| Architecture & Engineering | 0 (0.0%) | 0 (0.0%) |
| Life, Physical & Social Science | 0 (0.0%) | 1 (100.0%) |
| Community & Social Service | 35 (50.7%) | 34 (49.3%) |
| Education, Arts & Media | 4 (100.0%) | 0 (0.0%) |
| Legal Services & Support | 0 (0.0%) | 3 (100.0%) |
| Education Instruction & Library | 23 (42.6%) | 31 (57.4%) |
| Arts, Media & Entertainment | 8 (100.0%) | 0 (0.0%) |
| Health Diagnosing & Treating | 7 (13.5%) | 45 (86.5%) |
| Health Technologists | 7 (50.0%) | 7 (50.0%) |
| Total (Category) | 74 (35.7%) | 133 (64.2%) |
| Total (Overall) | 823 (62.2%) | 501 (37.8%) |
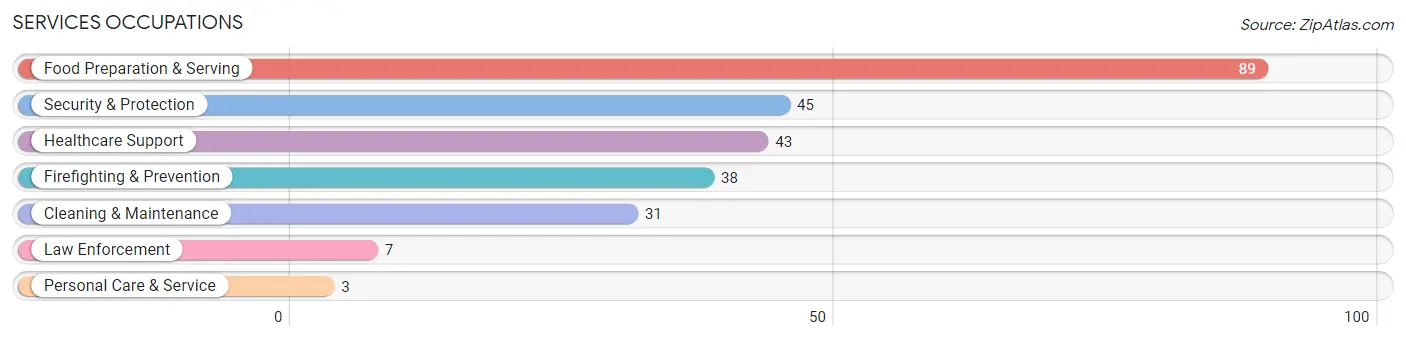
Services Occupations
The most common Services occupations in Wendell are Food Preparation & Serving (89 | 6.7%), Security & Protection (45 | 3.4%), Healthcare Support (43 | 3.3%), Firefighting & Prevention (38 | 2.9%), and Cleaning & Maintenance (31 | 2.3%).
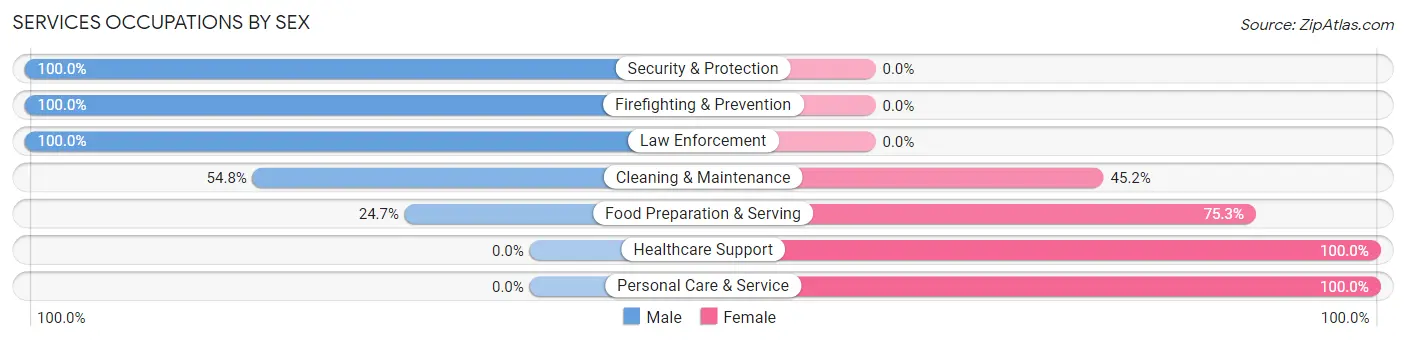
Services Occupations by Sex
Within the Services occupations in Wendell, the most male-oriented occupations are Security & Protection (100.0%), Firefighting & Prevention (100.0%), and Law Enforcement (100.0%), while the most female-oriented occupations are Healthcare Support (100.0%), Personal Care & Service (100.0%), and Food Preparation & Serving (75.3%).
| Occupation | Male | Female |
| Healthcare Support | 0 (0.0%) | 43 (100.0%) |
| Security & Protection | 45 (100.0%) | 0 (0.0%) |
| Firefighting & Prevention | 38 (100.0%) | 0 (0.0%) |
| Law Enforcement | 7 (100.0%) | 0 (0.0%) |
| Food Preparation & Serving | 22 (24.7%) | 67 (75.3%) |
| Cleaning & Maintenance | 17 (54.8%) | 14 (45.2%) |
| Personal Care & Service | 0 (0.0%) | 3 (100.0%) |
| Total (Category) | 84 (39.8%) | 127 (60.2%) |
| Total (Overall) | 823 (62.2%) | 501 (37.8%) |
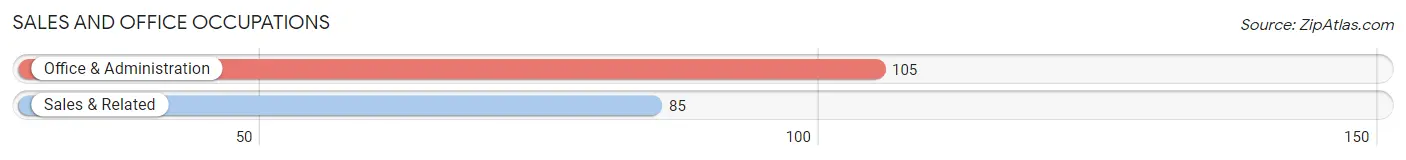
Sales and Office Occupations
The most common Sales and Office occupations in Wendell are Office & Administration (105 | 7.9%), and Sales & Related (85 | 6.4%).
Sales and Office Occupations by Sex
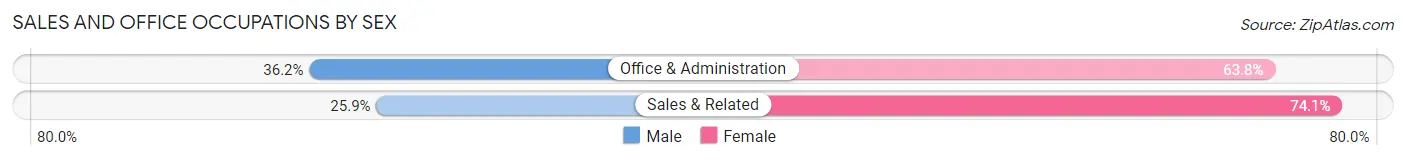
| Occupation | Male | Female |
| Sales & Related | 22 (25.9%) | 63 (74.1%) |
| Office & Administration | 38 (36.2%) | 67 (63.8%) |
| Total (Category) | 60 (31.6%) | 130 (68.4%) |
| Total (Overall) | 823 (62.2%) | 501 (37.8%) |
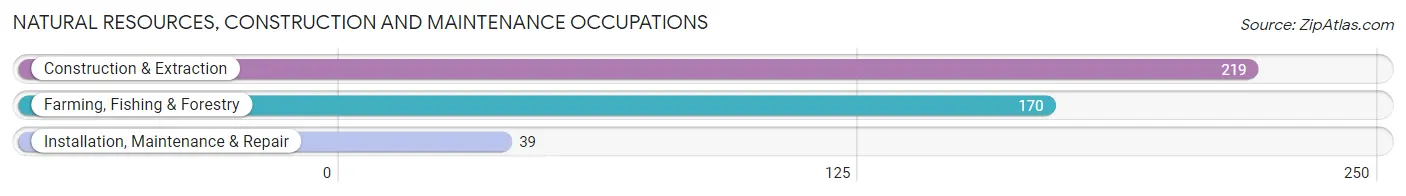
Natural Resources, Construction and Maintenance Occupations
The most common Natural Resources, Construction and Maintenance occupations in Wendell are Construction & Extraction (219 | 16.5%), Farming, Fishing & Forestry (170 | 12.8%), and Installation, Maintenance & Repair (39 | 2.9%).
Natural Resources, Construction and Maintenance Occupations by Sex
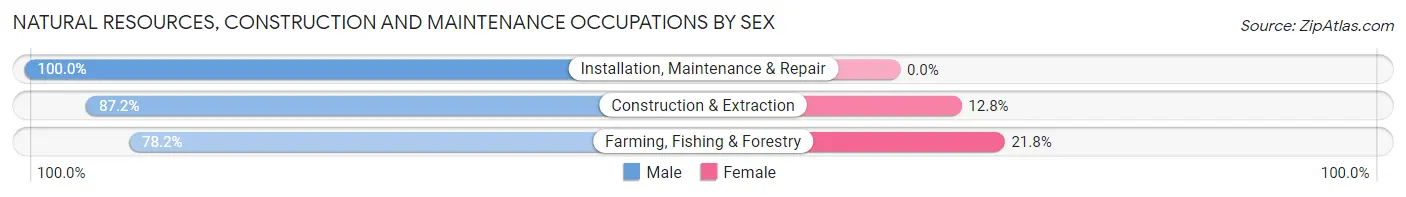
| Occupation | Male | Female |
| Farming, Fishing & Forestry | 133 (78.2%) | 37 (21.8%) |
| Construction & Extraction | 191 (87.2%) | 28 (12.8%) |
| Installation, Maintenance & Repair | 39 (100.0%) | 0 (0.0%) |
| Total (Category) | 363 (84.8%) | 65 (15.2%) |
| Total (Overall) | 823 (62.2%) | 501 (37.8%) |
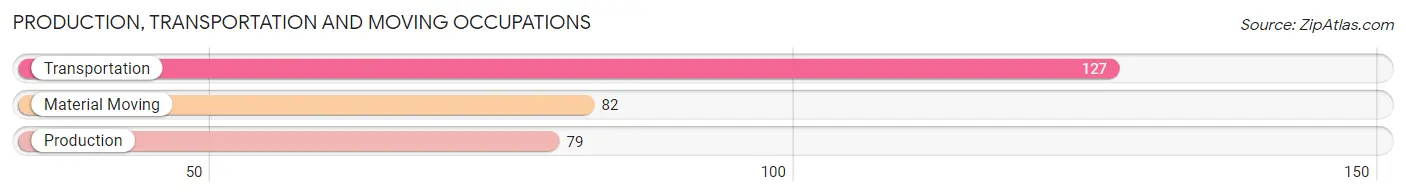
Production, Transportation and Moving Occupations
The most common Production, Transportation and Moving occupations in Wendell are Transportation (127 | 9.6%), Material Moving (82 | 6.2%), and Production (79 | 6.0%).
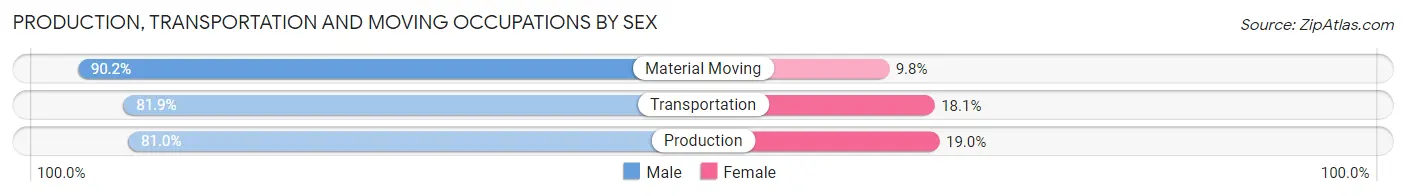
Production, Transportation and Moving Occupations by Sex
| Occupation | Male | Female |
| Production | 64 (81.0%) | 15 (19.0%) |
| Transportation | 104 (81.9%) | 23 (18.1%) |
| Material Moving | 74 (90.2%) | 8 (9.8%) |
| Total (Category) | 242 (84.0%) | 46 (16.0%) |
| Total (Overall) | 823 (62.2%) | 501 (37.8%) |
Employment Industries by Sex in Wendell
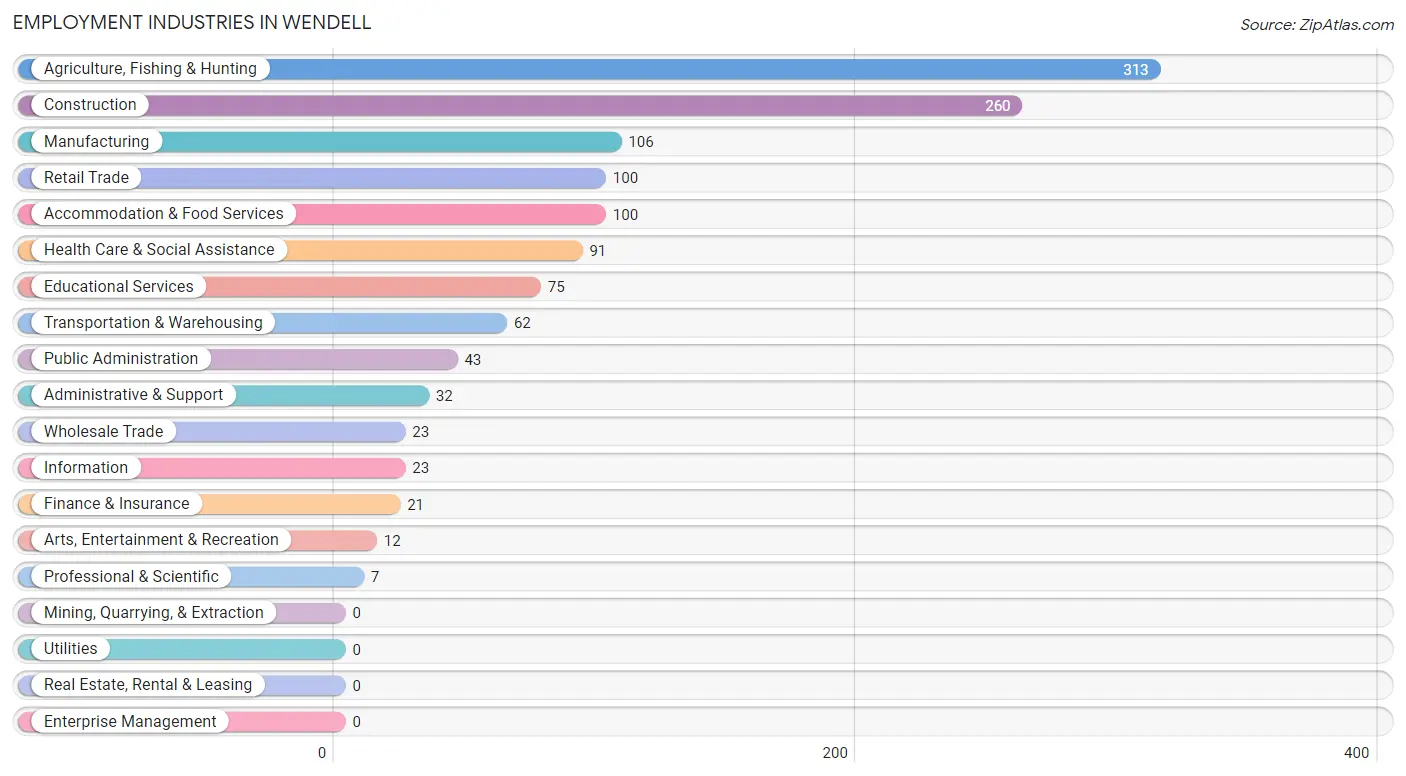
Employment Industries in Wendell
The major employment industries in Wendell include Agriculture, Fishing & Hunting (313 | 23.6%), Construction (260 | 19.6%), Manufacturing (106 | 8.0%), Retail Trade (100 | 7.5%), and Accommodation & Food Services (100 | 7.5%).
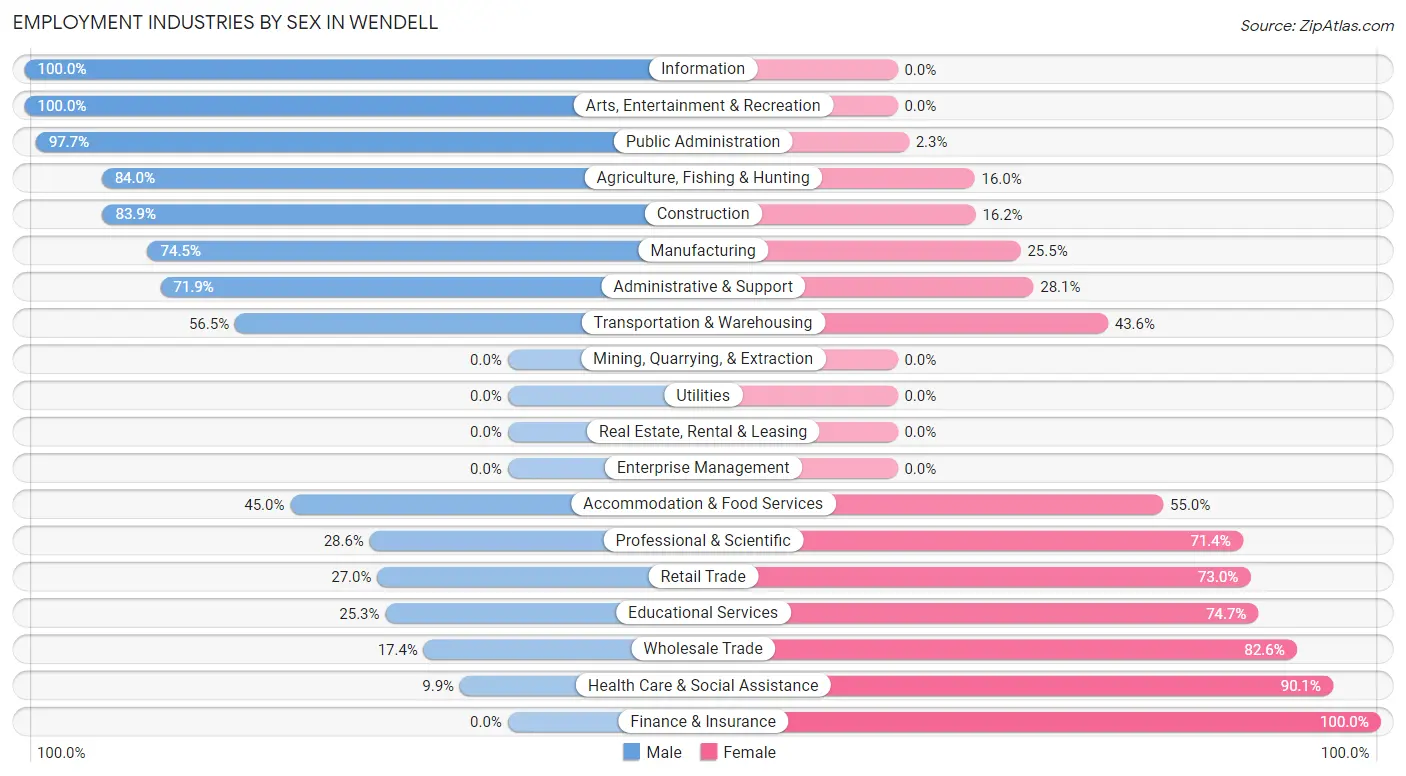
Employment Industries by Sex in Wendell
The Wendell industries that see more men than women are Information (100.0%), Arts, Entertainment & Recreation (100.0%), and Public Administration (97.7%), whereas the industries that tend to have a higher number of women are Finance & Insurance (100.0%), Health Care & Social Assistance (90.1%), and Wholesale Trade (82.6%).
| Industry | Male | Female |
| Agriculture, Fishing & Hunting | 263 (84.0%) | 50 (16.0%) |
| Mining, Quarrying, & Extraction | 0 (0.0%) | 0 (0.0%) |
| Construction | 218 (83.9%) | 42 (16.2%) |
| Manufacturing | 79 (74.5%) | 27 (25.5%) |
| Wholesale Trade | 4 (17.4%) | 19 (82.6%) |
| Retail Trade | 27 (27.0%) | 73 (73.0%) |
| Transportation & Warehousing | 35 (56.5%) | 27 (43.5%) |
| Utilities | 0 (0.0%) | 0 (0.0%) |
| Information | 23 (100.0%) | 0 (0.0%) |
| Finance & Insurance | 0 (0.0%) | 21 (100.0%) |
| Real Estate, Rental & Leasing | 0 (0.0%) | 0 (0.0%) |
| Professional & Scientific | 2 (28.6%) | 5 (71.4%) |
| Enterprise Management | 0 (0.0%) | 0 (0.0%) |
| Administrative & Support | 23 (71.9%) | 9 (28.1%) |
| Educational Services | 19 (25.3%) | 56 (74.7%) |
| Health Care & Social Assistance | 9 (9.9%) | 82 (90.1%) |
| Arts, Entertainment & Recreation | 12 (100.0%) | 0 (0.0%) |
| Accommodation & Food Services | 45 (45.0%) | 55 (55.0%) |
| Public Administration | 42 (97.7%) | 1 (2.3%) |
| Total | 823 (62.2%) | 501 (37.8%) |
Education in Wendell
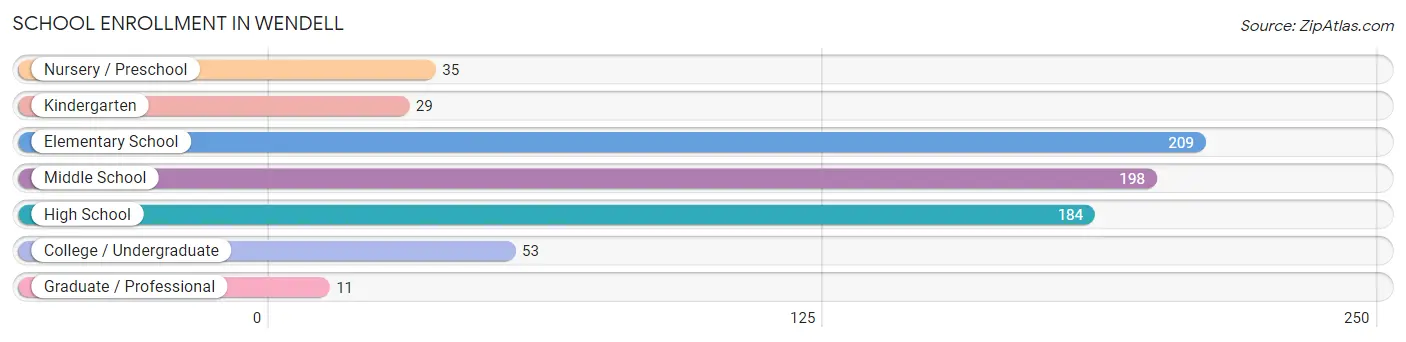
School Enrollment in Wendell
The most common levels of schooling among the 719 students in Wendell are elementary school (209 | 29.1%), middle school (198 | 27.5%), and high school (184 | 25.6%).
| School Level | # Students | % Students |
| Nursery / Preschool | 35 | 4.9% |
| Kindergarten | 29 | 4.0% |
| Elementary School | 209 | 29.1% |
| Middle School | 198 | 27.5% |
| High School | 184 | 25.6% |
| College / Undergraduate | 53 | 7.4% |
| Graduate / Professional | 11 | 1.5% |
| Total | 719 | 100.0% |
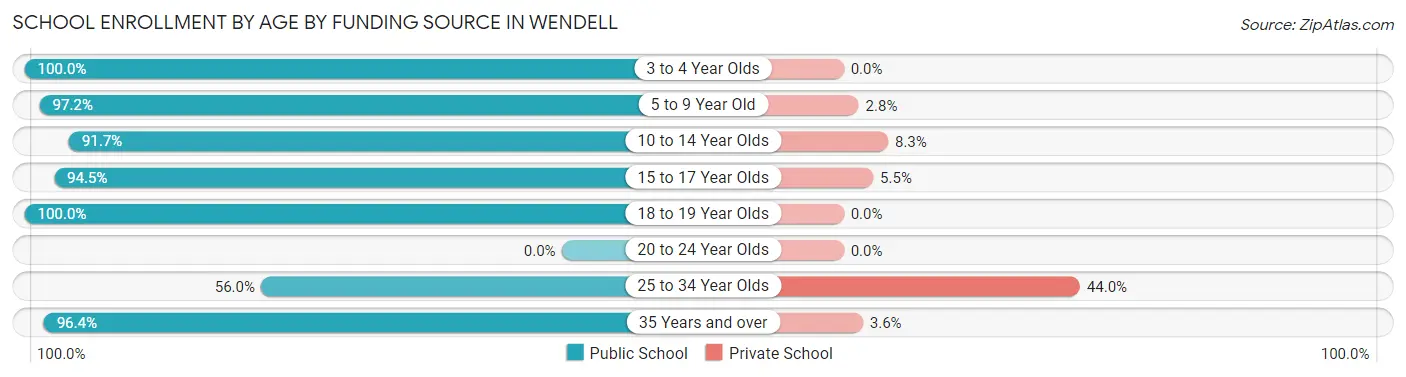
School Enrollment by Age by Funding Source in Wendell
Out of a total of 719 students who are enrolled in schools in Wendell, 46 (6.4%) attend a private institution, while the remaining 673 (93.6%) are enrolled in public schools. The age group of 25 to 34 year olds has the highest likelihood of being enrolled in private schools, with 11 (44.0% in the age bracket) enrolled. Conversely, the age group of 3 to 4 year olds has the lowest likelihood of being enrolled in a private school, with 31 (100.0% in the age bracket) attending a public institution.
| Age Bracket | Public School | Private School |
| 3 to 4 Year Olds | 31 (100.0%) | 0 (0.0%) |
| 5 to 9 Year Old | 209 (97.2%) | 6 (2.8%) |
| 10 to 14 Year Olds | 211 (91.7%) | 19 (8.3%) |
| 15 to 17 Year Olds | 155 (94.5%) | 9 (5.5%) |
| 18 to 19 Year Olds | 26 (100.0%) | 0 (0.0%) |
| 20 to 24 Year Olds | 0 (0.0%) | 0 (0.0%) |
| 25 to 34 Year Olds | 14 (56.0%) | 11 (44.0%) |
| 35 Years and over | 27 (96.4%) | 1 (3.6%) |
| Total | 673 (93.6%) | 46 (6.4%) |
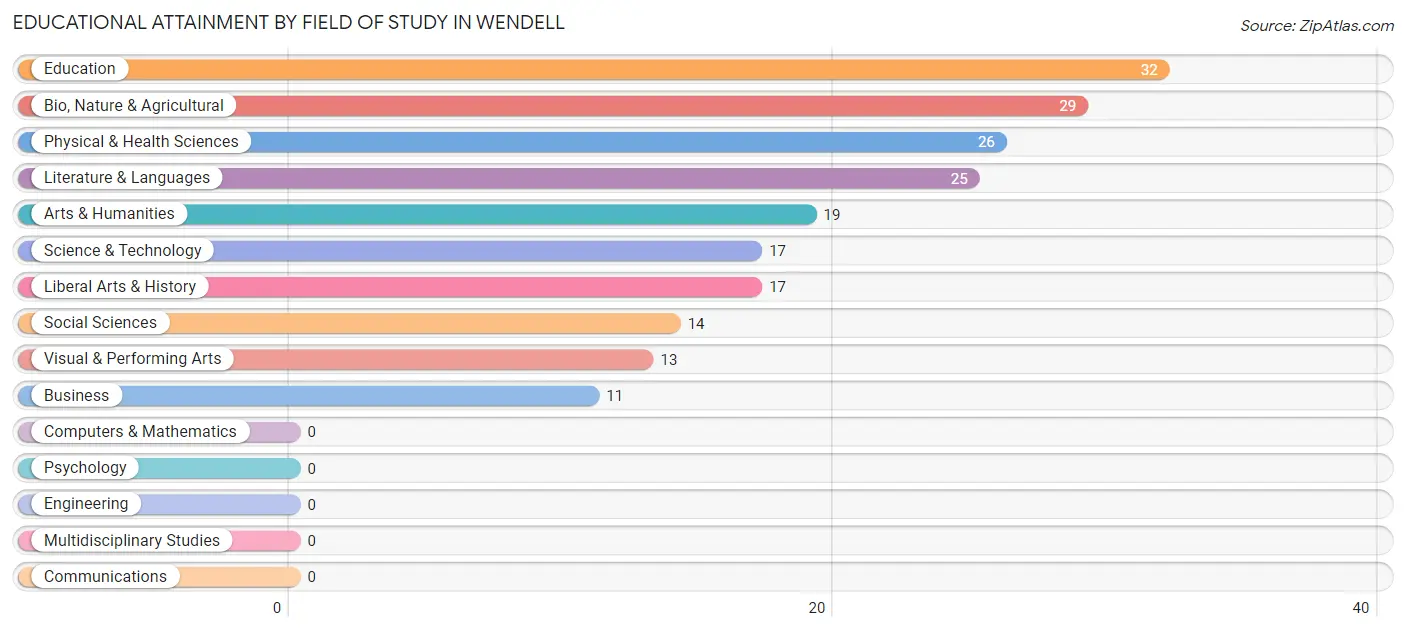
Educational Attainment by Field of Study in Wendell
Education (32 | 15.8%), bio, nature & agricultural (29 | 14.3%), physical & health sciences (26 | 12.8%), literature & languages (25 | 12.3%), and arts & humanities (19 | 9.4%) are the most common fields of study among 203 individuals in Wendell who have obtained a bachelor's degree or higher.
| Field of Study | # Graduates | % Graduates |
| Computers & Mathematics | 0 | 0.0% |
| Bio, Nature & Agricultural | 29 | 14.3% |
| Physical & Health Sciences | 26 | 12.8% |
| Psychology | 0 | 0.0% |
| Social Sciences | 14 | 6.9% |
| Engineering | 0 | 0.0% |
| Multidisciplinary Studies | 0 | 0.0% |
| Science & Technology | 17 | 8.4% |
| Business | 11 | 5.4% |
| Education | 32 | 15.8% |
| Literature & Languages | 25 | 12.3% |
| Liberal Arts & History | 17 | 8.4% |
| Visual & Performing Arts | 13 | 6.4% |
| Communications | 0 | 0.0% |
| Arts & Humanities | 19 | 9.4% |
| Total | 203 | 100.0% |
Transportation & Commute in Wendell
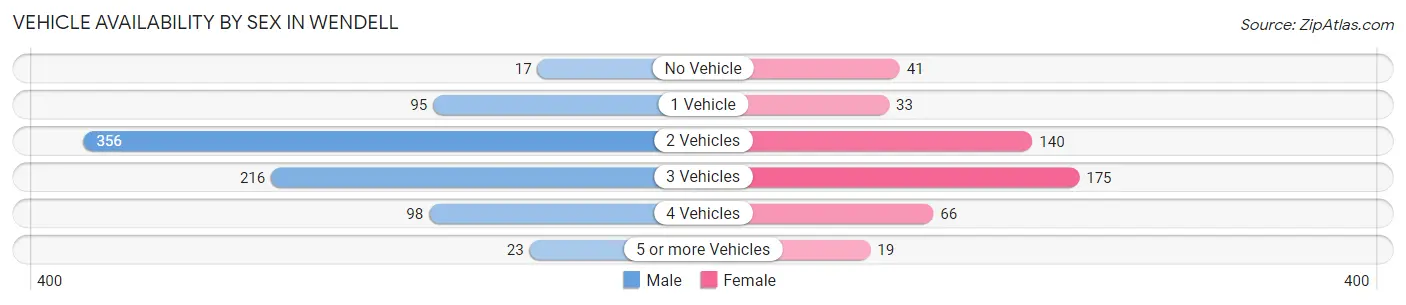
Vehicle Availability by Sex in Wendell
The most prevalent vehicle ownership categories in Wendell are males with 2 vehicles (356, accounting for 44.2%) and females with 2 vehicles (140, making up 75.1%).
| Vehicles Available | Male | Female |
| No Vehicle | 17 (2.1%) | 41 (8.6%) |
| 1 Vehicle | 95 (11.8%) | 33 (7.0%) |
| 2 Vehicles | 356 (44.2%) | 140 (29.5%) |
| 3 Vehicles | 216 (26.8%) | 175 (36.9%) |
| 4 Vehicles | 98 (12.2%) | 66 (13.9%) |
| 5 or more Vehicles | 23 (2.9%) | 19 (4.0%) |
| Total | 805 (100.0%) | 474 (100.0%) |
Commute Time in Wendell
The most frequently occuring commute durations in Wendell are 20 to 24 minutes (328 commuters, 26.7%), 30 to 34 minutes (217 commuters, 17.6%), and less than 5 minutes (165 commuters, 13.4%).
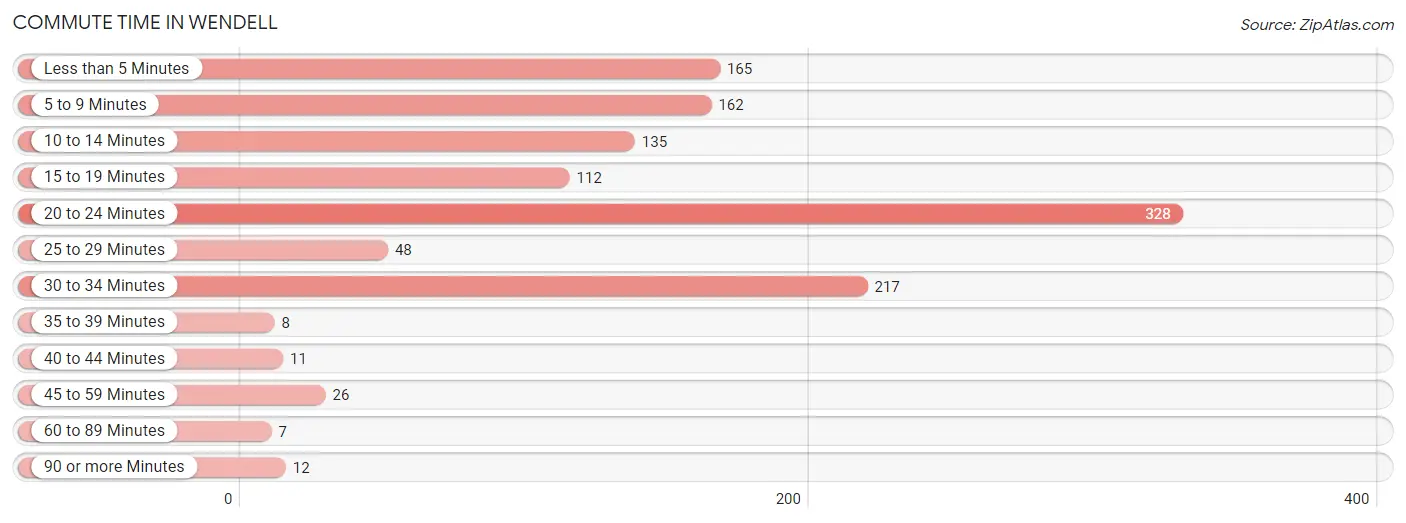
| Commute Time | # Commuters | % Commuters |
| Less than 5 Minutes | 165 | 13.4% |
| 5 to 9 Minutes | 162 | 13.2% |
| 10 to 14 Minutes | 135 | 11.0% |
| 15 to 19 Minutes | 112 | 9.1% |
| 20 to 24 Minutes | 328 | 26.7% |
| 25 to 29 Minutes | 48 | 3.9% |
| 30 to 34 Minutes | 217 | 17.6% |
| 35 to 39 Minutes | 8 | 0.6% |
| 40 to 44 Minutes | 11 | 0.9% |
| 45 to 59 Minutes | 26 | 2.1% |
| 60 to 89 Minutes | 7 | 0.6% |
| 90 or more Minutes | 12 | 1.0% |
Commute Time by Sex in Wendell
The most common commute times in Wendell are 20 to 24 minutes (215 commuters, 27.3%) for males and 20 to 24 minutes (113 commuters, 25.5%) for females.
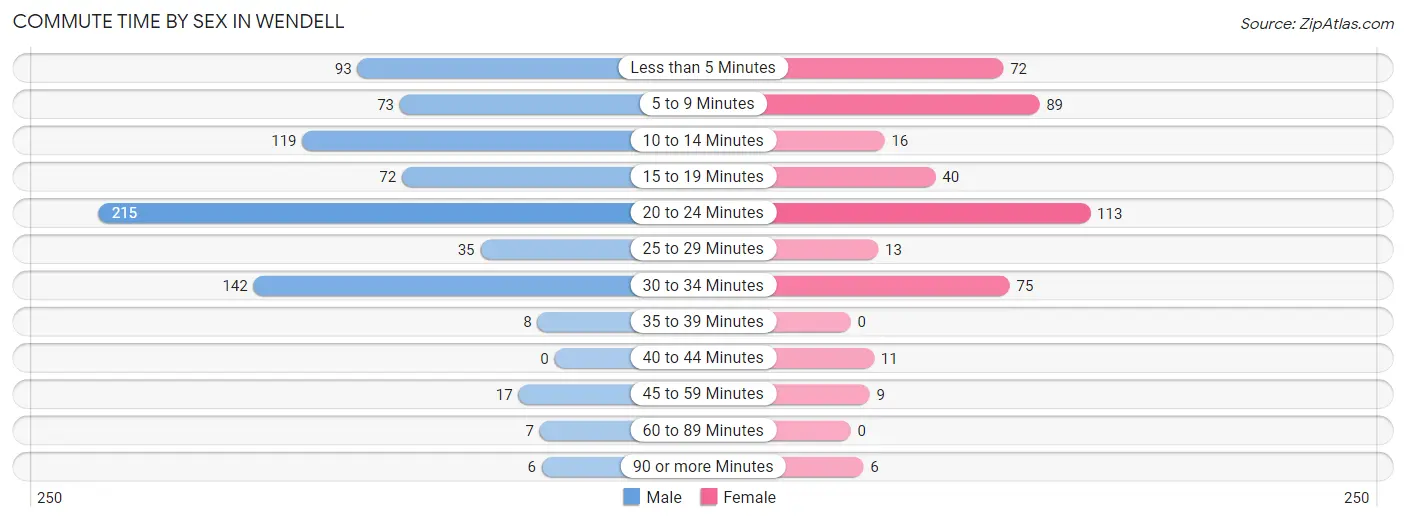
| Commute Time | Male | Female |
| Less than 5 Minutes | 93 (11.8%) | 72 (16.2%) |
| 5 to 9 Minutes | 73 (9.3%) | 89 (20.1%) |
| 10 to 14 Minutes | 119 (15.1%) | 16 (3.6%) |
| 15 to 19 Minutes | 72 (9.1%) | 40 (9.0%) |
| 20 to 24 Minutes | 215 (27.3%) | 113 (25.5%) |
| 25 to 29 Minutes | 35 (4.4%) | 13 (2.9%) |
| 30 to 34 Minutes | 142 (18.0%) | 75 (16.9%) |
| 35 to 39 Minutes | 8 (1.0%) | 0 (0.0%) |
| 40 to 44 Minutes | 0 (0.0%) | 11 (2.5%) |
| 45 to 59 Minutes | 17 (2.2%) | 9 (2.0%) |
| 60 to 89 Minutes | 7 (0.9%) | 0 (0.0%) |
| 90 or more Minutes | 6 (0.8%) | 6 (1.3%) |
Time of Departure to Work by Sex in Wendell
The most frequent times of departure to work in Wendell are 6:00 AM to 6:29 AM (140, 17.8%) for males and 7:00 AM to 7:29 AM (66, 14.9%) for females.
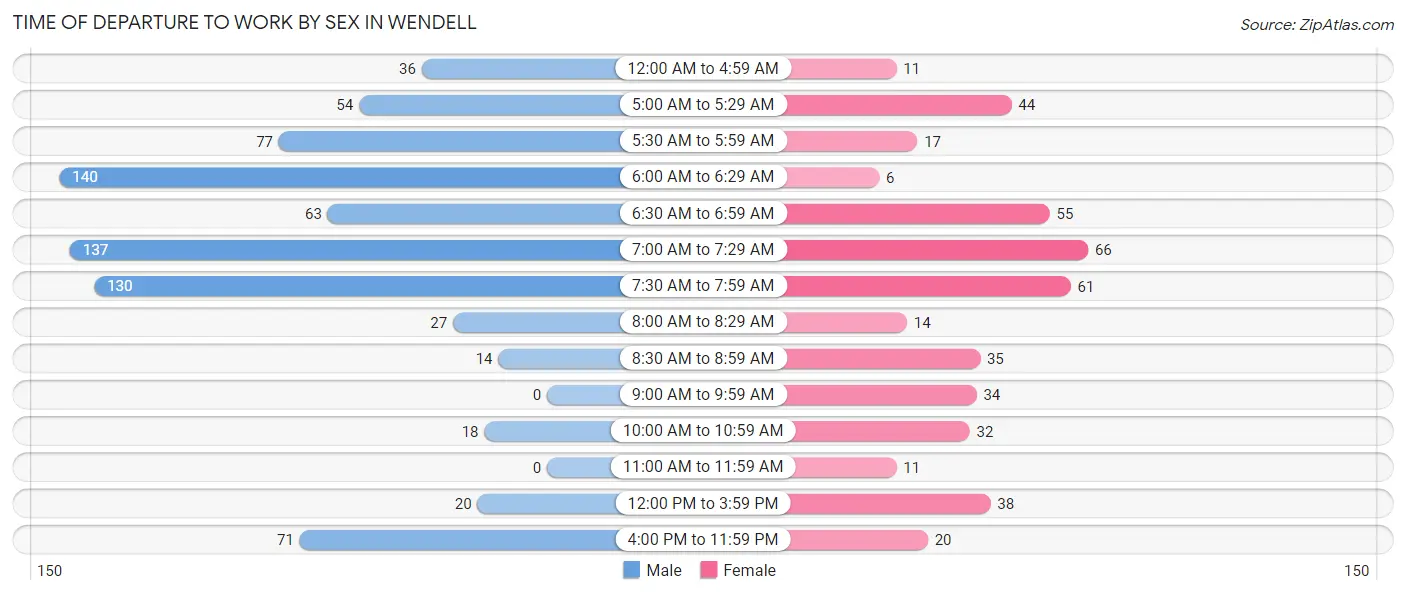
| Time of Departure | Male | Female |
| 12:00 AM to 4:59 AM | 36 (4.6%) | 11 (2.5%) |
| 5:00 AM to 5:29 AM | 54 (6.9%) | 44 (9.9%) |
| 5:30 AM to 5:59 AM | 77 (9.8%) | 17 (3.8%) |
| 6:00 AM to 6:29 AM | 140 (17.8%) | 6 (1.3%) |
| 6:30 AM to 6:59 AM | 63 (8.0%) | 55 (12.4%) |
| 7:00 AM to 7:29 AM | 137 (17.4%) | 66 (14.9%) |
| 7:30 AM to 7:59 AM | 130 (16.5%) | 61 (13.7%) |
| 8:00 AM to 8:29 AM | 27 (3.4%) | 14 (3.2%) |
| 8:30 AM to 8:59 AM | 14 (1.8%) | 35 (7.9%) |
| 9:00 AM to 9:59 AM | 0 (0.0%) | 34 (7.7%) |
| 10:00 AM to 10:59 AM | 18 (2.3%) | 32 (7.2%) |
| 11:00 AM to 11:59 AM | 0 (0.0%) | 11 (2.5%) |
| 12:00 PM to 3:59 PM | 20 (2.5%) | 38 (8.6%) |
| 4:00 PM to 11:59 PM | 71 (9.0%) | 20 (4.5%) |
| Total | 787 (100.0%) | 444 (100.0%) |
Housing Occupancy in Wendell
Occupancy by Ownership in Wendell
Of the total 953 dwellings in Wendell, owner-occupied units account for 649 (68.1%), while renter-occupied units make up 304 (31.9%).
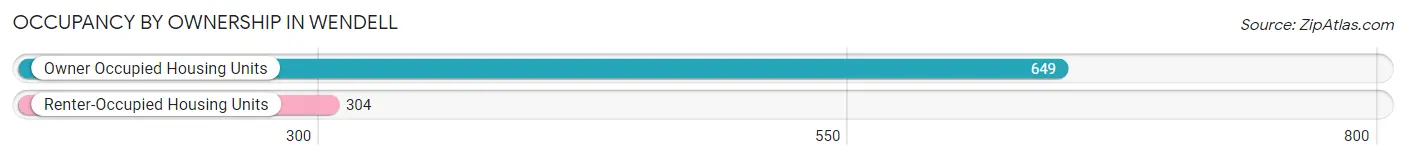
| Occupancy | # Housing Units | % Housing Units |
| Owner Occupied Housing Units | 649 | 68.1% |
| Renter-Occupied Housing Units | 304 | 31.9% |
| Total Occupied Housing Units | 953 | 100.0% |
Occupancy by Household Size in Wendell
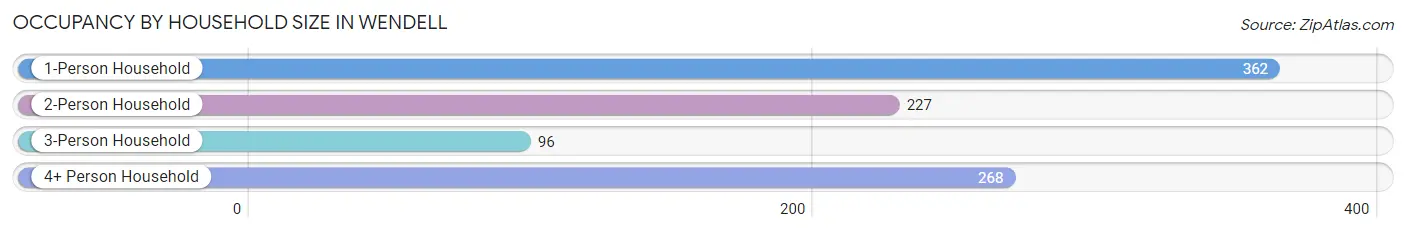
| Household Size | # Housing Units | % Housing Units |
| 1-Person Household | 362 | 38.0% |
| 2-Person Household | 227 | 23.8% |
| 3-Person Household | 96 | 10.1% |
| 4+ Person Household | 268 | 28.1% |
| Total Housing Units | 953 | 100.0% |
Occupancy by Ownership by Household Size in Wendell
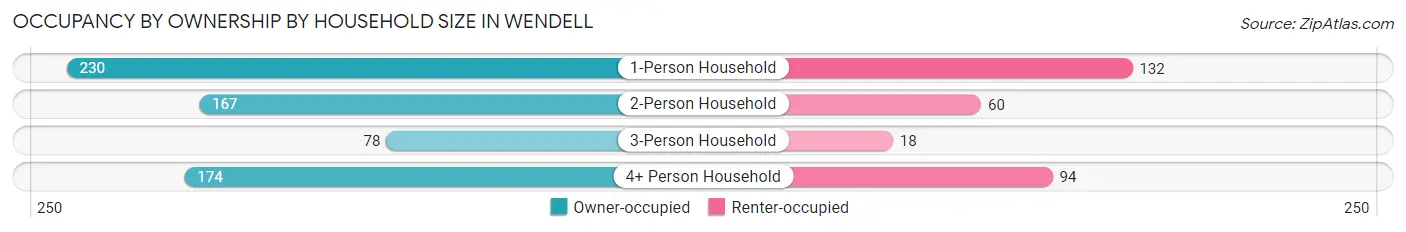
| Household Size | Owner-occupied | Renter-occupied |
| 1-Person Household | 230 (63.5%) | 132 (36.5%) |
| 2-Person Household | 167 (73.6%) | 60 (26.4%) |
| 3-Person Household | 78 (81.2%) | 18 (18.8%) |
| 4+ Person Household | 174 (64.9%) | 94 (35.1%) |
| Total Housing Units | 649 (68.1%) | 304 (31.9%) |
Occupancy by Educational Attainment in Wendell
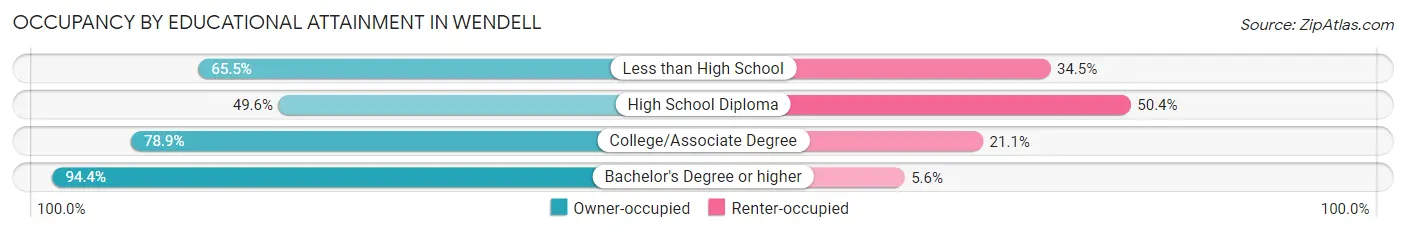
| Household Size | Owner-occupied | Renter-occupied |
| Less than High School | 211 (65.5%) | 111 (34.5%) |
| High School Diploma | 125 (49.6%) | 127 (50.4%) |
| College/Associate Degree | 228 (78.9%) | 61 (21.1%) |
| Bachelor's Degree or higher | 85 (94.4%) | 5 (5.6%) |
Occupancy by Age of Householder in Wendell
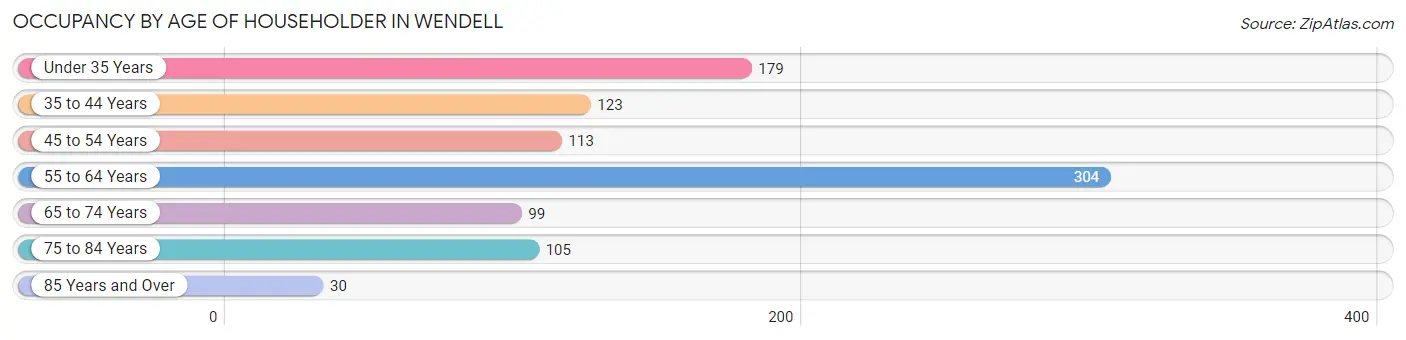
| Age Bracket | # Households | % Households |
| Under 35 Years | 179 | 18.8% |
| 35 to 44 Years | 123 | 12.9% |
| 45 to 54 Years | 113 | 11.9% |
| 55 to 64 Years | 304 | 31.9% |
| 65 to 74 Years | 99 | 10.4% |
| 75 to 84 Years | 105 | 11.0% |
| 85 Years and Over | 30 | 3.2% |
| Total | 953 | 100.0% |
Housing Finances in Wendell
Median Income by Occupancy in Wendell
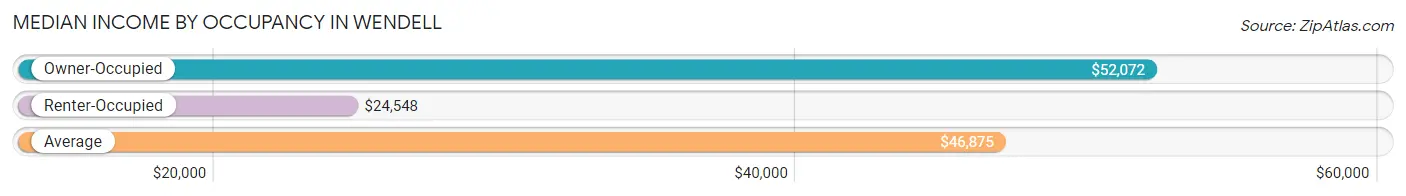
| Occupancy Type | # Households | Median Income |
| Owner-Occupied | 649 (68.1%) | $52,072 |
| Renter-Occupied | 304 (31.9%) | $24,548 |
| Average | 953 (100.0%) | $46,875 |
Occupancy by Householder Income Bracket in Wendell
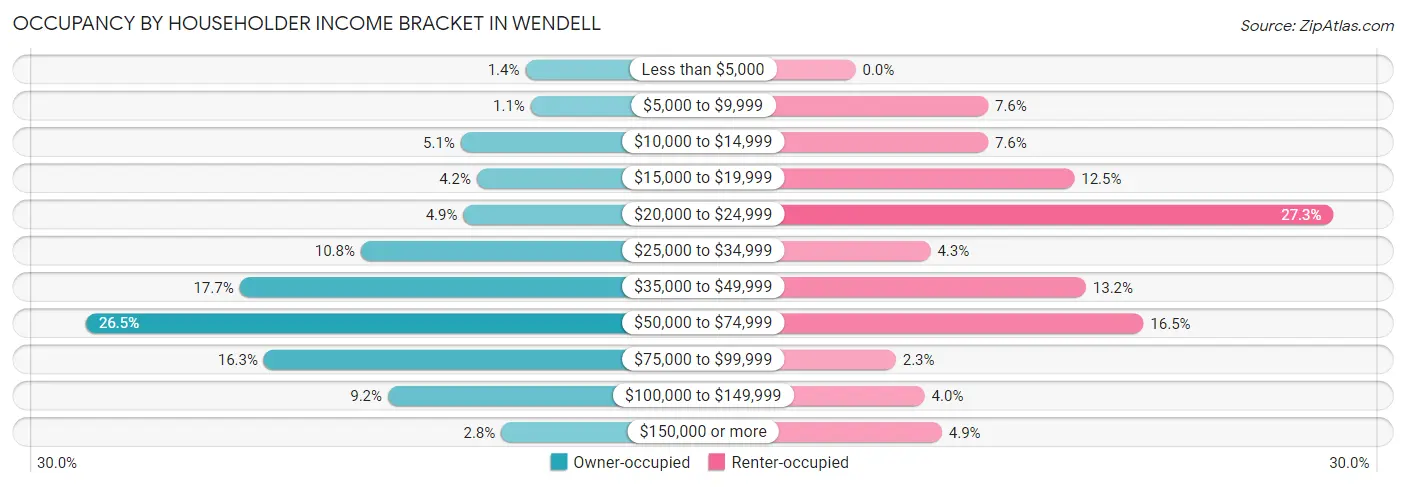
| Income Bracket | Owner-occupied | Renter-occupied |
| Less than $5,000 | 9 (1.4%) | 0 (0.0%) |
| $5,000 to $9,999 | 7 (1.1%) | 23 (7.6%) |
| $10,000 to $14,999 | 33 (5.1%) | 23 (7.6%) |
| $15,000 to $19,999 | 27 (4.2%) | 38 (12.5%) |
| $20,000 to $24,999 | 32 (4.9%) | 83 (27.3%) |
| $25,000 to $34,999 | 70 (10.8%) | 13 (4.3%) |
| $35,000 to $49,999 | 115 (17.7%) | 40 (13.2%) |
| $50,000 to $74,999 | 172 (26.5%) | 50 (16.5%) |
| $75,000 to $99,999 | 106 (16.3%) | 7 (2.3%) |
| $100,000 to $149,999 | 60 (9.2%) | 12 (4.0%) |
| $150,000 or more | 18 (2.8%) | 15 (4.9%) |
| Total | 649 (100.0%) | 304 (100.0%) |
Monthly Housing Cost Tiers in Wendell
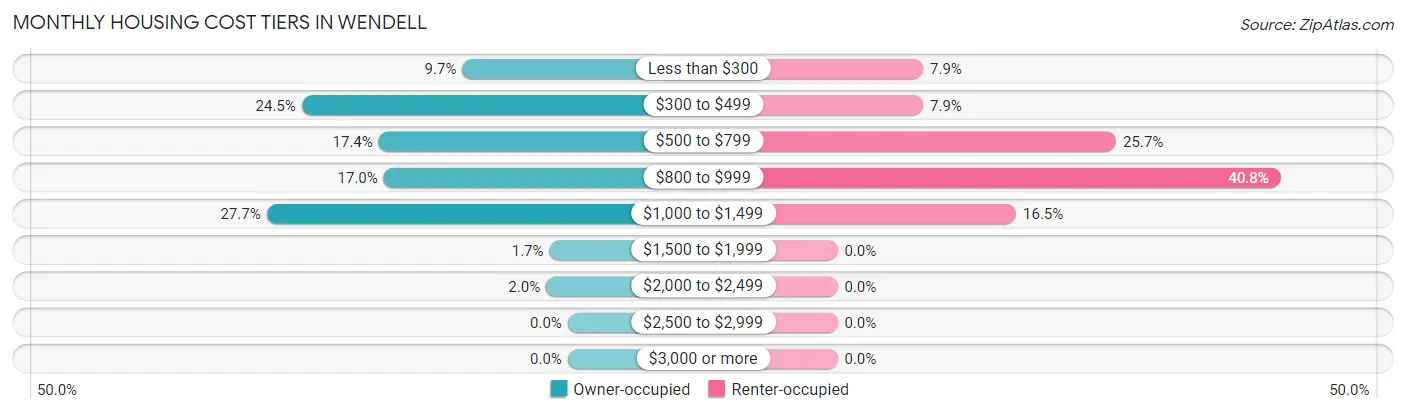
| Monthly Cost | Owner-occupied | Renter-occupied |
| Less than $300 | 63 (9.7%) | 24 (7.9%) |
| $300 to $499 | 159 (24.5%) | 24 (7.9%) |
| $500 to $799 | 113 (17.4%) | 78 (25.7%) |
| $800 to $999 | 110 (17.0%) | 124 (40.8%) |
| $1,000 to $1,499 | 180 (27.7%) | 50 (16.5%) |
| $1,500 to $1,999 | 11 (1.7%) | 0 (0.0%) |
| $2,000 to $2,499 | 13 (2.0%) | 0 (0.0%) |
| $2,500 to $2,999 | 0 (0.0%) | 0 (0.0%) |
| $3,000 or more | 0 (0.0%) | 0 (0.0%) |
| Total | 649 (100.0%) | 304 (100.0%) |
Physical Housing Characteristics in Wendell
Housing Structures in Wendell
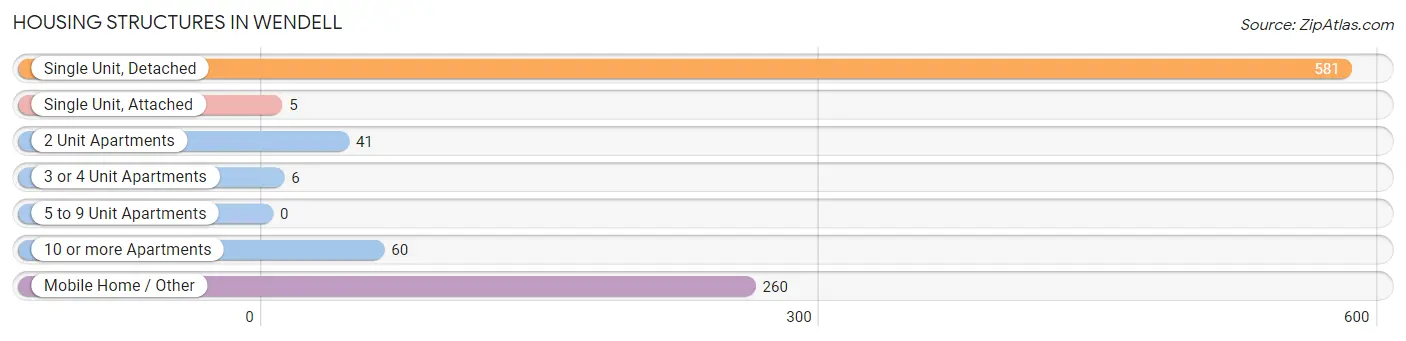
| Structure Type | # Housing Units | % Housing Units |
| Single Unit, Detached | 581 | 61.0% |
| Single Unit, Attached | 5 | 0.5% |
| 2 Unit Apartments | 41 | 4.3% |
| 3 or 4 Unit Apartments | 6 | 0.6% |
| 5 to 9 Unit Apartments | 0 | 0.0% |
| 10 or more Apartments | 60 | 6.3% |
| Mobile Home / Other | 260 | 27.3% |
| Total | 953 | 100.0% |
Housing Structures by Occupancy in Wendell
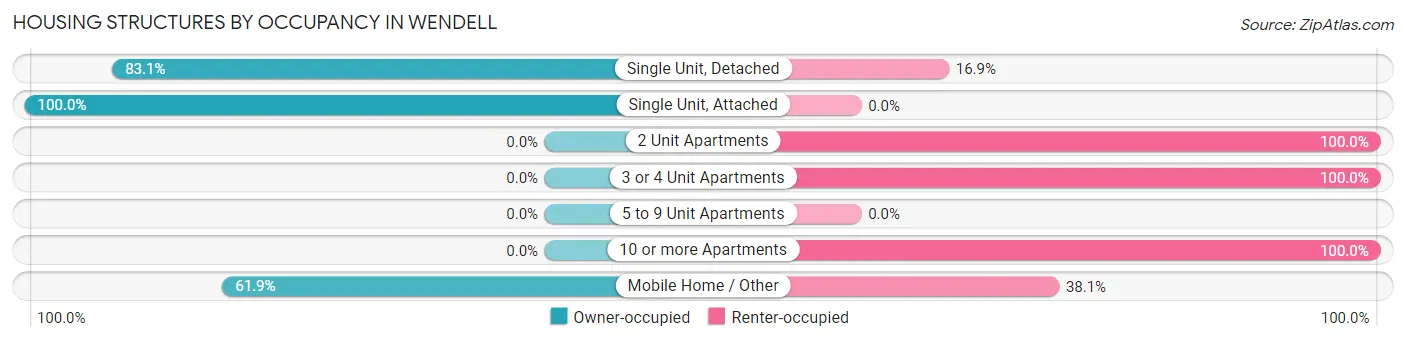
| Structure Type | Owner-occupied | Renter-occupied |
| Single Unit, Detached | 483 (83.1%) | 98 (16.9%) |
| Single Unit, Attached | 5 (100.0%) | 0 (0.0%) |
| 2 Unit Apartments | 0 (0.0%) | 41 (100.0%) |
| 3 or 4 Unit Apartments | 0 (0.0%) | 6 (100.0%) |
| 5 to 9 Unit Apartments | 0 (0.0%) | 0 (0.0%) |
| 10 or more Apartments | 0 (0.0%) | 60 (100.0%) |
| Mobile Home / Other | 161 (61.9%) | 99 (38.1%) |
| Total | 649 (68.1%) | 304 (31.9%) |
Housing Structures by Number of Rooms in Wendell
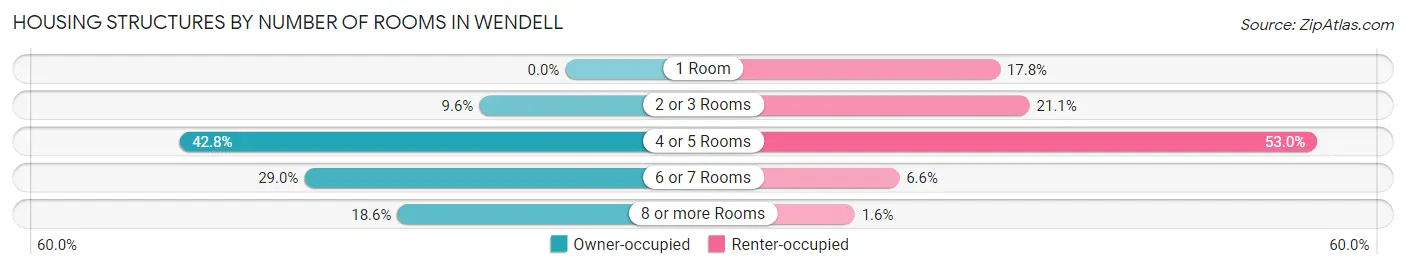
| Number of Rooms | Owner-occupied | Renter-occupied |
| 1 Room | 0 (0.0%) | 54 (17.8%) |
| 2 or 3 Rooms | 62 (9.6%) | 64 (21.0%) |
| 4 or 5 Rooms | 278 (42.8%) | 161 (53.0%) |
| 6 or 7 Rooms | 188 (29.0%) | 20 (6.6%) |
| 8 or more Rooms | 121 (18.6%) | 5 (1.6%) |
| Total | 649 (100.0%) | 304 (100.0%) |
Housing Structure by Heating Type in Wendell
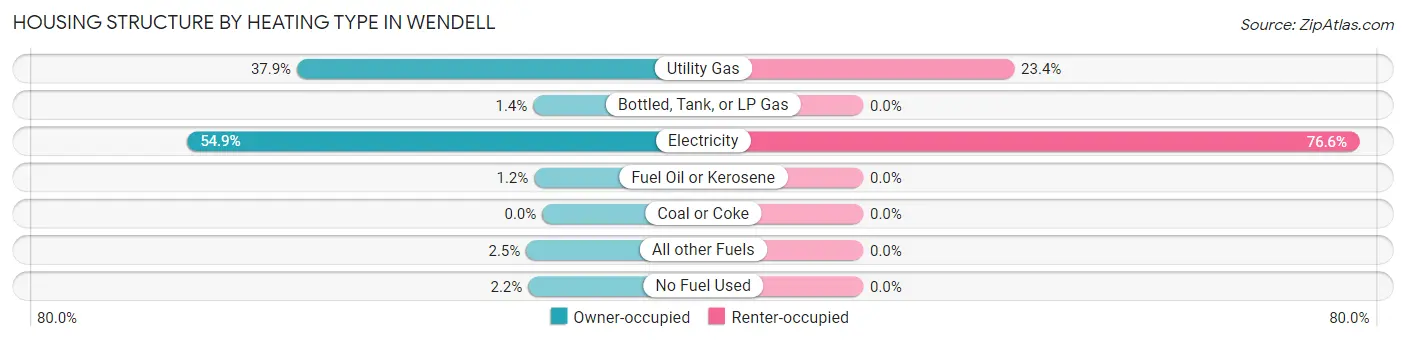
| Heating Type | Owner-occupied | Renter-occupied |
| Utility Gas | 246 (37.9%) | 71 (23.4%) |
| Bottled, Tank, or LP Gas | 9 (1.4%) | 0 (0.0%) |
| Electricity | 356 (54.8%) | 233 (76.6%) |
| Fuel Oil or Kerosene | 8 (1.2%) | 0 (0.0%) |
| Coal or Coke | 0 (0.0%) | 0 (0.0%) |
| All other Fuels | 16 (2.5%) | 0 (0.0%) |
| No Fuel Used | 14 (2.2%) | 0 (0.0%) |
| Total | 649 (100.0%) | 304 (100.0%) |
Household Vehicle Usage in Wendell
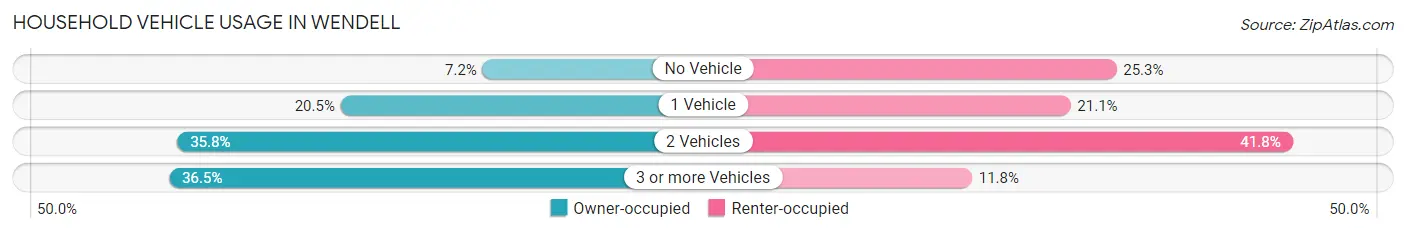
| Vehicles per Household | Owner-occupied | Renter-occupied |
| No Vehicle | 47 (7.2%) | 77 (25.3%) |
| 1 Vehicle | 133 (20.5%) | 64 (21.0%) |
| 2 Vehicles | 232 (35.7%) | 127 (41.8%) |
| 3 or more Vehicles | 237 (36.5%) | 36 (11.8%) |
| Total | 649 (100.0%) | 304 (100.0%) |
Real Estate & Mortgages in Wendell
Real Estate and Mortgage Overview in Wendell
| Characteristic | Without Mortgage | With Mortgage |
| Housing Units | 263 | 386 |
| Median Property Value | $211,600 | $175,000 |
| Median Household Income | $42,107 | $12 |
| Monthly Housing Costs | $336 | $0 |
| Real Estate Taxes | $882 | $0 |
Property Value by Mortgage Status in Wendell
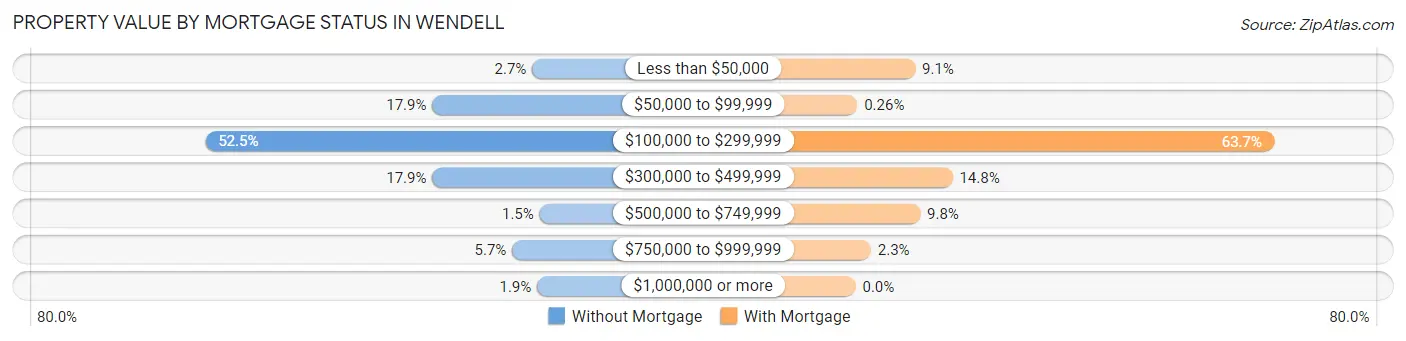
| Property Value | Without Mortgage | With Mortgage |
| Less than $50,000 | 7 (2.7%) | 35 (9.1%) |
| $50,000 to $99,999 | 47 (17.9%) | 1 (0.3%) |
| $100,000 to $299,999 | 138 (52.5%) | 246 (63.7%) |
| $300,000 to $499,999 | 47 (17.9%) | 57 (14.8%) |
| $500,000 to $749,999 | 4 (1.5%) | 38 (9.8%) |
| $750,000 to $999,999 | 15 (5.7%) | 9 (2.3%) |
| $1,000,000 or more | 5 (1.9%) | 0 (0.0%) |
| Total | 263 (100.0%) | 386 (100.0%) |
Household Income by Mortgage Status in Wendell
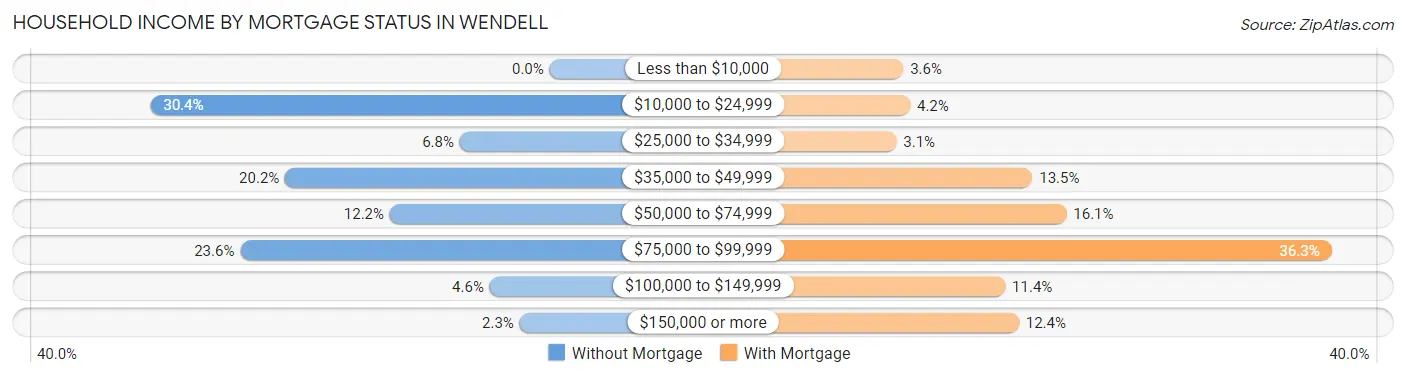
| Household Income | Without Mortgage | With Mortgage |
| Less than $10,000 | 0 (0.0%) | 14 (3.6%) |
| $10,000 to $24,999 | 80 (30.4%) | 16 (4.2%) |
| $25,000 to $34,999 | 18 (6.8%) | 12 (3.1%) |
| $35,000 to $49,999 | 53 (20.2%) | 52 (13.5%) |
| $50,000 to $74,999 | 32 (12.2%) | 62 (16.1%) |
| $75,000 to $99,999 | 62 (23.6%) | 140 (36.3%) |
| $100,000 to $149,999 | 12 (4.6%) | 44 (11.4%) |
| $150,000 or more | 6 (2.3%) | 48 (12.4%) |
| Total | 263 (100.0%) | 386 (100.0%) |
Property Value to Household Income Ratio in Wendell
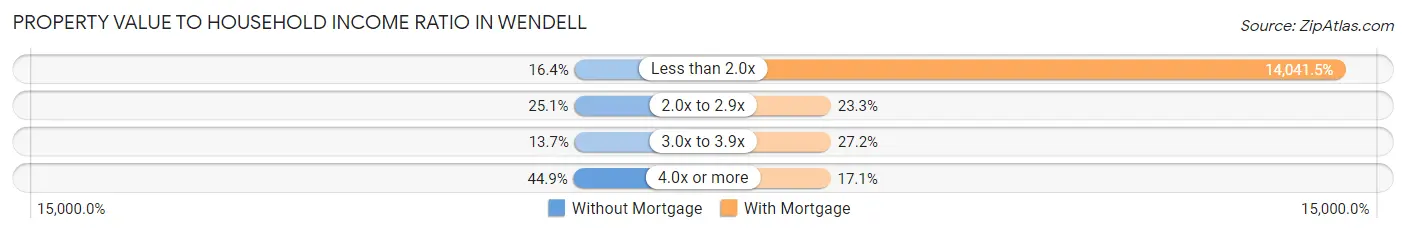
| Value-to-Income Ratio | Without Mortgage | With Mortgage |
| Less than 2.0x | 43 (16.4%) | 54,200 (14,041.5%) |
| 2.0x to 2.9x | 66 (25.1%) | 90 (23.3%) |
| 3.0x to 3.9x | 36 (13.7%) | 105 (27.2%) |
| 4.0x or more | 118 (44.9%) | 66 (17.1%) |
| Total | 263 (100.0%) | 386 (100.0%) |
Real Estate Taxes by Mortgage Status in Wendell
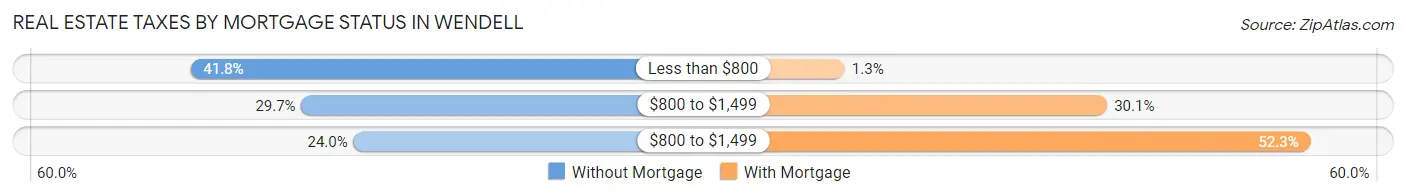
| Property Taxes | Without Mortgage | With Mortgage |
| Less than $800 | 110 (41.8%) | 5 (1.3%) |
| $800 to $1,499 | 78 (29.7%) | 116 (30.0%) |
| $800 to $1,499 | 63 (23.9%) | 202 (52.3%) |
| Total | 263 (100.0%) | 386 (100.0%) |
Health & Disability in Wendell
Health Insurance Coverage by Age in Wendell
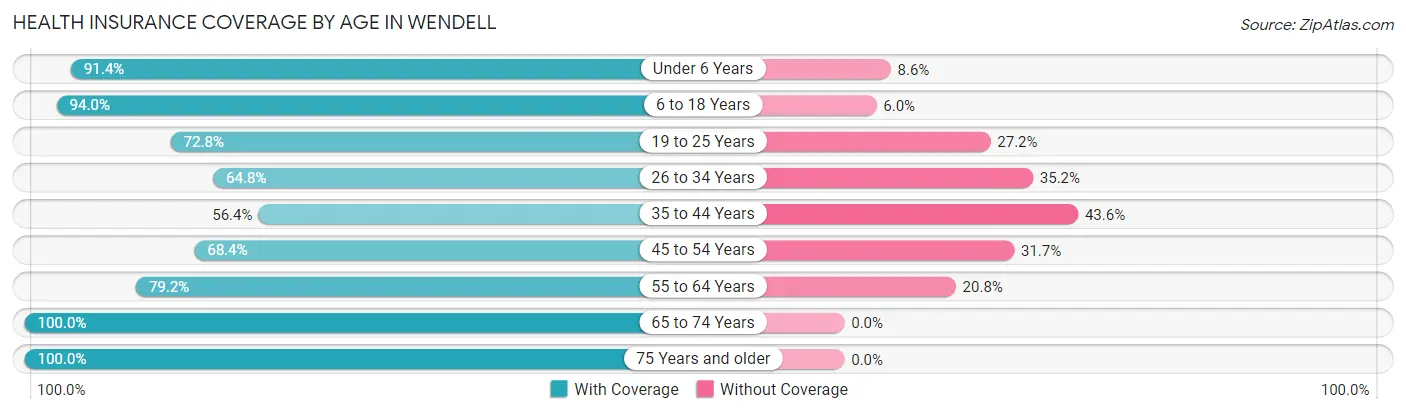
| Age Bracket | With Coverage | Without Coverage |
| Under 6 Years | 201 (91.4%) | 19 (8.6%) |
| 6 to 18 Years | 582 (94.0%) | 37 (6.0%) |
| 19 to 25 Years | 179 (72.8%) | 67 (27.2%) |
| 26 to 34 Years | 249 (64.8%) | 135 (35.2%) |
| 35 to 44 Years | 189 (56.4%) | 146 (43.6%) |
| 45 to 54 Years | 162 (68.3%) | 75 (31.7%) |
| 55 to 64 Years | 370 (79.2%) | 97 (20.8%) |
| 65 to 74 Years | 184 (100.0%) | 0 (0.0%) |
| 75 Years and older | 199 (100.0%) | 0 (0.0%) |
| Total | 2,315 (80.1%) | 576 (19.9%) |
Health Insurance Coverage by Citizenship Status in Wendell
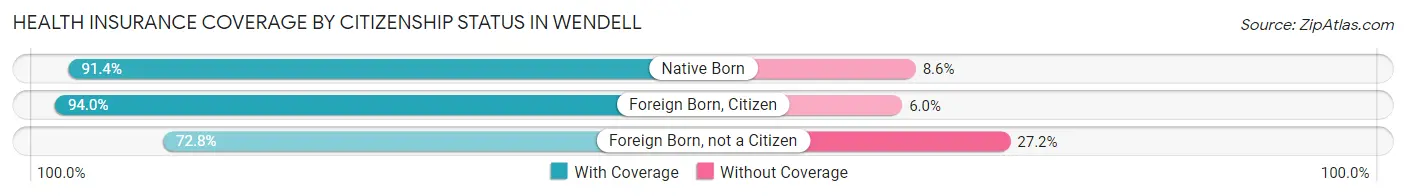
| Citizenship Status | With Coverage | Without Coverage |
| Native Born | 201 (91.4%) | 19 (8.6%) |
| Foreign Born, Citizen | 582 (94.0%) | 37 (6.0%) |
| Foreign Born, not a Citizen | 179 (72.8%) | 67 (27.2%) |
Health Insurance Coverage by Household Income in Wendell
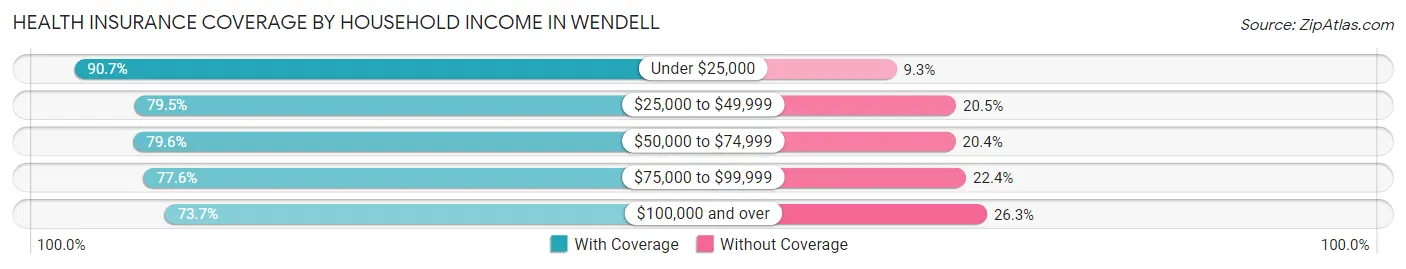
| Household Income | With Coverage | Without Coverage |
| Under $25,000 | 399 (90.7%) | 41 (9.3%) |
| $25,000 to $49,999 | 718 (79.5%) | 185 (20.5%) |
| $50,000 to $74,999 | 610 (79.6%) | 156 (20.4%) |
| $75,000 to $99,999 | 250 (77.6%) | 72 (22.4%) |
| $100,000 and over | 337 (73.7%) | 120 (26.3%) |
Public vs Private Health Insurance Coverage by Age in Wendell
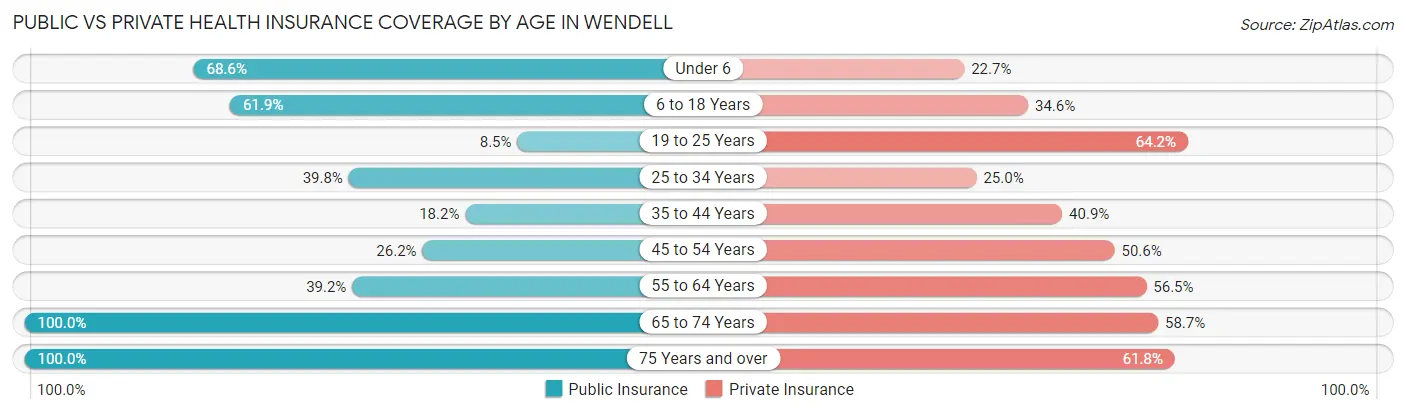
| Age Bracket | Public Insurance | Private Insurance |
| Under 6 | 151 (68.6%) | 50 (22.7%) |
| 6 to 18 Years | 383 (61.9%) | 214 (34.6%) |
| 19 to 25 Years | 21 (8.5%) | 158 (64.2%) |
| 25 to 34 Years | 153 (39.8%) | 96 (25.0%) |
| 35 to 44 Years | 61 (18.2%) | 137 (40.9%) |
| 45 to 54 Years | 62 (26.2%) | 120 (50.6%) |
| 55 to 64 Years | 183 (39.2%) | 264 (56.5%) |
| 65 to 74 Years | 184 (100.0%) | 108 (58.7%) |
| 75 Years and over | 199 (100.0%) | 123 (61.8%) |
| Total | 1,397 (48.3%) | 1,270 (43.9%) |
Disability Status by Sex by Age in Wendell
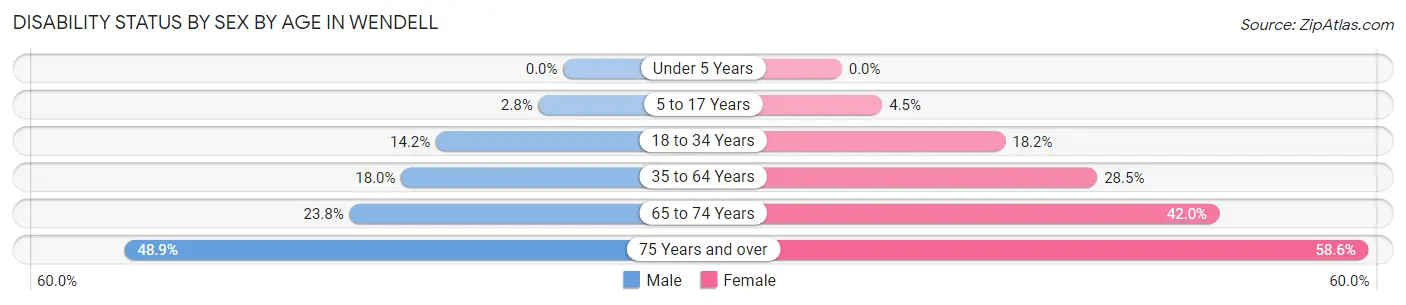
| Age Bracket | Male | Female |
| Under 5 Years | 0 (0.0%) | 0 (0.0%) |
| 5 to 17 Years | 9 (2.8%) | 13 (4.5%) |
| 18 to 34 Years | 52 (14.2%) | 53 (18.2%) |
| 35 to 64 Years | 105 (18.0%) | 130 (28.4%) |
| 65 to 74 Years | 20 (23.8%) | 42 (42.0%) |
| 75 Years and over | 43 (48.9%) | 65 (58.6%) |
Disability Class by Sex by Age in Wendell
Disability Class: Hearing Difficulty
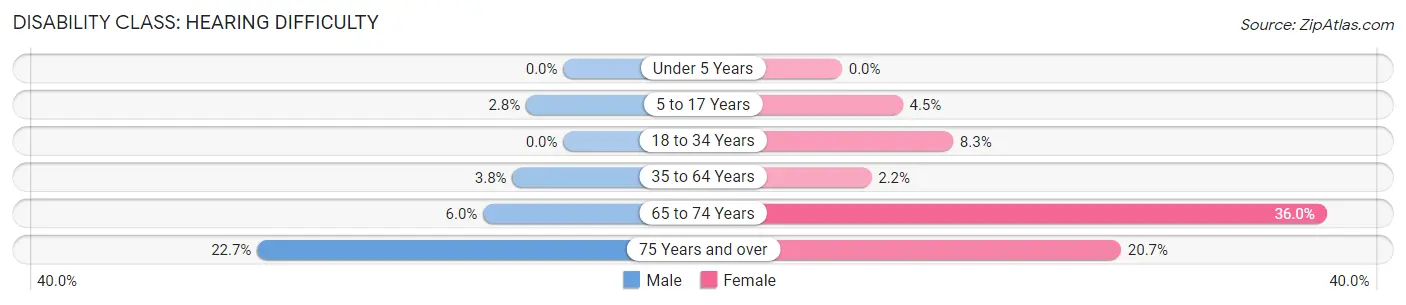
| Age Bracket | Male | Female |
| Under 5 Years | 0 (0.0%) | 0 (0.0%) |
| 5 to 17 Years | 9 (2.8%) | 13 (4.5%) |
| 18 to 34 Years | 0 (0.0%) | 24 (8.3%) |
| 35 to 64 Years | 22 (3.8%) | 10 (2.2%) |
| 65 to 74 Years | 5 (5.9%) | 36 (36.0%) |
| 75 Years and over | 20 (22.7%) | 23 (20.7%) |
Disability Class: Vision Difficulty
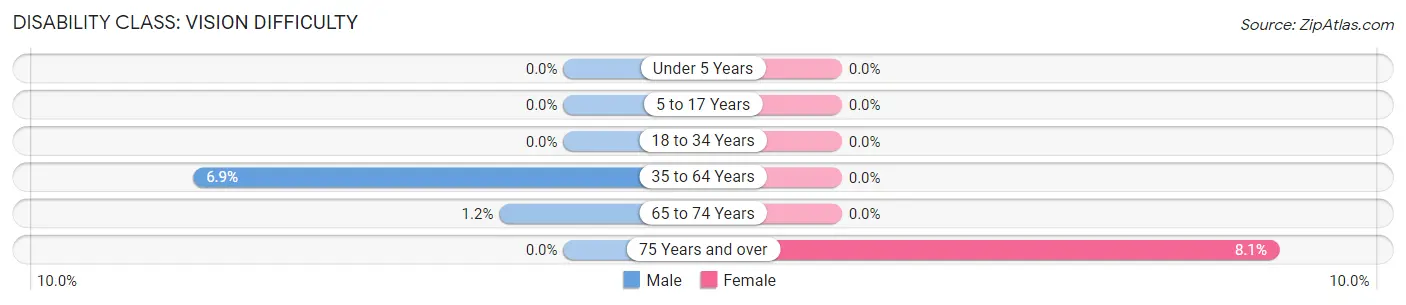
| Age Bracket | Male | Female |
| Under 5 Years | 0 (0.0%) | 0 (0.0%) |
| 5 to 17 Years | 0 (0.0%) | 0 (0.0%) |
| 18 to 34 Years | 0 (0.0%) | 0 (0.0%) |
| 35 to 64 Years | 40 (6.9%) | 0 (0.0%) |
| 65 to 74 Years | 1 (1.2%) | 0 (0.0%) |
| 75 Years and over | 0 (0.0%) | 9 (8.1%) |
Disability Class: Cognitive Difficulty
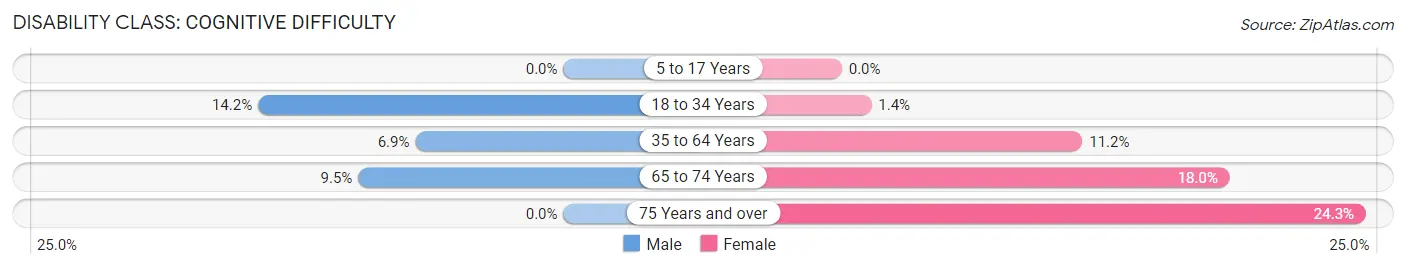
| Age Bracket | Male | Female |
| 5 to 17 Years | 0 (0.0%) | 0 (0.0%) |
| 18 to 34 Years | 52 (14.2%) | 4 (1.4%) |
| 35 to 64 Years | 40 (6.9%) | 51 (11.2%) |
| 65 to 74 Years | 8 (9.5%) | 18 (18.0%) |
| 75 Years and over | 0 (0.0%) | 27 (24.3%) |
Disability Class: Ambulatory Difficulty
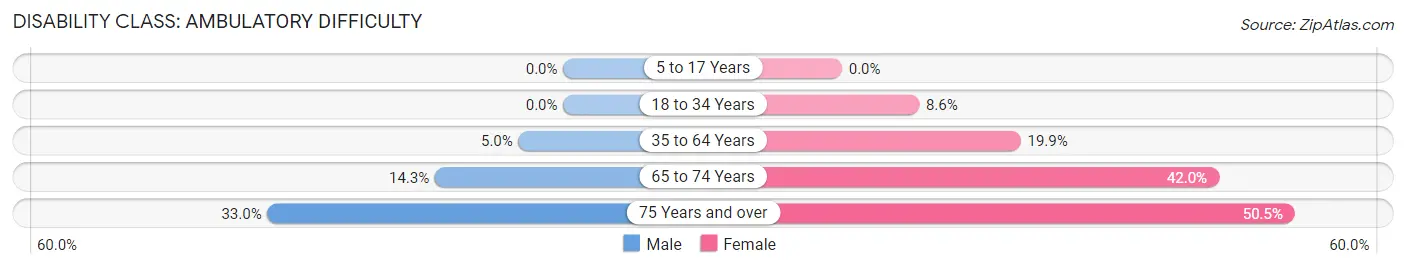
| Age Bracket | Male | Female |
| 5 to 17 Years | 0 (0.0%) | 0 (0.0%) |
| 18 to 34 Years | 0 (0.0%) | 25 (8.6%) |
| 35 to 64 Years | 29 (5.0%) | 91 (19.9%) |
| 65 to 74 Years | 12 (14.3%) | 42 (42.0%) |
| 75 Years and over | 29 (33.0%) | 56 (50.4%) |
Disability Class: Self-Care Difficulty
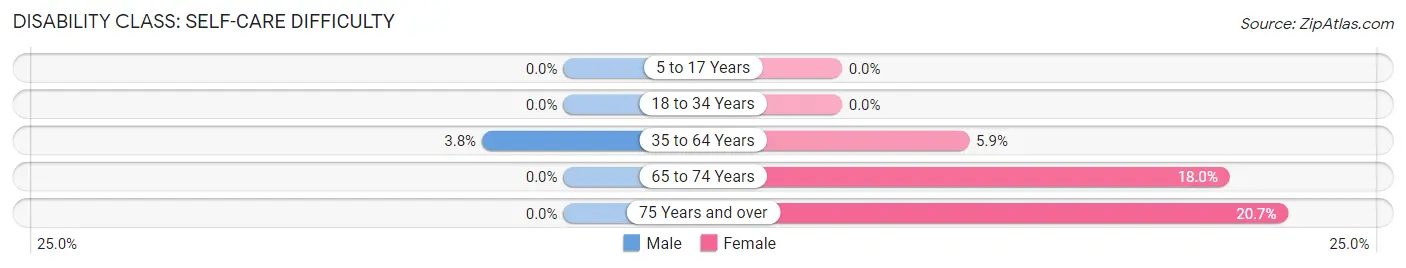
| Age Bracket | Male | Female |
| 5 to 17 Years | 0 (0.0%) | 0 (0.0%) |
| 18 to 34 Years | 0 (0.0%) | 0 (0.0%) |
| 35 to 64 Years | 22 (3.8%) | 27 (5.9%) |
| 65 to 74 Years | 0 (0.0%) | 18 (18.0%) |
| 75 Years and over | 0 (0.0%) | 23 (20.7%) |
Technology Access in Wendell
Computing Device Access in Wendell
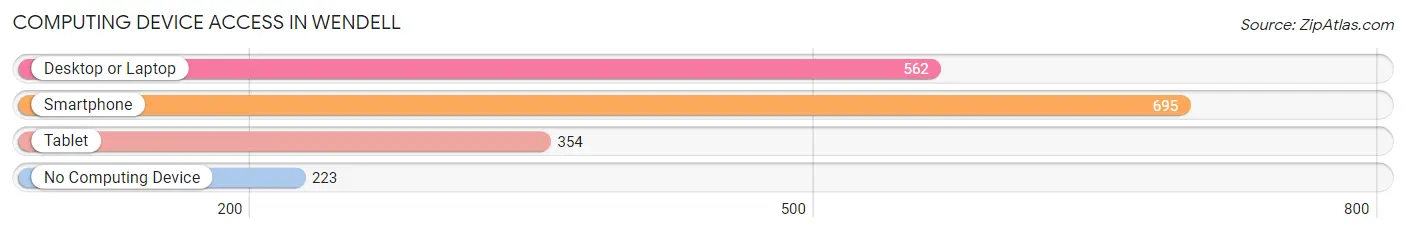
| Device Type | # Households | % Households |
| Desktop or Laptop | 562 | 59.0% |
| Smartphone | 695 | 72.9% |
| Tablet | 354 | 37.1% |
| No Computing Device | 223 | 23.4% |
| Total | 953 | 100.0% |
Internet Access in Wendell
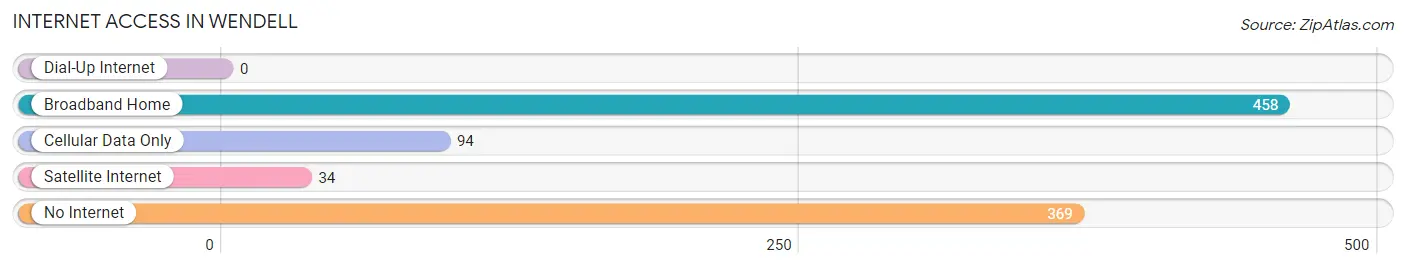
| Internet Type | # Households | % Households |
| Dial-Up Internet | 0 | 0.0% |
| Broadband Home | 458 | 48.1% |
| Cellular Data Only | 94 | 9.9% |
| Satellite Internet | 34 | 3.6% |
| No Internet | 369 | 38.7% |
| Total | 953 | 100.0% |
Wendell Summary
Wendell is a small city located in Gooding County, Idaho. It is situated in the south-central part of the state, about 40 miles northwest of Twin Falls. The city has a population of 1,717 people, according to the 2010 census.
History
The area that is now Wendell was first settled in the late 1800s by homesteaders. The town was officially founded in 1906 and was named after Wendell P. Brown, a local rancher. The city was incorporated in 1909.
In the early 1900s, Wendell was a thriving agricultural community. The town was home to several grain elevators, a creamery, and a sugar beet factory. The sugar beet factory was the largest employer in the area and provided jobs for many of the town’s residents.
In the 1950s, the sugar beet factory closed and the town’s economy shifted to focus on dairy farming. The town also became a popular destination for tourists, as it was located near several popular fishing and hunting spots.
Geography
Wendell is located in the Snake River Plain, a large area of flat land in south-central Idaho. The city is situated at an elevation of 4,072 feet above sea level.
The city is located about 40 miles northwest of Twin Falls and about 100 miles southeast of Boise. The nearby towns of Hagerman and Gooding are both about 10 miles away.
The climate in Wendell is semi-arid, with hot summers and cold winters. The average high temperature in July is 92 degrees Fahrenheit, while the average low temperature in January is 22 degrees Fahrenheit.
Economy
The economy of Wendell is largely based on agriculture. The city is home to several dairy farms, as well as farms that produce potatoes, onions, and other crops.
The city is also home to several businesses, including a grocery store, a hardware store, and a few restaurants.
Demographics
According to the 2010 census, the population of Wendell was 1,717 people. The racial makeup of the city was 94.3% White, 0.7% Native American, 0.3% Asian, 0.2% African American, and 4.5% from other races.
The median household income in Wendell was $37,917, and the median family income was $45,625. The per capita income was $17,945.
Conclusion
Wendell is a small city located in Gooding County, Idaho. It has a population of 1,717 people, according to the 2010 census. The city’s economy is largely based on agriculture, and it is home to several dairy farms and other businesses. The racial makeup of the city is 94.3% White, 0.7% Native American, 0.3% Asian, 0.2% African American, and 4.5% from other races. The median household income in Wendell was $37,917, and the median family income was $45,625.
Common Questions
What is the Total Population of Wendell?
Total Population of Wendell is 2,900.
What is the Total Male Population of Wendell?
Total Male Population of Wendell is 1,571.
What is the Total Female Population of Wendell?
Total Female Population of Wendell is 1,329.
What is the Ratio of Males per 100 Females in Wendell?
There are 118.21 Males per 100 Females in Wendell.
What is the Ratio of Females per 100 Males in Wendell?
There are 84.60 Females per 100 Males in Wendell.
What is the Median Population Age in Wendell?
Median Population Age in Wendell is 34.7 Years.
What is the Average Family Size in Wendell
Average Family Size in Wendell is 4.3 People.
What is the Average Household Size in Wendell
Average Household Size in Wendell is 3.0 People.
What is Per Capita Income in Wendell?
Per Capita income in Wendell is $20,571.
What is the Median Family Income in Wendell?
Median Family Income in Wendell is $51,579.
What is the Median Household income in Wendell?
Median Household Income in Wendell is $46,875.
What is Income or Wage Gap in Wendell?
Income or Wage Gap in Wendell is 17.4%.
Women in Wendell earn 82.6 cents for every dollar earned by a man.
What is Family Income Deficit in Wendell?
Family Income Deficit in Wendell is $9,692.
Families that are below poverty line in Wendell earn $9,692 less on average than the poverty threshold level.
What is Inequality or Gini Index in Wendell?
Inequality or Gini Index in Wendell is 0.39.
How Large is the Labor Force in Wendell?
There are 1,352 People in the Labor Forcein in Wendell.
What is the Percentage of People in the Labor Force in Wendell?
61.5% of People are in the Labor Force in Wendell.
What is the Unemployment Rate in Wendell?
Unemployment Rate in Wendell is 2.1%.