Wardner, ID
Wardner Map
Wardner Overview
330
TOTAL POPULATION
142
MALE POPULATION
188
FEMALE POPULATION
75.53
MALES / 100 FEMALES
132.39
FEMALES / 100 MALES
32.9
MEDIAN AGE
2.7
AVG FAMILY SIZE
2.5
AVG HOUSEHOLD SIZE
$36,148
PER CAPITA INCOME
$34,970
AVG FAMILY INCOME
$34,643
AVG HOUSEHOLD INCOME
56.2%
WAGE / INCOME GAP [ % ]
43.8¢/ $1
WAGE / INCOME GAP [ $ ]
0.54
INEQUALITY / GINI INDEX
181
LABOR FORCE [ PEOPLE ]
62.6%
PERCENT IN LABOR FORCE
6.6%
UNEMPLOYMENT RATE
Wardner Area Codes
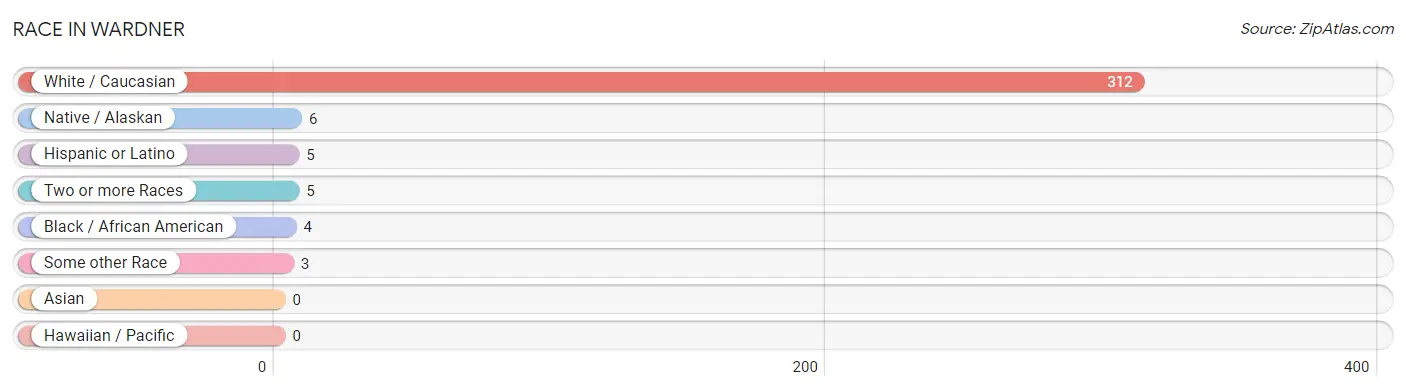
Race in Wardner
The most populous races in Wardner are White / Caucasian (312 | 94.6%), Native / Alaskan (6 | 1.8%), and Hispanic or Latino (5 | 1.5%).
| Race | # Population | % Population |
| Asian | 0 | 0.0% |
| Black / African American | 4 | 1.2% |
| Hawaiian / Pacific | 0 | 0.0% |
| Hispanic or Latino | 5 | 1.5% |
| Native / Alaskan | 6 | 1.8% |
| White / Caucasian | 312 | 94.6% |
| Two or more Races | 5 | 1.5% |
| Some other Race | 3 | 0.9% |
| Total | 330 | 100.0% |
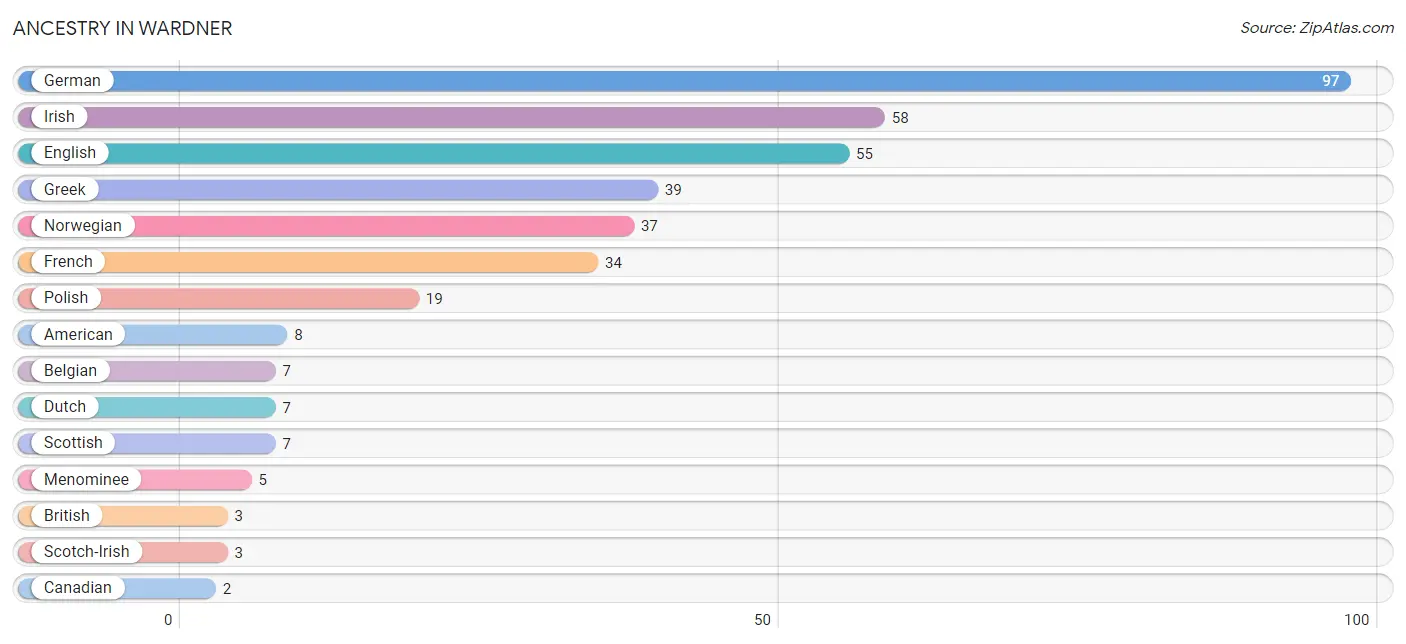
Ancestry in Wardner
The most populous ancestries reported in Wardner are German (97 | 29.4%), Irish (58 | 17.6%), English (55 | 16.7%), Greek (39 | 11.8%), and Norwegian (37 | 11.2%), together accounting for 86.7% of all Wardner residents.
| Ancestry | # Population | % Population |
| American | 8 | 2.4% |
| Belgian | 7 | 2.1% |
| British | 3 | 0.9% |
| Burmese | 1 | 0.3% |
| Canadian | 2 | 0.6% |
| Cuban | 2 | 0.6% |
| Dutch | 7 | 2.1% |
| English | 55 | 16.7% |
| European | 2 | 0.6% |
| French | 34 | 10.3% |
| French Canadian | 2 | 0.6% |
| German | 97 | 29.4% |
| Greek | 39 | 11.8% |
| Irish | 58 | 17.6% |
| Italian | 2 | 0.6% |
| Menominee | 5 | 1.5% |
| Navajo | 1 | 0.3% |
| Norwegian | 37 | 11.2% |
| Polish | 19 | 5.8% |
| Russian | 1 | 0.3% |
| Scotch-Irish | 3 | 0.9% |
| Scottish | 7 | 2.1% |
| Slovak | 1 | 0.3% |
| Swiss | 2 | 0.6% | View All 24 Rows |
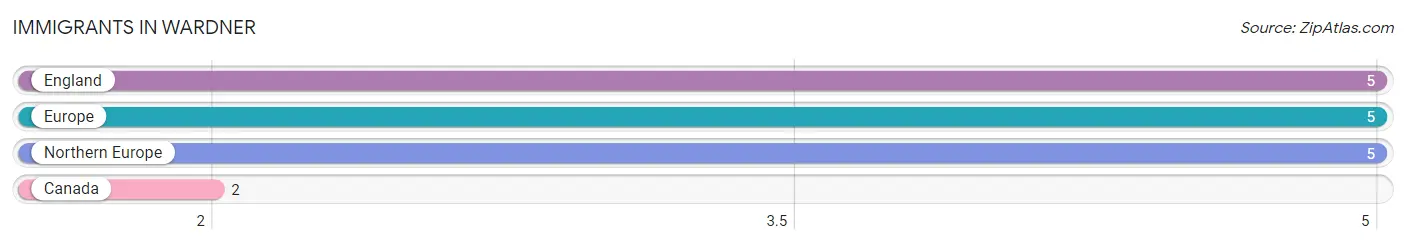
Immigrants in Wardner
The most numerous immigrant groups reported in Wardner came from England (5 | 1.5%), Europe (5 | 1.5%), Northern Europe (5 | 1.5%), and Canada (2 | 0.6%), together accounting for 5.2% of all Wardner residents.
| Immigration Origin | # Population | % Population |
| Canada | 2 | 0.6% |
| England | 5 | 1.5% |
| Europe | 5 | 1.5% |
| Northern Europe | 5 | 1.5% | View All 4 Rows |
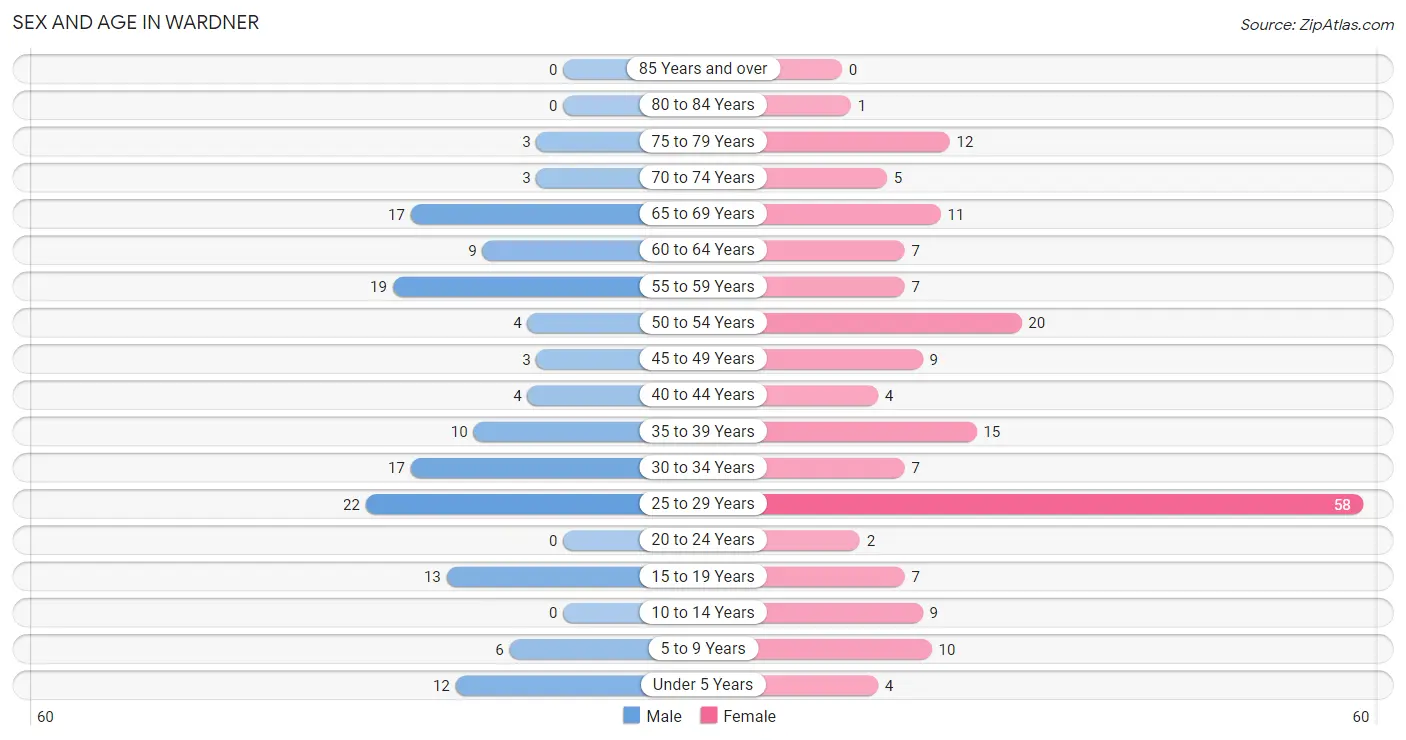
Sex and Age in Wardner
Sex and Age in Wardner
The most populous age groups in Wardner are 25 to 29 Years (22 | 15.5%) for men and 25 to 29 Years (58 | 30.8%) for women.
| Age Bracket | Male | Female |
| Under 5 Years | 12 (8.5%) | 4 (2.1%) |
| 5 to 9 Years | 6 (4.2%) | 10 (5.3%) |
| 10 to 14 Years | 0 (0.0%) | 9 (4.8%) |
| 15 to 19 Years | 13 (9.1%) | 7 (3.7%) |
| 20 to 24 Years | 0 (0.0%) | 2 (1.1%) |
| 25 to 29 Years | 22 (15.5%) | 58 (30.8%) |
| 30 to 34 Years | 17 (12.0%) | 7 (3.7%) |
| 35 to 39 Years | 10 (7.0%) | 15 (8.0%) |
| 40 to 44 Years | 4 (2.8%) | 4 (2.1%) |
| 45 to 49 Years | 3 (2.1%) | 9 (4.8%) |
| 50 to 54 Years | 4 (2.8%) | 20 (10.6%) |
| 55 to 59 Years | 19 (13.4%) | 7 (3.7%) |
| 60 to 64 Years | 9 (6.3%) | 7 (3.7%) |
| 65 to 69 Years | 17 (12.0%) | 11 (5.9%) |
| 70 to 74 Years | 3 (2.1%) | 5 (2.7%) |
| 75 to 79 Years | 3 (2.1%) | 12 (6.4%) |
| 80 to 84 Years | 0 (0.0%) | 1 (0.5%) |
| 85 Years and over | 0 (0.0%) | 0 (0.0%) |
| Total | 142 (100.0%) | 188 (100.0%) |
Families and Households in Wardner
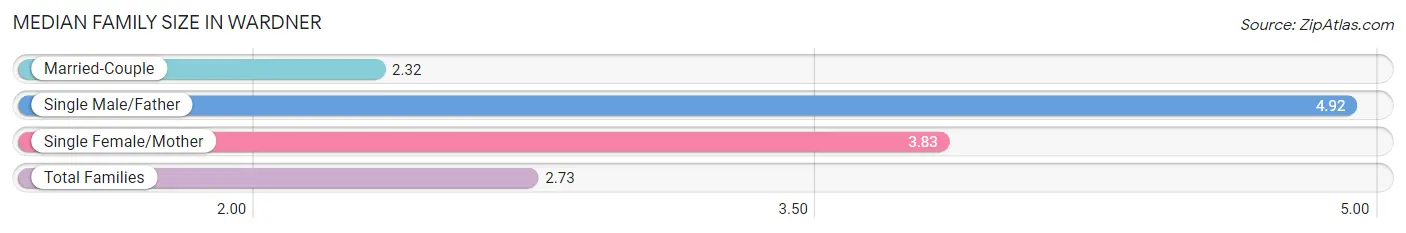
Median Family Size in Wardner
The median family size in Wardner is 2.73 persons per family, with single male/father families (12 | 12.4%) accounting for the largest median family size of 4.92 persons per family. On the other hand, married-couple families (79 | 81.4%) represent the smallest median family size with 2.32 persons per family.
| Family Type | # Families | Family Size |
| Married-Couple | 79 (81.4%) | 2.32 |
| Single Male/Father | 12 (12.4%) | 4.92 |
| Single Female/Mother | 6 (6.2%) | 3.83 |
| Total Families | 97 (100.0%) | 2.73 |
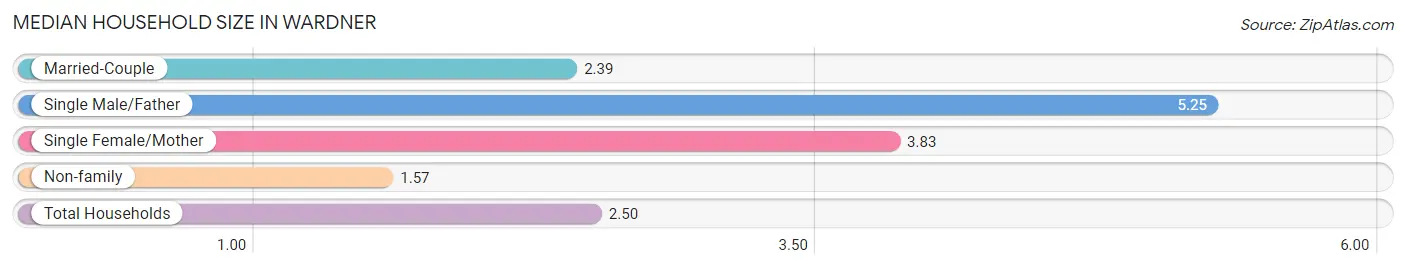
Median Household Size in Wardner
The median household size in Wardner is 2.50 persons per household, with single male/father households (12 | 9.1%) accounting for the largest median household size of 5.25 persons per household. non-family households (35 | 26.5%) represent the smallest median household size with 1.57 persons per household.
| Household Type | # Households | Household Size |
| Married-Couple | 79 (59.9%) | 2.39 |
| Single Male/Father | 12 (9.1%) | 5.25 |
| Single Female/Mother | 6 (4.5%) | 3.83 |
| Non-family | 35 (26.5%) | 1.57 |
| Total Households | 132 (100.0%) | 2.50 |
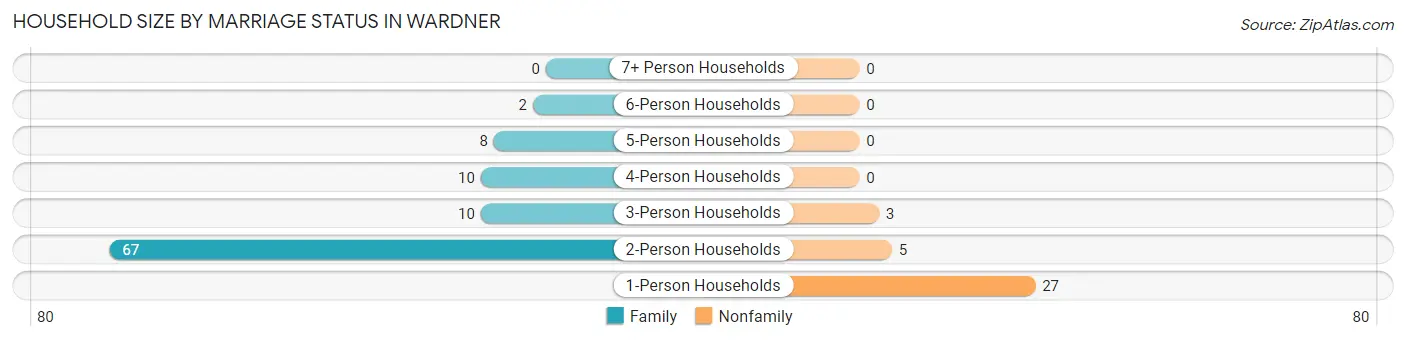
Household Size by Marriage Status in Wardner
Out of a total of 132 households in Wardner, 97 (73.5%) are family households, while 35 (26.5%) are nonfamily households. The most numerous type of family households are 2-person households, comprising 67, and the most common type of nonfamily households are 1-person households, comprising 27.
| Household Size | Family Households | Nonfamily Households |
| 1-Person Households | - | 27 (20.4%) |
| 2-Person Households | 67 (50.8%) | 5 (3.8%) |
| 3-Person Households | 10 (7.6%) | 3 (2.3%) |
| 4-Person Households | 10 (7.6%) | 0 (0.0%) |
| 5-Person Households | 8 (6.1%) | 0 (0.0%) |
| 6-Person Households | 2 (1.5%) | 0 (0.0%) |
| 7+ Person Households | 0 (0.0%) | 0 (0.0%) |
| Total | 97 (73.5%) | 35 (26.5%) |
Female Fertility in Wardner
Fertility by Age in Wardner
Average fertility rate in Wardner is 84.0 births per 1,000 women. Women in the age bracket of 15 to 19 years have the highest fertility rate with 714.0 births per 1,000 women. Women in the age bracket of 15 to 19 years acount for 55.6% of all women with births.
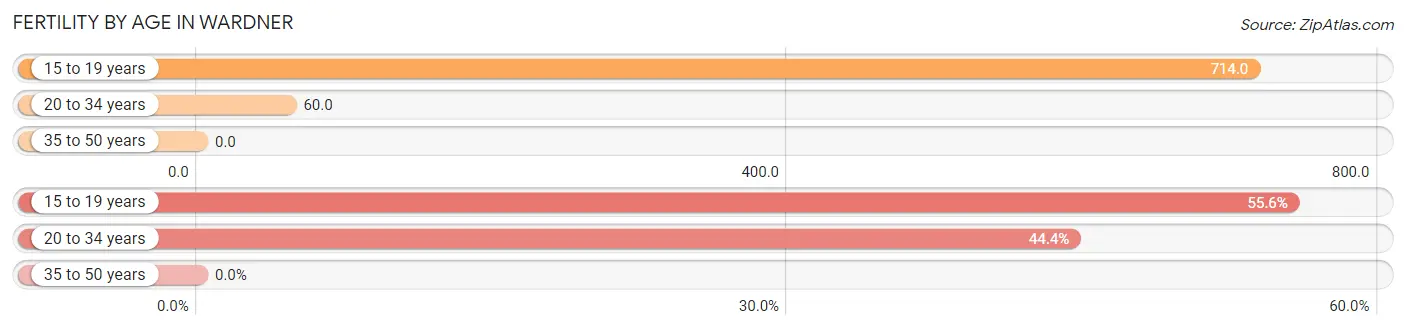
| Age Bracket | Women with Births | Births / 1,000 Women |
| 15 to 19 years | 5 (55.6%) | 714.0 |
| 20 to 34 years | 4 (44.4%) | 60.0 |
| 35 to 50 years | 0 (0.0%) | 0.0 |
| Total | 9 (100.0%) | 84.0 |
Fertility by Age by Marriage Status in Wardner
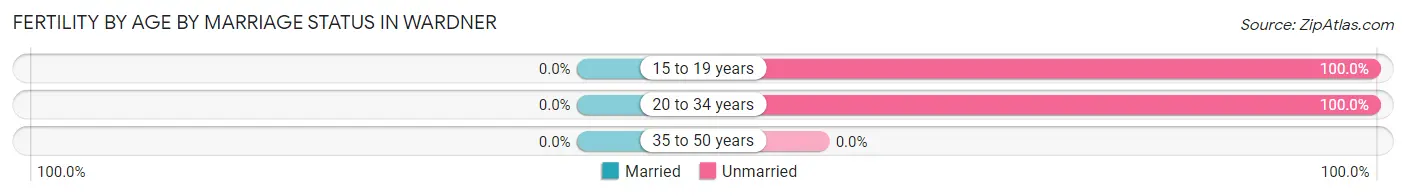
| Age Bracket | Married | Unmarried |
| 15 to 19 years | 0 (0.0%) | 5 (100.0%) |
| 20 to 34 years | 0 (0.0%) | 4 (100.0%) |
| 35 to 50 years | 0 (0.0%) | 0 (0.0%) |
| Total | 0 (0.0%) | 9 (100.0%) |
Fertility by Education in Wardner
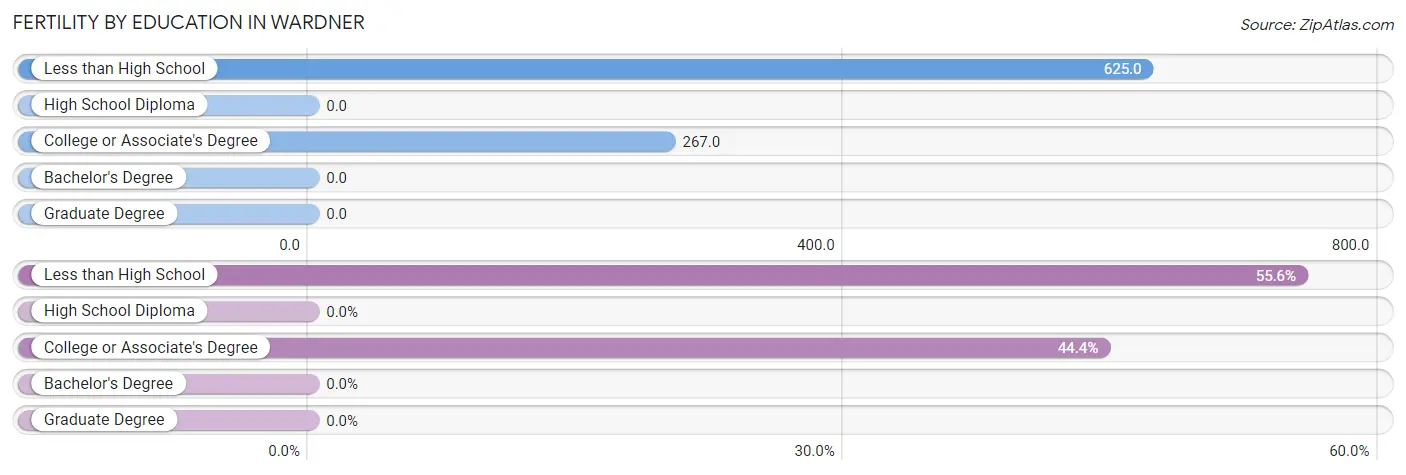
| Educational Attainment | Women with Births | Births / 1,000 Women |
| Less than High School | 5 (55.6%) | 625.0 |
| High School Diploma | 0 (0.0%) | 0.0 |
| College or Associate's Degree | 4 (44.4%) | 267.0 |
| Bachelor's Degree | 0 (0.0%) | 0.0 |
| Graduate Degree | 0 (0.0%) | 0.0 |
| Total | 9 (100.0%) | 84.0 |
Fertility by Education by Marriage Status in Wardner
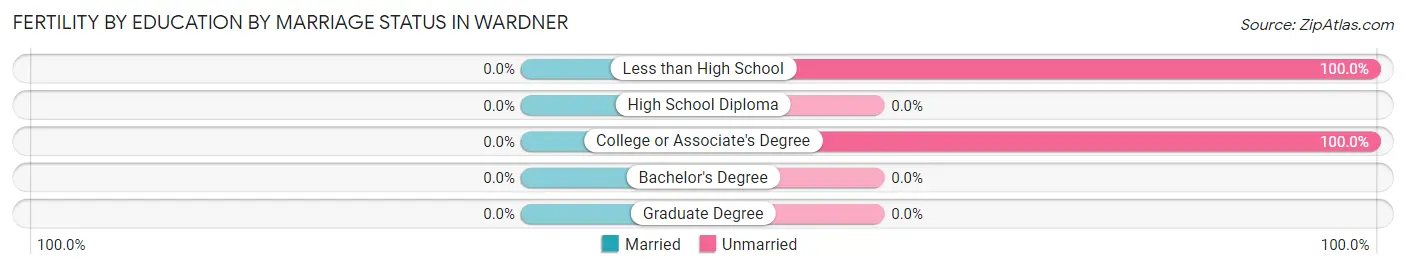
| Educational Attainment | Married | Unmarried |
| Less than High School | 0 (0.0%) | 5 (100.0%) |
| High School Diploma | 0 (0.0%) | 0 (0.0%) |
| College or Associate's Degree | 0 (0.0%) | 4 (100.0%) |
| Bachelor's Degree | 0 (0.0%) | 0 (0.0%) |
| Graduate Degree | 0 (0.0%) | 0 (0.0%) |
| Total | 0 (0.0%) | 9 (100.0%) |
Income in Wardner
Income Overview in Wardner
Per Capita Income in Wardner is $36,148, while median incomes of families and households are $34,970 and $34,643 respectively.
| Characteristic | Number | Measure |
| Per Capita Income | 330 | $36,148 |
| Median Family Income | 97 | $34,970 |
| Mean Family Income | 97 | $90,390 |
| Median Household Income | 132 | $34,643 |
| Mean Household Income | 132 | $79,745 |
| Income Deficit | 97 | $0 |
| Wage / Income Gap (%) | 330 | 56.17% |
| Wage / Income Gap ($) | 330 | 43.83¢ per $1 |
| Gini / Inequality Index | 330 | 0.54 |
Earnings by Sex in Wardner
Average Earnings in Wardner are $19,200, $33,125 for men and $14,519 for women, a difference of 56.2%.
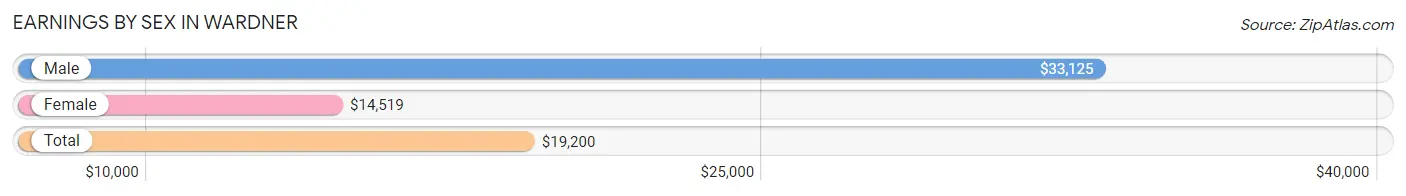
| Sex | Number | Average Earnings |
| Male | 77 (41.4%) | $33,125 |
| Female | 109 (58.6%) | $14,519 |
| Total | 186 (100.0%) | $19,200 |
Earnings by Sex by Income Bracket in Wardner
The most common earnings brackets in Wardner are $17,500 to $19,999 for men (20 | 26.0%) and $12,500 to $14,999 for women (39 | 35.8%).
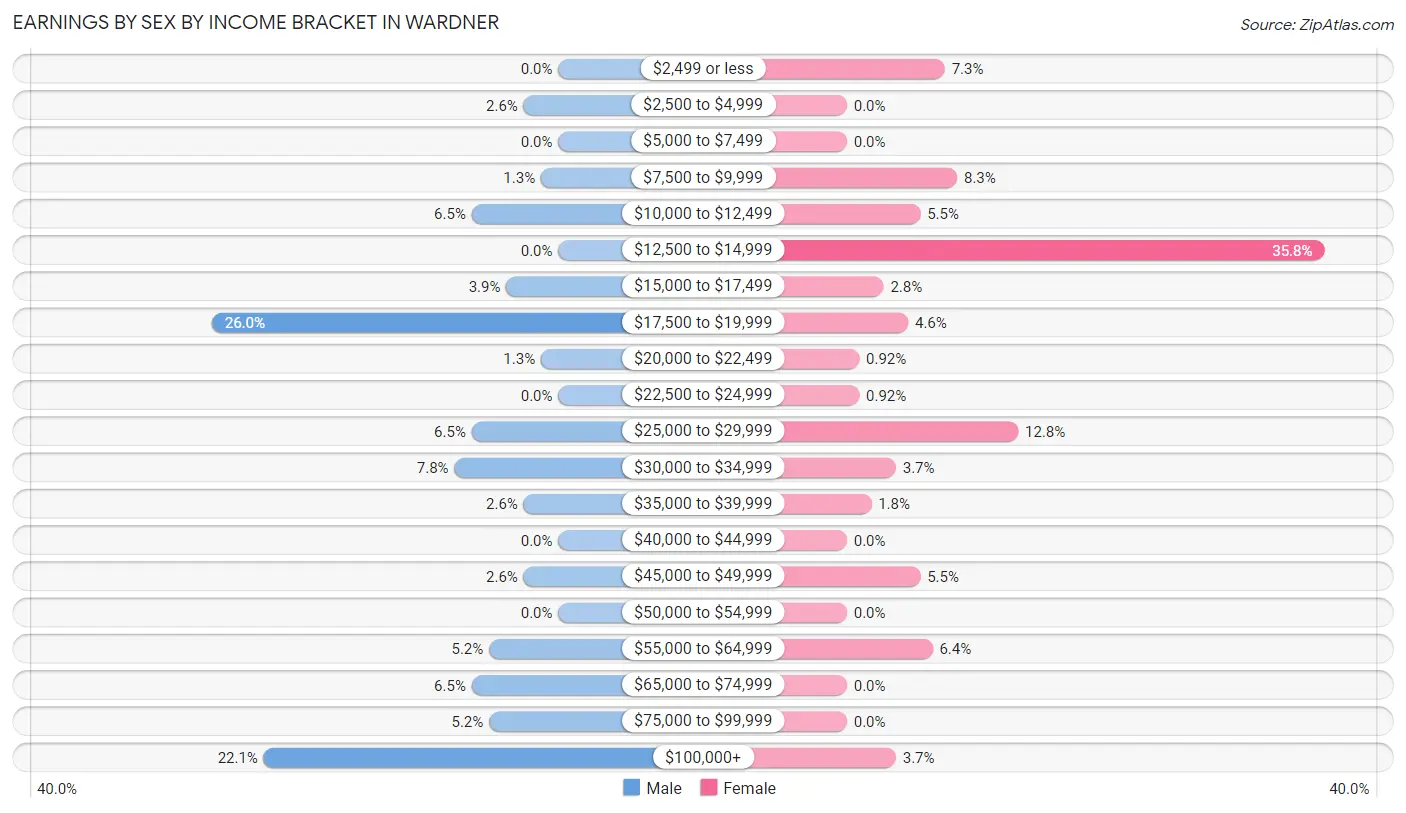
| Income | Male | Female |
| $2,499 or less | 0 (0.0%) | 8 (7.3%) |
| $2,500 to $4,999 | 2 (2.6%) | 0 (0.0%) |
| $5,000 to $7,499 | 0 (0.0%) | 0 (0.0%) |
| $7,500 to $9,999 | 1 (1.3%) | 9 (8.3%) |
| $10,000 to $12,499 | 5 (6.5%) | 6 (5.5%) |
| $12,500 to $14,999 | 0 (0.0%) | 39 (35.8%) |
| $15,000 to $17,499 | 3 (3.9%) | 3 (2.8%) |
| $17,500 to $19,999 | 20 (26.0%) | 5 (4.6%) |
| $20,000 to $22,499 | 1 (1.3%) | 1 (0.9%) |
| $22,500 to $24,999 | 0 (0.0%) | 1 (0.9%) |
| $25,000 to $29,999 | 5 (6.5%) | 14 (12.8%) |
| $30,000 to $34,999 | 6 (7.8%) | 4 (3.7%) |
| $35,000 to $39,999 | 2 (2.6%) | 2 (1.8%) |
| $40,000 to $44,999 | 0 (0.0%) | 0 (0.0%) |
| $45,000 to $49,999 | 2 (2.6%) | 6 (5.5%) |
| $50,000 to $54,999 | 0 (0.0%) | 0 (0.0%) |
| $55,000 to $64,999 | 4 (5.2%) | 7 (6.4%) |
| $65,000 to $74,999 | 5 (6.5%) | 0 (0.0%) |
| $75,000 to $99,999 | 4 (5.2%) | 0 (0.0%) |
| $100,000+ | 17 (22.1%) | 4 (3.7%) |
| Total | 77 (100.0%) | 109 (100.0%) |
Earnings by Sex by Educational Attainment in Wardner
Average earnings in Wardner are $33,125 for men and $14,679 for women, a difference of 55.7%. Men with an educational attainment of college or associate's degree enjoy the highest average annual earnings of $34,792, while those with college or associate's degree education earn the least with $34,792. Women with an educational attainment of bachelor's degree earn the most with the average annual earnings of $38,125, while those with high school diploma education have the smallest earnings of $13,974.
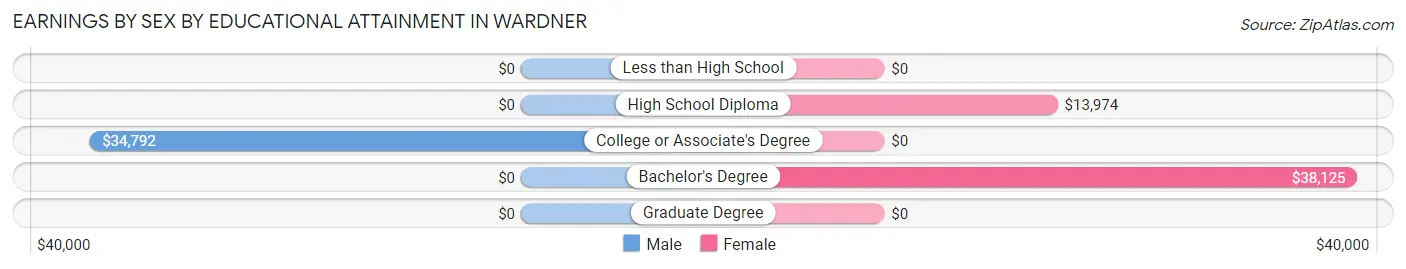
| Educational Attainment | Male Income | Female Income |
| Less than High School | - | - |
| High School Diploma | - | - |
| College or Associate's Degree | $34,792 | $0 |
| Bachelor's Degree | - | - |
| Graduate Degree | - | - |
| Total | $33,125 | $14,679 |
Family Income in Wardner
Family Income Brackets in Wardner
According to the Wardner family income data, there are 43 families falling into the $25,000 to $34,999 income range, which is the most common income bracket and makes up 44.3% of all families.
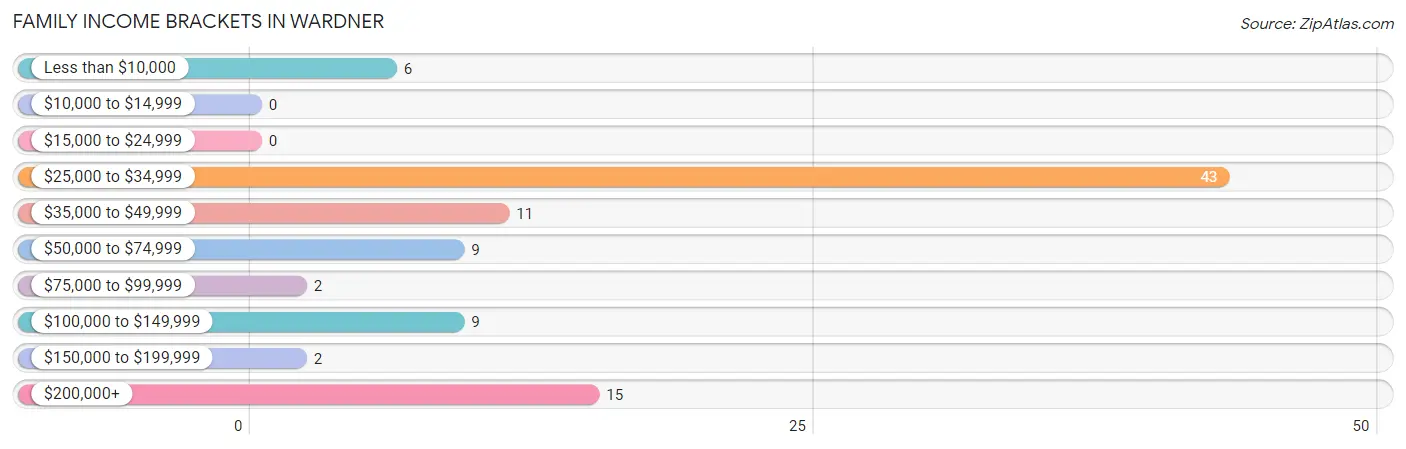
| Income Bracket | # Families | % Families |
| Less than $10,000 | 6 | 6.2% |
| $10,000 to $14,999 | 0 | 0.0% |
| $15,000 to $24,999 | 0 | 0.0% |
| $25,000 to $34,999 | 43 | 44.3% |
| $35,000 to $49,999 | 11 | 11.3% |
| $50,000 to $74,999 | 9 | 9.3% |
| $75,000 to $99,999 | 2 | 2.1% |
| $100,000 to $149,999 | 9 | 9.3% |
| $150,000 to $199,999 | 2 | 2.1% |
| $200,000+ | 15 | 15.5% |
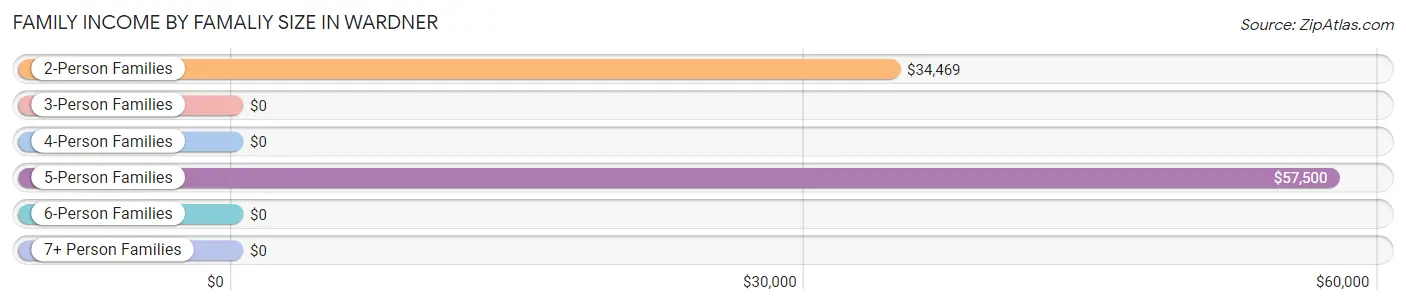
Family Income by Famaliy Size in Wardner
5-person families (4 | 4.1%) account for the highest median family income in Wardner with $57,500 per family, while 2-person families (67 | 69.1%) have the highest median income of $17,234 per family member.
| Income Bracket | # Families | Median Income |
| 2-Person Families | 67 (69.1%) | $34,469 |
| 3-Person Families | 10 (10.3%) | $0 |
| 4-Person Families | 16 (16.5%) | $0 |
| 5-Person Families | 4 (4.1%) | $57,500 |
| 6-Person Families | 0 (0.0%) | $0 |
| 7+ Person Families | 0 (0.0%) | $0 |
| Total | 97 (100.0%) | $34,970 |
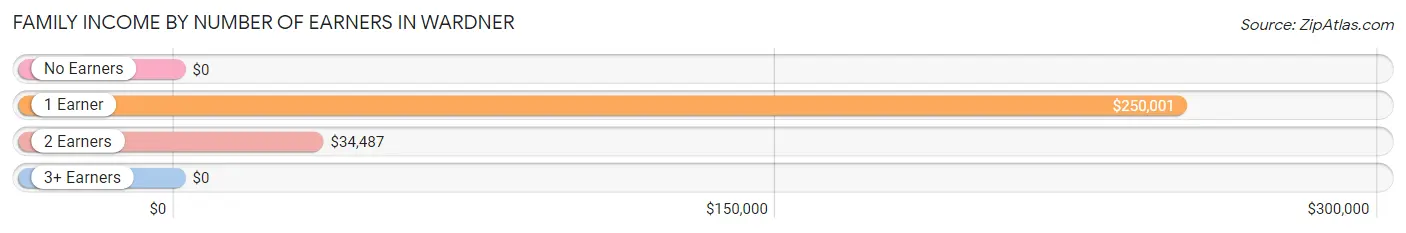
Family Income by Number of Earners in Wardner
| Number of Earners | # Families | Median Income |
| No Earners | 15 (15.5%) | $0 |
| 1 Earner | 10 (10.3%) | $250,001 |
| 2 Earners | 62 (63.9%) | $34,487 |
| 3+ Earners | 10 (10.3%) | $0 |
| Total | 97 (100.0%) | $34,970 |
Household Income in Wardner
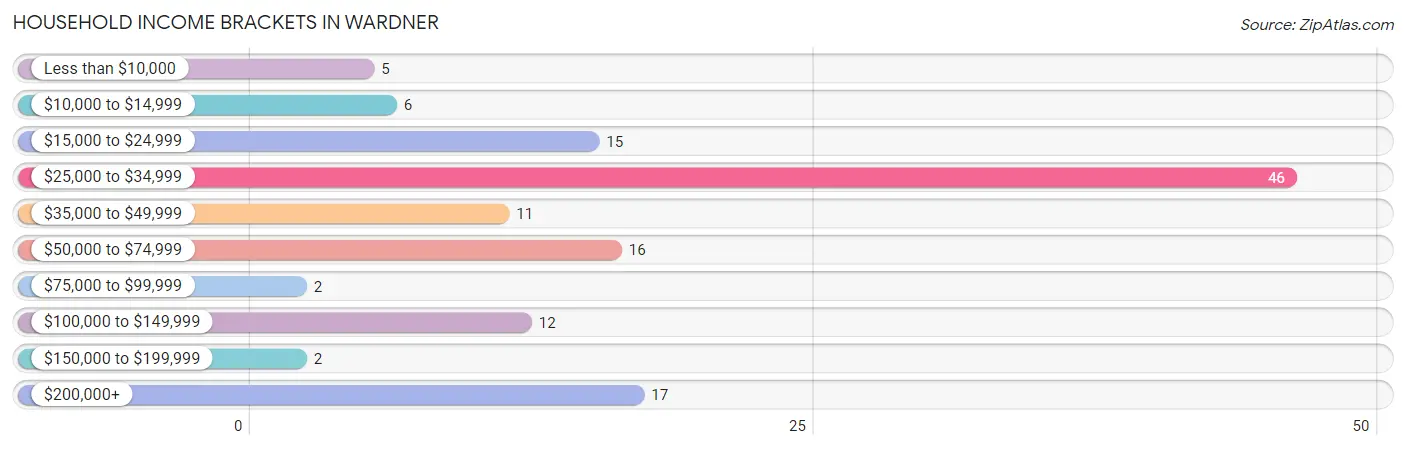
Household Income Brackets in Wardner
With 46 households falling in the category, the $25,000 to $34,999 income range is the most frequent in Wardner, accounting for 34.8% of all households. In contrast, only 2 households (1.5%) fall into the $75,000 to $99,999 income bracket, making it the least populous group.
| Income Bracket | # Households | % Households |
| Less than $10,000 | 5 | 3.8% |
| $10,000 to $14,999 | 6 | 4.5% |
| $15,000 to $24,999 | 15 | 11.4% |
| $25,000 to $34,999 | 46 | 34.8% |
| $35,000 to $49,999 | 11 | 8.3% |
| $50,000 to $74,999 | 16 | 12.1% |
| $75,000 to $99,999 | 2 | 1.5% |
| $100,000 to $149,999 | 12 | 9.1% |
| $150,000 to $199,999 | 2 | 1.5% |
| $200,000+ | 17 | 12.9% |
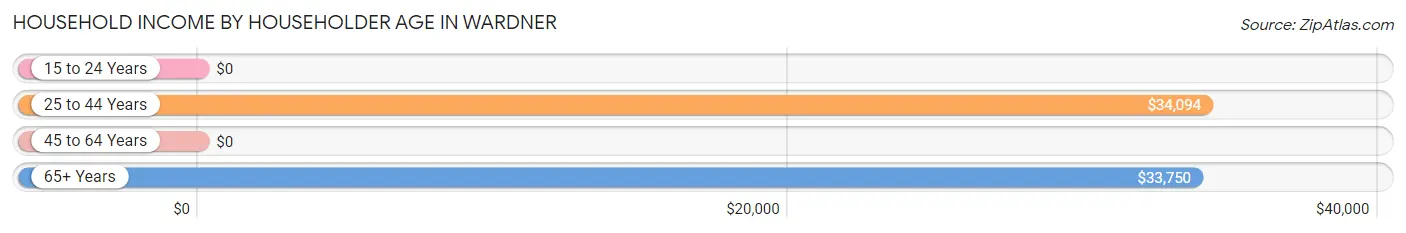
Household Income by Householder Age in Wardner
The median household income in Wardner is $34,643, with the highest median household income of $34,094 found in the 25 to 44 years age bracket for the primary householder. A total of 65 households (49.2%) fall into this category. Meanwhile, the 15 to 24 years age bracket for the primary householder has the lowest median household income of $0, with 2 households (1.5%) in this group.
| Income Bracket | # Households | Median Income |
| 15 to 24 Years | 2 (1.5%) | $0 |
| 25 to 44 Years | 65 (49.2%) | $34,094 |
| 45 to 64 Years | 43 (32.6%) | $0 |
| 65+ Years | 22 (16.7%) | $33,750 |
| Total | 132 (100.0%) | $34,643 |
Poverty in Wardner
Income Below Poverty by Sex and Age in Wardner
With 20.4% poverty level for males and 10.6% for females among the residents of Wardner, under 5 year old males and 5 year old females are the most vulnerable to poverty, with 12 males (100.0%) and 2 females (100.0%) in their respective age groups living below the poverty level.
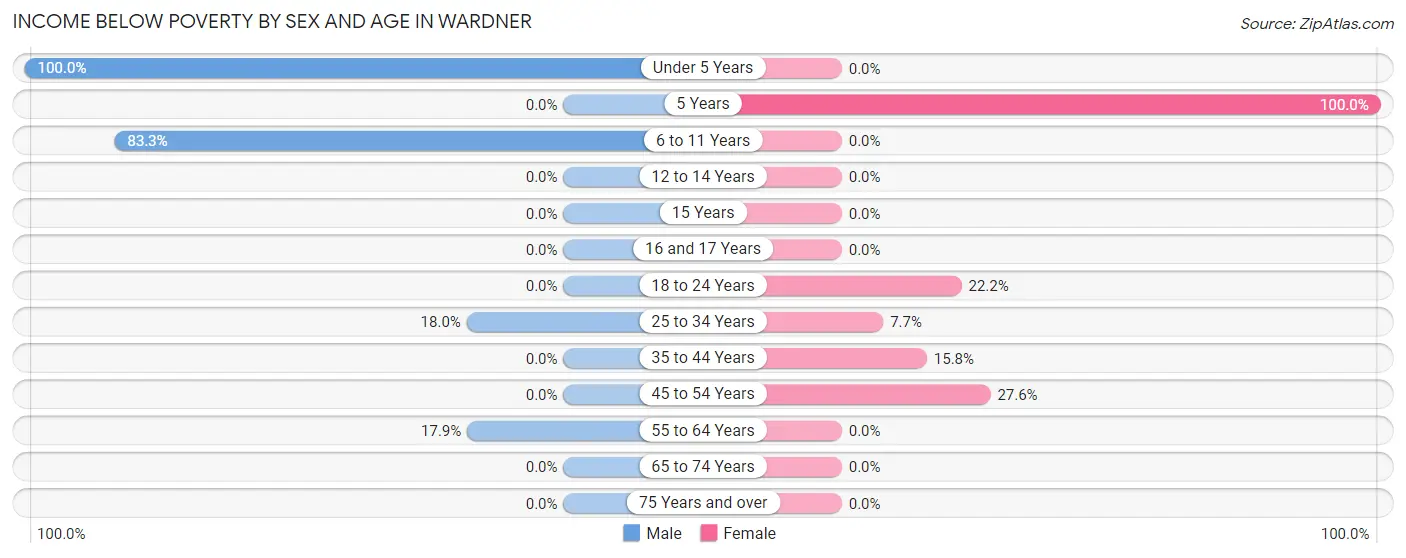
| Age Bracket | Male | Female |
| Under 5 Years | 12 (100.0%) | 0 (0.0%) |
| 5 Years | 0 (0.0%) | 2 (100.0%) |
| 6 to 11 Years | 5 (83.3%) | 0 (0.0%) |
| 12 to 14 Years | 0 (0.0%) | 0 (0.0%) |
| 15 Years | 0 (0.0%) | 0 (0.0%) |
| 16 and 17 Years | 0 (0.0%) | 0 (0.0%) |
| 18 to 24 Years | 0 (0.0%) | 2 (22.2%) |
| 25 to 34 Years | 7 (17.9%) | 5 (7.7%) |
| 35 to 44 Years | 0 (0.0%) | 3 (15.8%) |
| 45 to 54 Years | 0 (0.0%) | 8 (27.6%) |
| 55 to 64 Years | 5 (17.9%) | 0 (0.0%) |
| 65 to 74 Years | 0 (0.0%) | 0 (0.0%) |
| 75 Years and over | 0 (0.0%) | 0 (0.0%) |
| Total | 29 (20.4%) | 20 (10.6%) |
Income Above Poverty by Sex and Age in Wardner
According to the poverty statistics in Wardner, males aged 16 and 17 years and females aged under 5 years are the age groups that are most secure financially, with 100.0% of males and 100.0% of females in these age groups living above the poverty line.
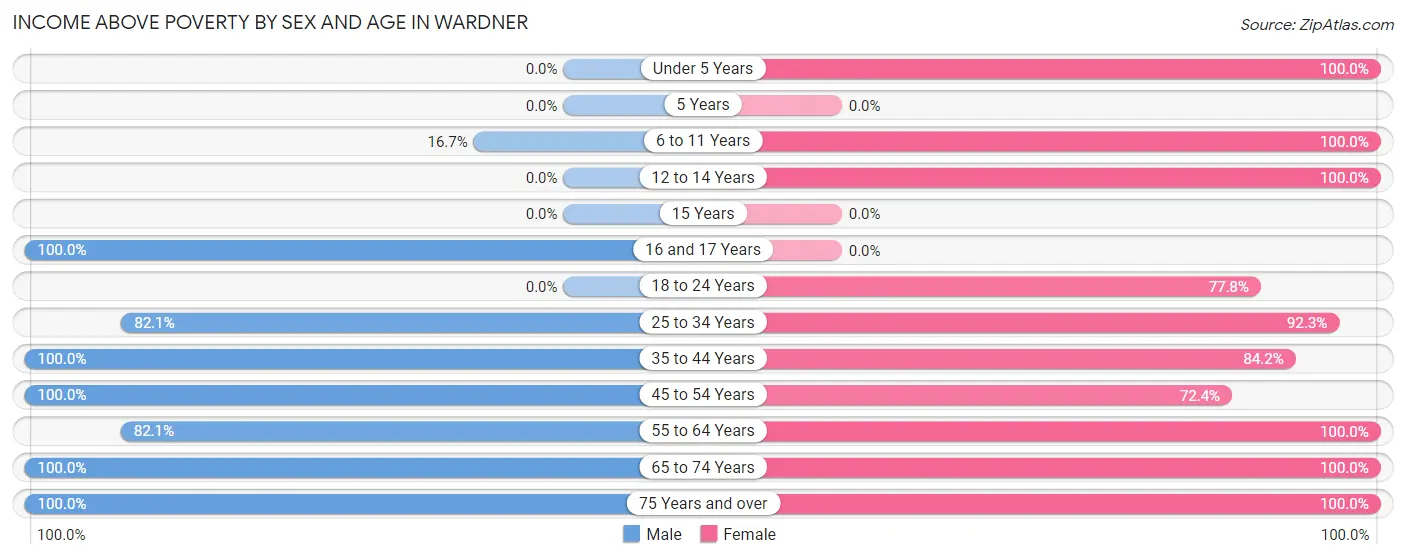
| Age Bracket | Male | Female |
| Under 5 Years | 0 (0.0%) | 4 (100.0%) |
| 5 Years | 0 (0.0%) | 0 (0.0%) |
| 6 to 11 Years | 1 (16.7%) | 15 (100.0%) |
| 12 to 14 Years | 0 (0.0%) | 2 (100.0%) |
| 15 Years | 0 (0.0%) | 0 (0.0%) |
| 16 and 17 Years | 13 (100.0%) | 0 (0.0%) |
| 18 to 24 Years | 0 (0.0%) | 7 (77.8%) |
| 25 to 34 Years | 32 (82.1%) | 60 (92.3%) |
| 35 to 44 Years | 14 (100.0%) | 16 (84.2%) |
| 45 to 54 Years | 7 (100.0%) | 21 (72.4%) |
| 55 to 64 Years | 23 (82.1%) | 14 (100.0%) |
| 65 to 74 Years | 20 (100.0%) | 16 (100.0%) |
| 75 Years and over | 3 (100.0%) | 13 (100.0%) |
| Total | 113 (79.6%) | 168 (89.4%) |
Income Below Poverty Among Married-Couple Families in Wardner
The poverty statistics for married-couple families in Wardner show that 1.3% or 1 of the total 79 families live below the poverty line. Families with 1 or 2 children have the highest poverty rate of 11.1%, comprising of 1 families. On the other hand, families with no children have the lowest poverty rate of 0.0%, which includes 0 families.
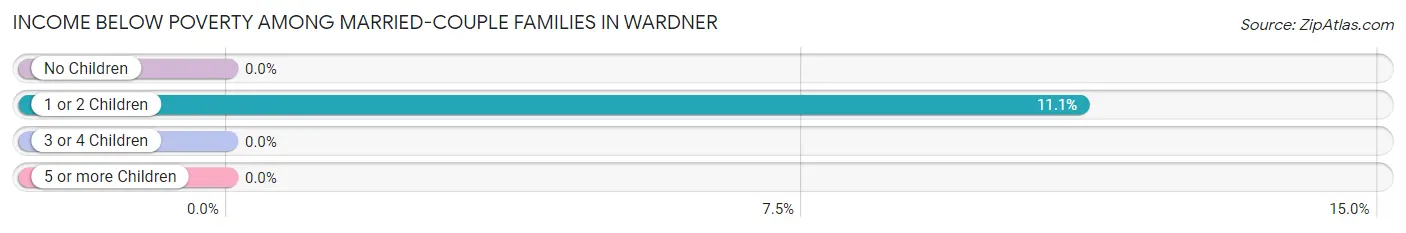
| Children | Above Poverty | Below Poverty |
| No Children | 68 (100.0%) | 0 (0.0%) |
| 1 or 2 Children | 8 (88.9%) | 1 (11.1%) |
| 3 or 4 Children | 2 (100.0%) | 0 (0.0%) |
| 5 or more Children | 0 (0.0%) | 0 (0.0%) |
| Total | 78 (98.7%) | 1 (1.3%) |
Income Below Poverty Among Single-Parent Households in Wardner
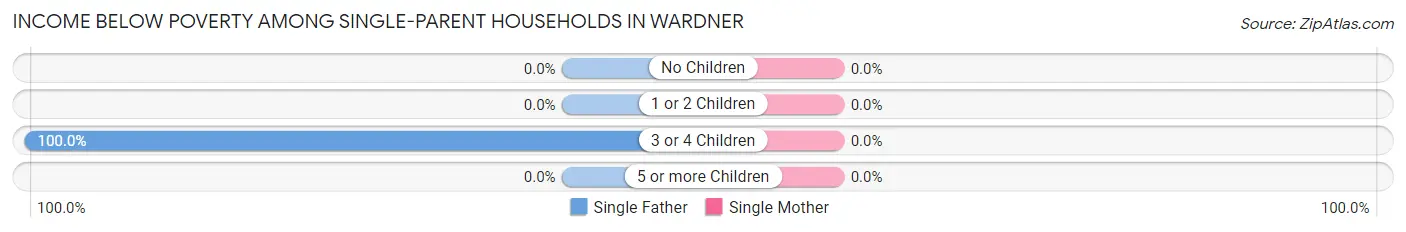
| Children | Single Father | Single Mother |
| No Children | 0 (0.0%) | 0 (0.0%) |
| 1 or 2 Children | 0 (0.0%) | 0 (0.0%) |
| 3 or 4 Children | 6 (100.0%) | 0 (0.0%) |
| 5 or more Children | 0 (0.0%) | 0 (0.0%) |
| Total | 6 (50.0%) | 0 (0.0%) |
Income Below Poverty Among Married-Couple vs Single-Parent Households in Wardner
The poverty data for Wardner shows that 1 of the married-couple family households (1.3%) and 6 of the single-parent households (33.3%) are living below the poverty level. Within the married-couple family households, those with 1 or 2 children have the highest poverty rate, with 1 households (11.1%) falling below the poverty line. Among the single-parent households, those with 3 or 4 children have the highest poverty rate, with 6 household (100.0%) living below poverty.
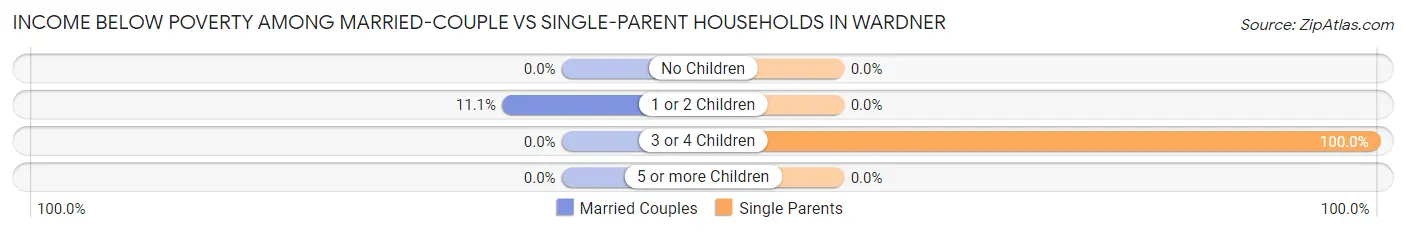
| Children | Married-Couple Families | Single-Parent Households |
| No Children | 0 (0.0%) | 0 (0.0%) |
| 1 or 2 Children | 1 (11.1%) | 0 (0.0%) |
| 3 or 4 Children | 0 (0.0%) | 6 (100.0%) |
| 5 or more Children | 0 (0.0%) | 0 (0.0%) |
| Total | 1 (1.3%) | 6 (33.3%) |
Employment Characteristics in Wardner
Employment by Class of Employer in Wardner
Among the 166 employed individuals in Wardner, private company employees (138 | 83.1%), local government employees (12 | 7.2%), and self-employed (not incorporated) (9 | 5.4%) make up the most common classes of employment.
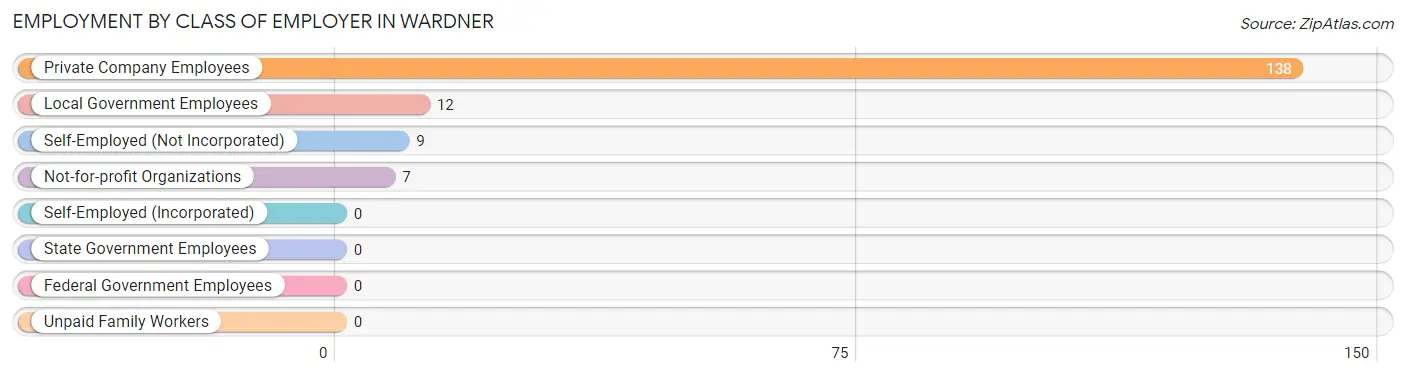
| Employer Class | # Employees | % Employees |
| Private Company Employees | 138 | 83.1% |
| Self-Employed (Incorporated) | 0 | 0.0% |
| Self-Employed (Not Incorporated) | 9 | 5.4% |
| Not-for-profit Organizations | 7 | 4.2% |
| Local Government Employees | 12 | 7.2% |
| State Government Employees | 0 | 0.0% |
| Federal Government Employees | 0 | 0.0% |
| Unpaid Family Workers | 0 | 0.0% |
| Total | 166 | 100.0% |
Employment Status by Age in Wardner
According to the labor force statistics for Wardner, out of the total population over 16 years of age (289), 62.6% or 181 individuals are in the labor force, with 6.6% or 12 of them unemployed. The age group with the highest labor force participation rate is 20 to 24 years, with 100.0% or 2 individuals in the labor force. Within the labor force, the 35 to 44 years age range has the highest percentage of unemployed individuals, with 30.0% or 6 of them being unemployed.
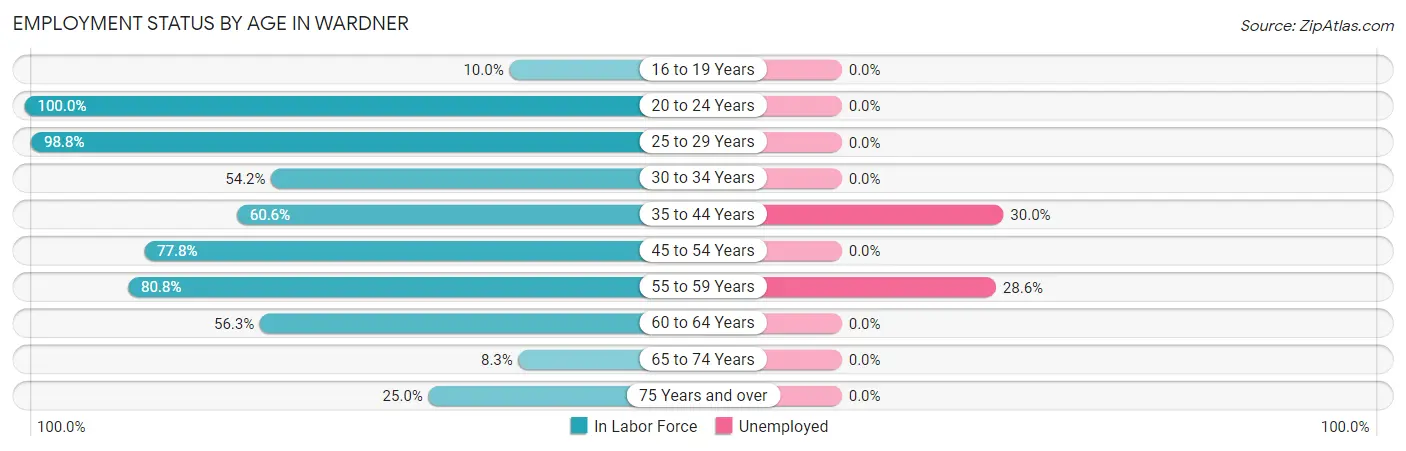
| Age Bracket | In Labor Force | Unemployed |
| 16 to 19 Years | 2 (10.0%) | 0 (0.0%) |
| 20 to 24 Years | 2 (100.0%) | 0 (0.0%) |
| 25 to 29 Years | 79 (98.8%) | 0 (0.0%) |
| 30 to 34 Years | 13 (54.2%) | 0 (0.0%) |
| 35 to 44 Years | 20 (60.6%) | 6 (30.0%) |
| 45 to 54 Years | 28 (77.8%) | 0 (0.0%) |
| 55 to 59 Years | 21 (80.8%) | 6 (28.6%) |
| 60 to 64 Years | 9 (56.3%) | 0 (0.0%) |
| 65 to 74 Years | 3 (8.3%) | 0 (0.0%) |
| 75 Years and over | 4 (25.0%) | 0 (0.0%) |
| Total | 181 (62.6%) | 12 (6.6%) |
Employment Status by Educational Attainment in Wardner
According to labor force statistics for Wardner, 79.1% of individuals (170) out of the total population between 25 and 64 years of age (215) are in the labor force, with 7.1% or 12 of them being unemployed. The group with the highest labor force participation rate are those with the educational attainment of high school diploma, with 96.9% or 126 individuals in the labor force. Within the labor force, individuals with high school diploma education have the highest percentage of unemployment, with 9.5% or 12 of them being unemployed.
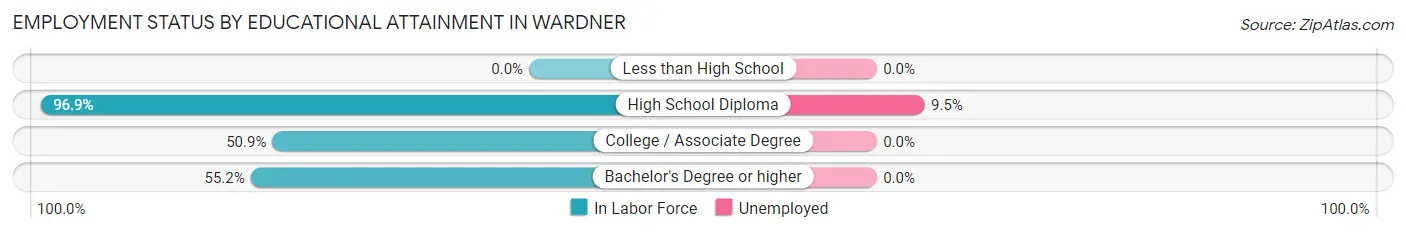
| Educational Attainment | In Labor Force | Unemployed |
| Less than High School | 0 (0.0%) | 0 (0.0%) |
| High School Diploma | 126 (96.9%) | 12 (9.5%) |
| College / Associate Degree | 28 (50.9%) | 0 (0.0%) |
| Bachelor's Degree or higher | 16 (55.2%) | 0 (0.0%) |
| Total | 170 (79.1%) | 15 (7.1%) |
Employment Occupations by Sex in Wardner
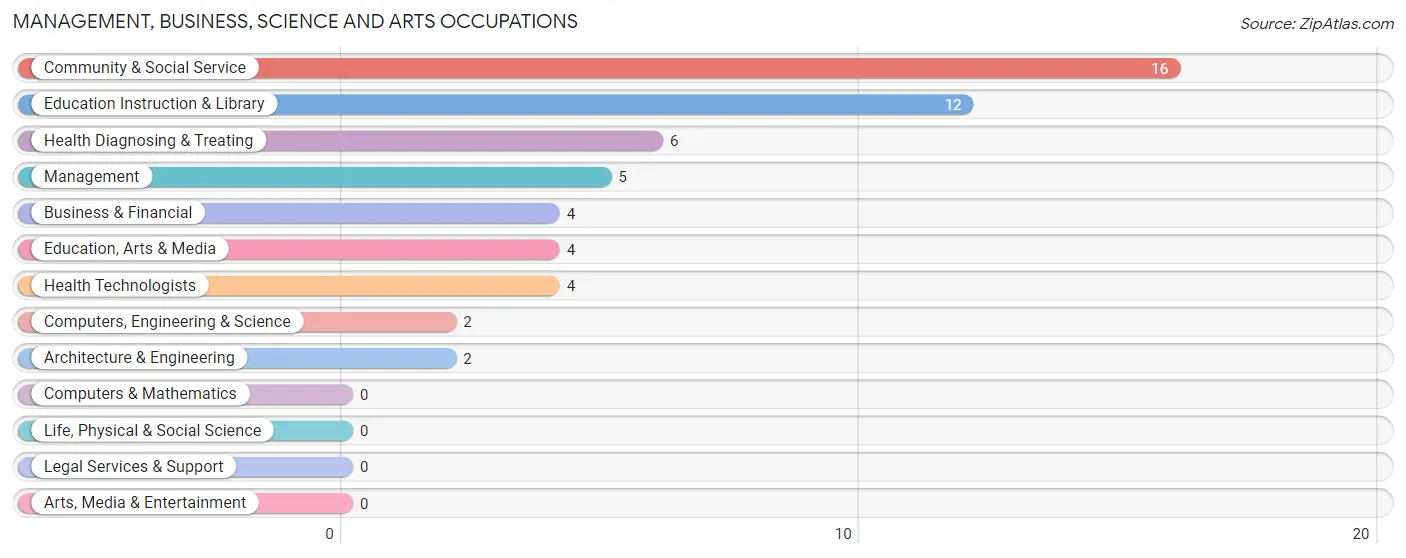
Management, Business, Science and Arts Occupations
The most common Management, Business, Science and Arts occupations in Wardner are Community & Social Service (16 | 9.5%), Education Instruction & Library (12 | 7.1%), Health Diagnosing & Treating (6 | 3.5%), Management (5 | 3.0%), and Business & Financial (4 | 2.4%).
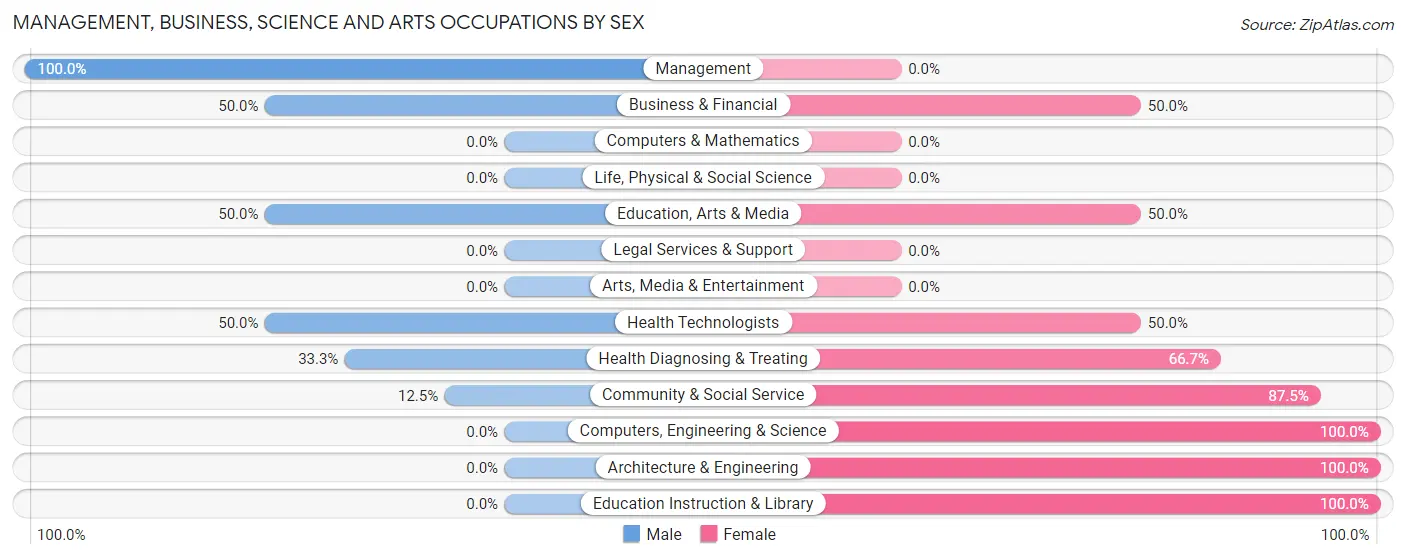
Management, Business, Science and Arts Occupations by Sex
Within the Management, Business, Science and Arts occupations in Wardner, the most male-oriented occupations are Management (100.0%), Business & Financial (50.0%), and Education, Arts & Media (50.0%), while the most female-oriented occupations are Computers, Engineering & Science (100.0%), Architecture & Engineering (100.0%), and Education Instruction & Library (100.0%).
| Occupation | Male | Female |
| Management | 5 (100.0%) | 0 (0.0%) |
| Business & Financial | 2 (50.0%) | 2 (50.0%) |
| Computers, Engineering & Science | 0 (0.0%) | 2 (100.0%) |
| Computers & Mathematics | 0 (0.0%) | 0 (0.0%) |
| Architecture & Engineering | 0 (0.0%) | 2 (100.0%) |
| Life, Physical & Social Science | 0 (0.0%) | 0 (0.0%) |
| Community & Social Service | 2 (12.5%) | 14 (87.5%) |
| Education, Arts & Media | 2 (50.0%) | 2 (50.0%) |
| Legal Services & Support | 0 (0.0%) | 0 (0.0%) |
| Education Instruction & Library | 0 (0.0%) | 12 (100.0%) |
| Arts, Media & Entertainment | 0 (0.0%) | 0 (0.0%) |
| Health Diagnosing & Treating | 2 (33.3%) | 4 (66.7%) |
| Health Technologists | 2 (50.0%) | 2 (50.0%) |
| Total (Category) | 11 (33.3%) | 22 (66.7%) |
| Total (Overall) | 71 (42.0%) | 98 (58.0%) |
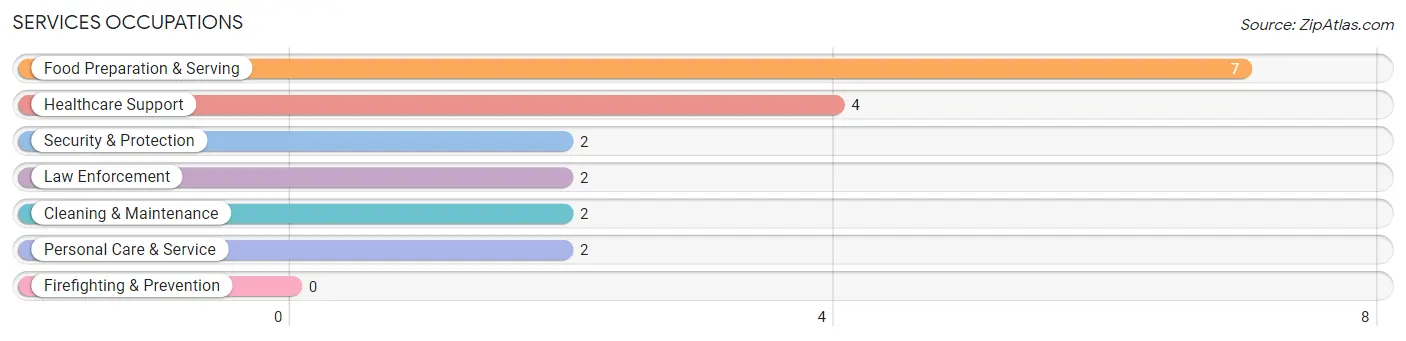
Services Occupations
The most common Services occupations in Wardner are Food Preparation & Serving (7 | 4.1%), Healthcare Support (4 | 2.4%), Security & Protection (2 | 1.2%), Law Enforcement (2 | 1.2%), and Cleaning & Maintenance (2 | 1.2%).
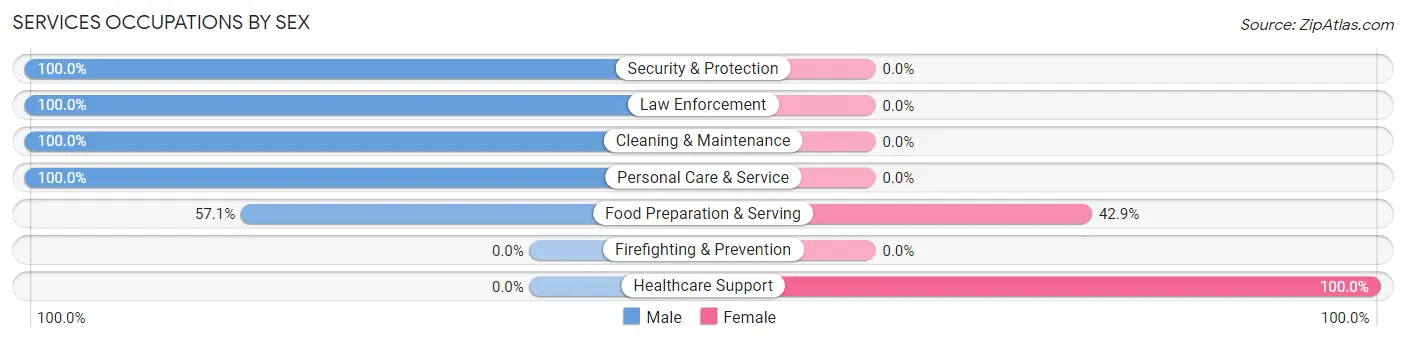
Services Occupations by Sex
Within the Services occupations in Wardner, the most male-oriented occupations are Security & Protection (100.0%), Law Enforcement (100.0%), and Cleaning & Maintenance (100.0%), while the most female-oriented occupations are Healthcare Support (100.0%), and Food Preparation & Serving (42.9%).
| Occupation | Male | Female |
| Healthcare Support | 0 (0.0%) | 4 (100.0%) |
| Security & Protection | 2 (100.0%) | 0 (0.0%) |
| Firefighting & Prevention | 0 (0.0%) | 0 (0.0%) |
| Law Enforcement | 2 (100.0%) | 0 (0.0%) |
| Food Preparation & Serving | 4 (57.1%) | 3 (42.9%) |
| Cleaning & Maintenance | 2 (100.0%) | 0 (0.0%) |
| Personal Care & Service | 2 (100.0%) | 0 (0.0%) |
| Total (Category) | 10 (58.8%) | 7 (41.2%) |
| Total (Overall) | 71 (42.0%) | 98 (58.0%) |
Sales and Office Occupations
The most common Sales and Office occupations in Wardner are Sales & Related (17 | 10.1%), and Office & Administration (7 | 4.1%).
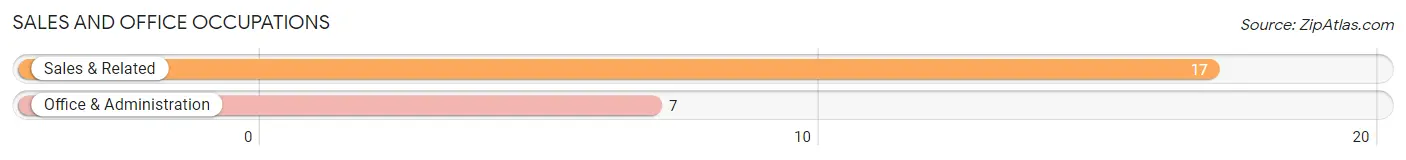
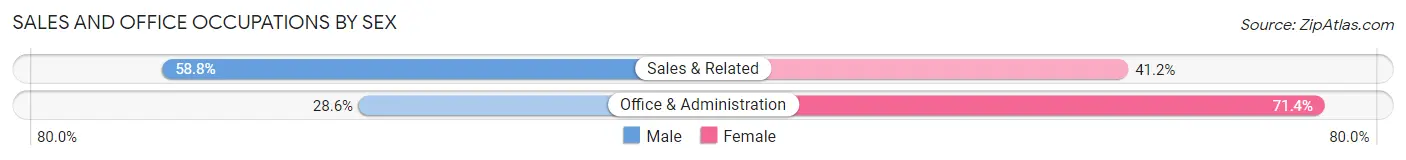
Sales and Office Occupations by Sex
| Occupation | Male | Female |
| Sales & Related | 10 (58.8%) | 7 (41.2%) |
| Office & Administration | 2 (28.6%) | 5 (71.4%) |
| Total (Category) | 12 (50.0%) | 12 (50.0%) |
| Total (Overall) | 71 (42.0%) | 98 (58.0%) |
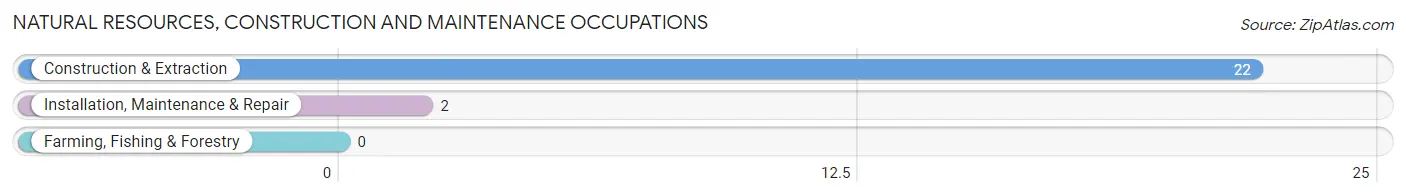
Natural Resources, Construction and Maintenance Occupations
The most common Natural Resources, Construction and Maintenance occupations in Wardner are Construction & Extraction (22 | 13.0%), and Installation, Maintenance & Repair (2 | 1.2%).
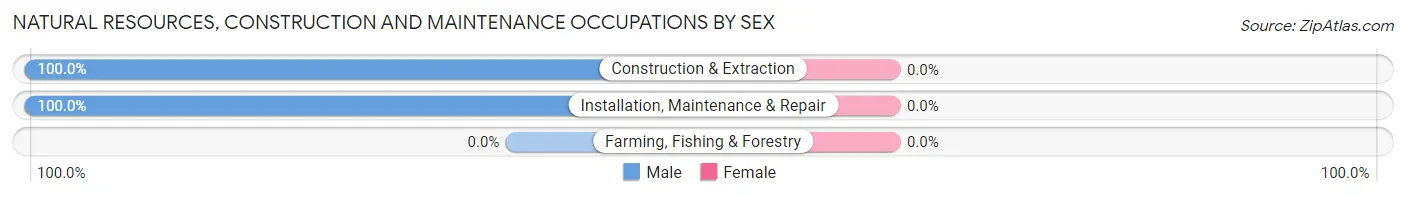
Natural Resources, Construction and Maintenance Occupations by Sex
| Occupation | Male | Female |
| Farming, Fishing & Forestry | 0 (0.0%) | 0 (0.0%) |
| Construction & Extraction | 22 (100.0%) | 0 (0.0%) |
| Installation, Maintenance & Repair | 2 (100.0%) | 0 (0.0%) |
| Total (Category) | 24 (100.0%) | 0 (0.0%) |
| Total (Overall) | 71 (42.0%) | 98 (58.0%) |
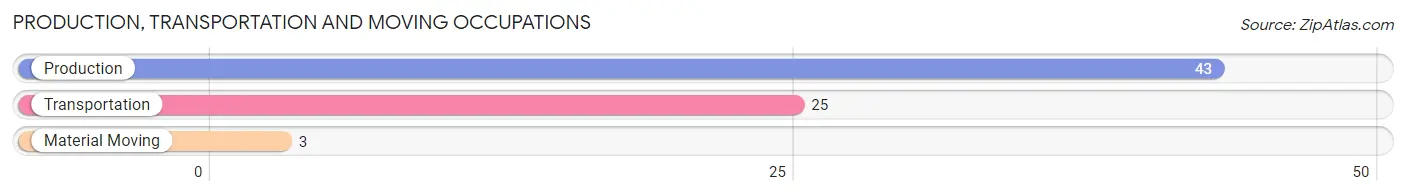
Production, Transportation and Moving Occupations
The most common Production, Transportation and Moving occupations in Wardner are Production (43 | 25.4%), Transportation (25 | 14.8%), and Material Moving (3 | 1.8%).
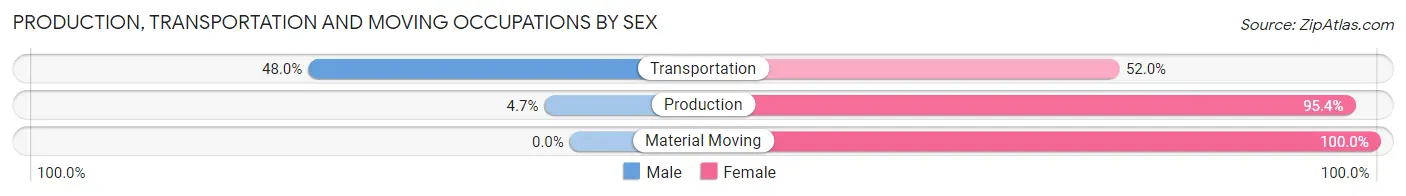
Production, Transportation and Moving Occupations by Sex
| Occupation | Male | Female |
| Production | 2 (4.6%) | 41 (95.4%) |
| Transportation | 12 (48.0%) | 13 (52.0%) |
| Material Moving | 0 (0.0%) | 3 (100.0%) |
| Total (Category) | 14 (19.7%) | 57 (80.3%) |
| Total (Overall) | 71 (42.0%) | 98 (58.0%) |
Employment Industries by Sex in Wardner
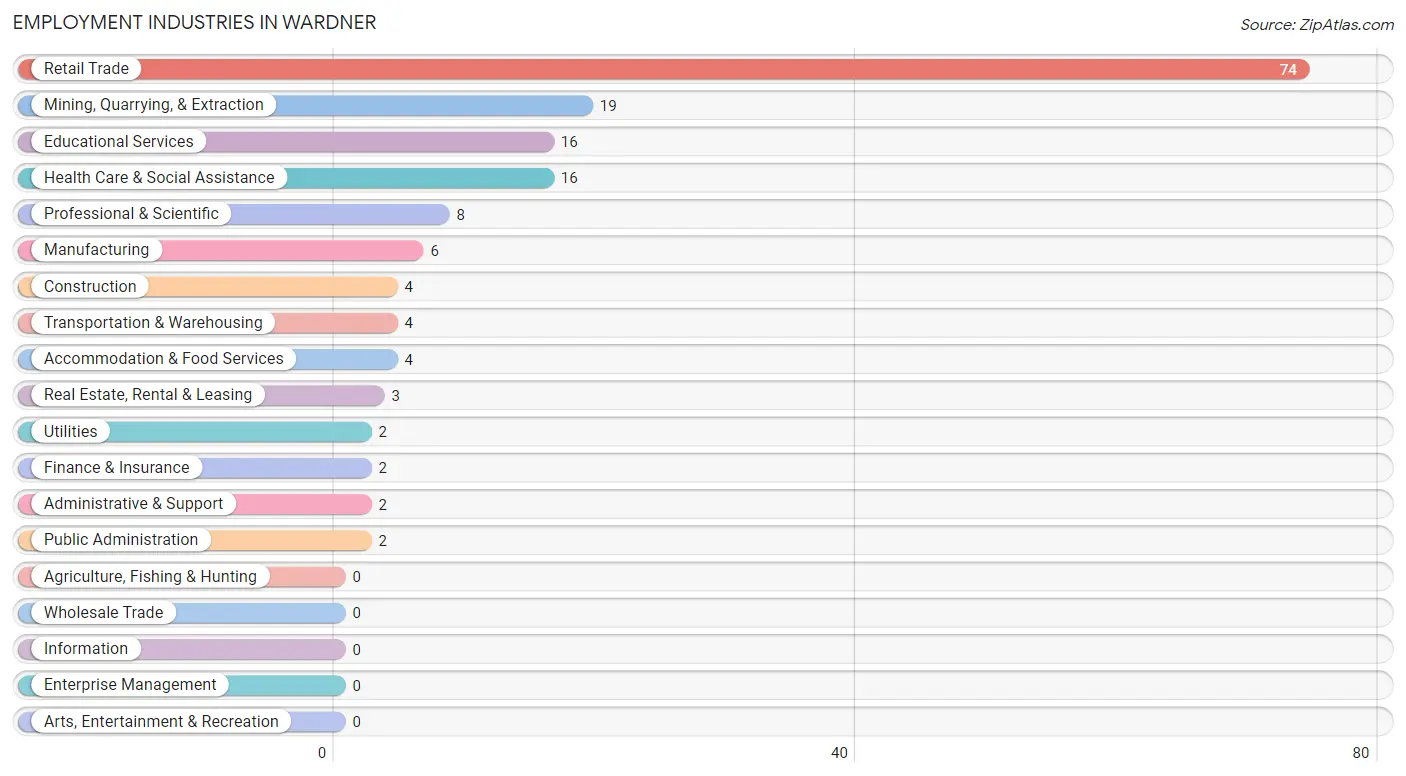
Employment Industries in Wardner
The major employment industries in Wardner include Retail Trade (74 | 43.8%), Mining, Quarrying, & Extraction (19 | 11.2%), Educational Services (16 | 9.5%), Health Care & Social Assistance (16 | 9.5%), and Professional & Scientific (8 | 4.7%).
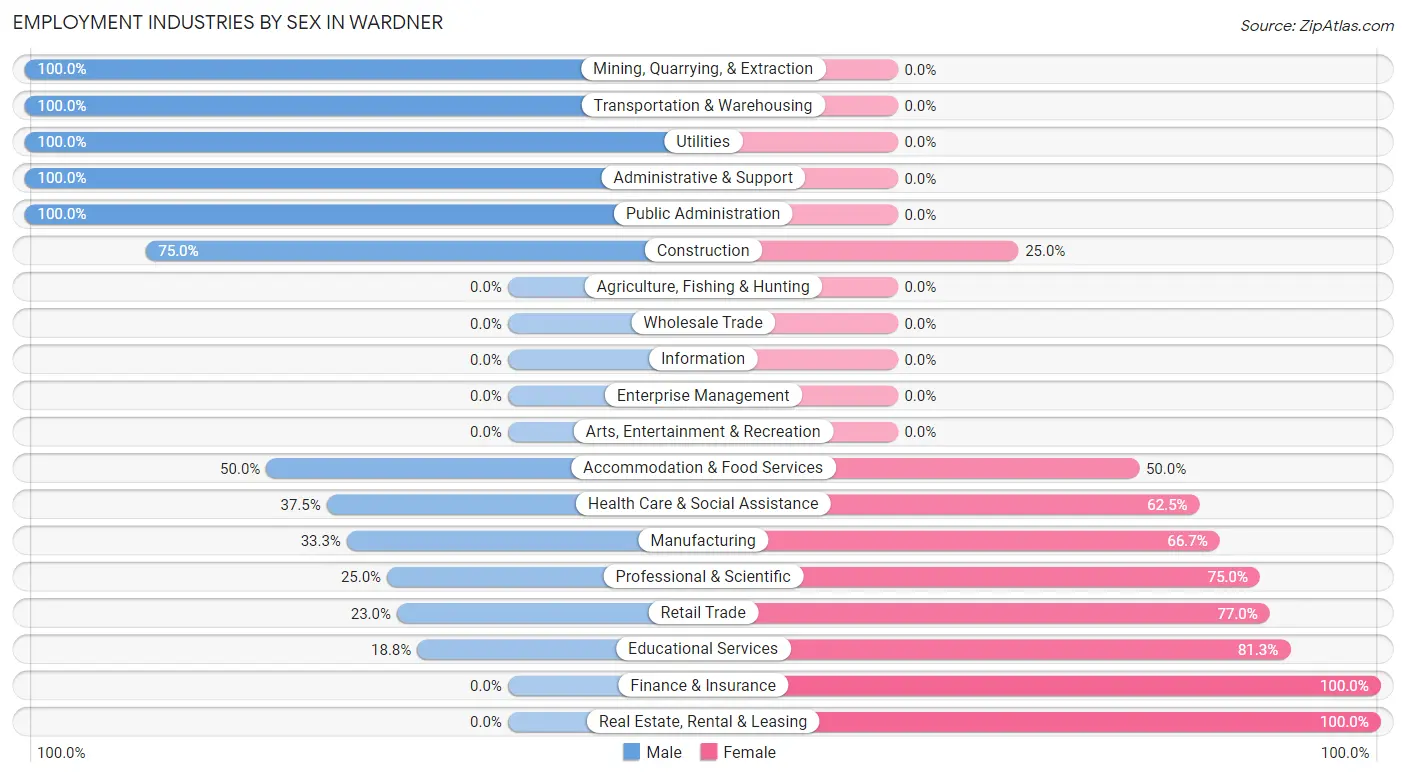
Employment Industries by Sex in Wardner
The Wardner industries that see more men than women are Mining, Quarrying, & Extraction (100.0%), Transportation & Warehousing (100.0%), and Utilities (100.0%), whereas the industries that tend to have a higher number of women are Finance & Insurance (100.0%), Real Estate, Rental & Leasing (100.0%), and Educational Services (81.2%).
| Industry | Male | Female |
| Agriculture, Fishing & Hunting | 0 (0.0%) | 0 (0.0%) |
| Mining, Quarrying, & Extraction | 19 (100.0%) | 0 (0.0%) |
| Construction | 3 (75.0%) | 1 (25.0%) |
| Manufacturing | 2 (33.3%) | 4 (66.7%) |
| Wholesale Trade | 0 (0.0%) | 0 (0.0%) |
| Retail Trade | 17 (23.0%) | 57 (77.0%) |
| Transportation & Warehousing | 4 (100.0%) | 0 (0.0%) |
| Utilities | 2 (100.0%) | 0 (0.0%) |
| Information | 0 (0.0%) | 0 (0.0%) |
| Finance & Insurance | 0 (0.0%) | 2 (100.0%) |
| Real Estate, Rental & Leasing | 0 (0.0%) | 3 (100.0%) |
| Professional & Scientific | 2 (25.0%) | 6 (75.0%) |
| Enterprise Management | 0 (0.0%) | 0 (0.0%) |
| Administrative & Support | 2 (100.0%) | 0 (0.0%) |
| Educational Services | 3 (18.8%) | 13 (81.2%) |
| Health Care & Social Assistance | 6 (37.5%) | 10 (62.5%) |
| Arts, Entertainment & Recreation | 0 (0.0%) | 0 (0.0%) |
| Accommodation & Food Services | 2 (50.0%) | 2 (50.0%) |
| Public Administration | 2 (100.0%) | 0 (0.0%) |
| Total | 71 (42.0%) | 98 (58.0%) |
Education in Wardner
School Enrollment in Wardner
The most common levels of schooling among the 42 students in Wardner are high school (15 | 35.7%), elementary school (9 | 21.4%), and middle school (9 | 21.4%).
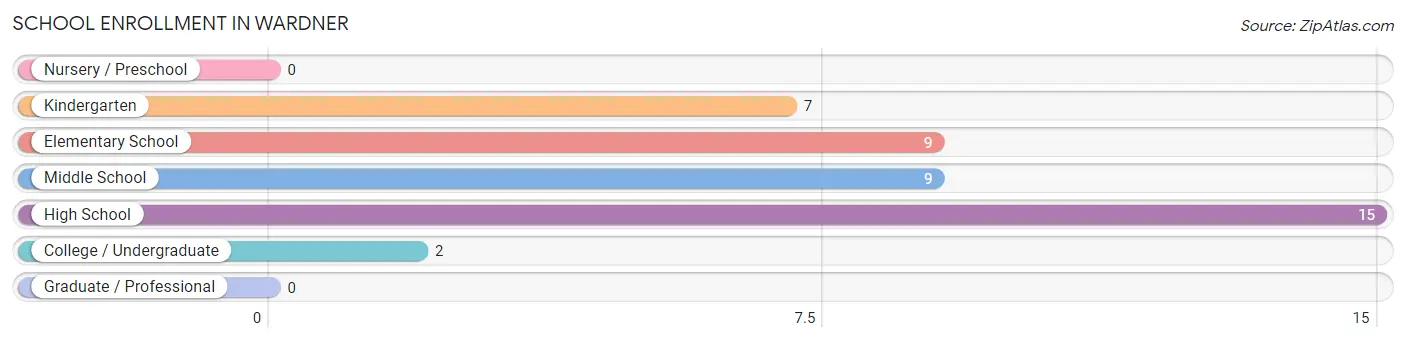
| School Level | # Students | % Students |
| Nursery / Preschool | 0 | 0.0% |
| Kindergarten | 7 | 16.7% |
| Elementary School | 9 | 21.4% |
| Middle School | 9 | 21.4% |
| High School | 15 | 35.7% |
| College / Undergraduate | 2 | 4.8% |
| Graduate / Professional | 0 | 0.0% |
| Total | 42 | 100.0% |
School Enrollment by Age by Funding Source in Wardner
Out of a total of 42 students who are enrolled in schools in Wardner, 14 (33.3%) attend a private institution, while the remaining 28 (66.7%) are enrolled in public schools. The age group of 25 to 34 year olds has the highest likelihood of being enrolled in private schools, with 2 (100.0% in the age bracket) enrolled. Conversely, the age group of 15 to 17 year olds has the lowest likelihood of being enrolled in a private school, with 13 (100.0% in the age bracket) attending a public institution.
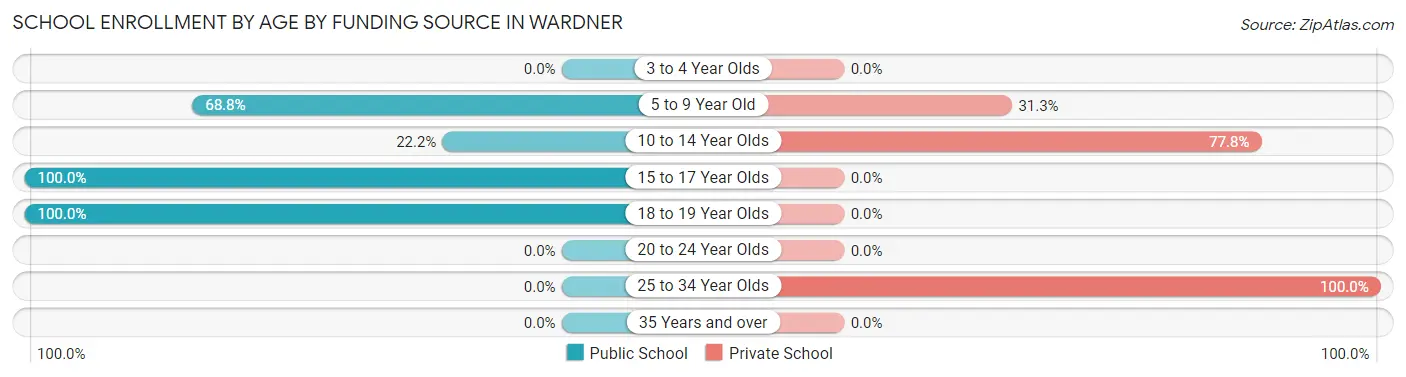
| Age Bracket | Public School | Private School |
| 3 to 4 Year Olds | 0 (0.0%) | 0 (0.0%) |
| 5 to 9 Year Old | 11 (68.8%) | 5 (31.2%) |
| 10 to 14 Year Olds | 2 (22.2%) | 7 (77.8%) |
| 15 to 17 Year Olds | 13 (100.0%) | 0 (0.0%) |
| 18 to 19 Year Olds | 2 (100.0%) | 0 (0.0%) |
| 20 to 24 Year Olds | 0 (0.0%) | 0 (0.0%) |
| 25 to 34 Year Olds | 0 (0.0%) | 2 (100.0%) |
| 35 Years and over | 0 (0.0%) | 0 (0.0%) |
| Total | 28 (66.7%) | 14 (33.3%) |
Educational Attainment by Field of Study in Wardner
Psychology (13 | 25.5%), education (13 | 25.5%), arts & humanities (11 | 21.6%), science & technology (5 | 9.8%), and business (4 | 7.8%) are the most common fields of study among 51 individuals in Wardner who have obtained a bachelor's degree or higher.
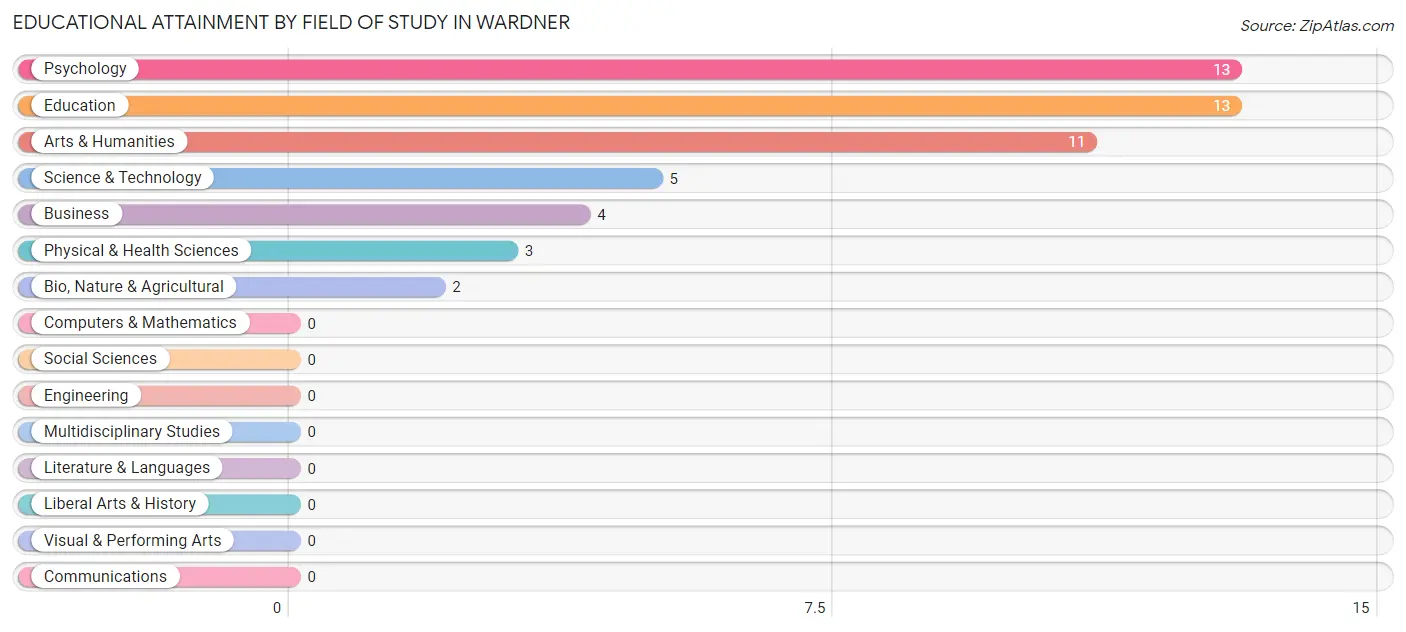
| Field of Study | # Graduates | % Graduates |
| Computers & Mathematics | 0 | 0.0% |
| Bio, Nature & Agricultural | 2 | 3.9% |
| Physical & Health Sciences | 3 | 5.9% |
| Psychology | 13 | 25.5% |
| Social Sciences | 0 | 0.0% |
| Engineering | 0 | 0.0% |
| Multidisciplinary Studies | 0 | 0.0% |
| Science & Technology | 5 | 9.8% |
| Business | 4 | 7.8% |
| Education | 13 | 25.5% |
| Literature & Languages | 0 | 0.0% |
| Liberal Arts & History | 0 | 0.0% |
| Visual & Performing Arts | 0 | 0.0% |
| Communications | 0 | 0.0% |
| Arts & Humanities | 11 | 21.6% |
| Total | 51 | 100.0% |
Transportation & Commute in Wardner
Vehicle Availability by Sex in Wardner
The most prevalent vehicle ownership categories in Wardner are males with 2 vehicles (37, accounting for 53.6%) and females with 2 vehicles (79, making up 38.1%).
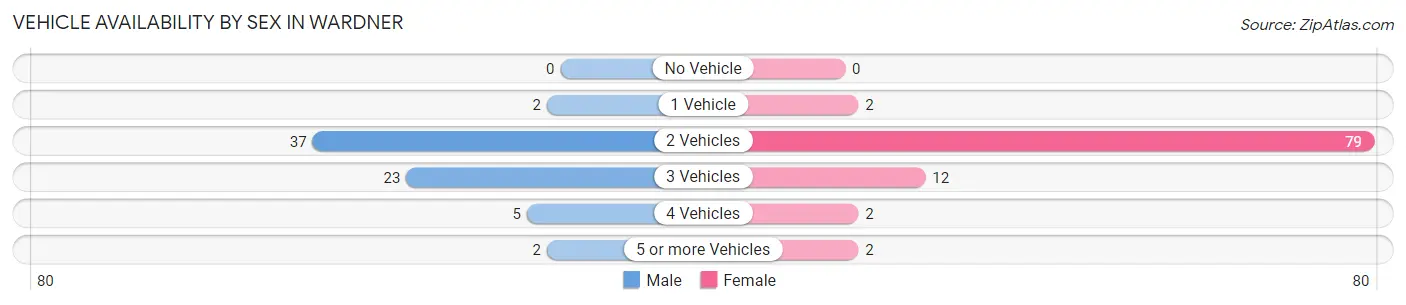
| Vehicles Available | Male | Female |
| No Vehicle | 0 (0.0%) | 0 (0.0%) |
| 1 Vehicle | 2 (2.9%) | 2 (2.1%) |
| 2 Vehicles | 37 (53.6%) | 79 (81.4%) |
| 3 Vehicles | 23 (33.3%) | 12 (12.4%) |
| 4 Vehicles | 5 (7.2%) | 2 (2.1%) |
| 5 or more Vehicles | 2 (2.9%) | 2 (2.1%) |
| Total | 69 (100.0%) | 97 (100.0%) |
Commute Time in Wardner
The most frequently occuring commute durations in Wardner are 60 to 89 minutes (42 commuters, 26.3%), less than 5 minutes (21 commuters, 13.1%), and 5 to 9 minutes (21 commuters, 13.1%).
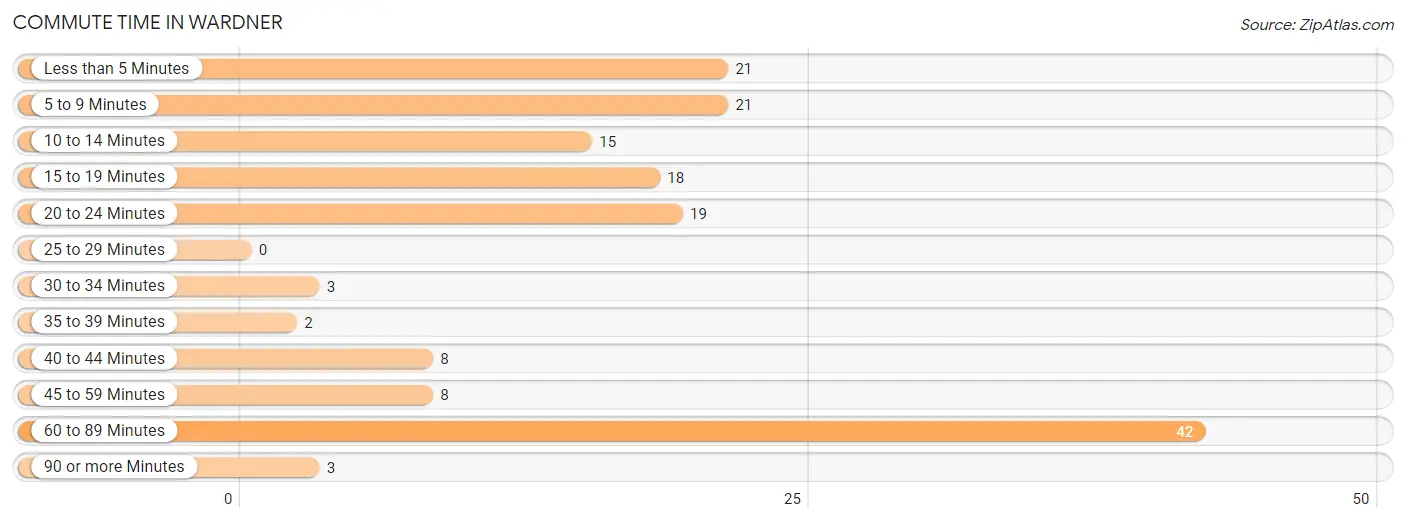
| Commute Time | # Commuters | % Commuters |
| Less than 5 Minutes | 21 | 13.1% |
| 5 to 9 Minutes | 21 | 13.1% |
| 10 to 14 Minutes | 15 | 9.4% |
| 15 to 19 Minutes | 18 | 11.3% |
| 20 to 24 Minutes | 19 | 11.9% |
| 25 to 29 Minutes | 0 | 0.0% |
| 30 to 34 Minutes | 3 | 1.9% |
| 35 to 39 Minutes | 2 | 1.3% |
| 40 to 44 Minutes | 8 | 5.0% |
| 45 to 59 Minutes | 8 | 5.0% |
| 60 to 89 Minutes | 42 | 26.3% |
| 90 or more Minutes | 3 | 1.9% |
Commute Time by Sex in Wardner
The most common commute times in Wardner are 20 to 24 minutes (19 commuters, 28.4%) for males and 60 to 89 minutes (39 commuters, 41.9%) for females.
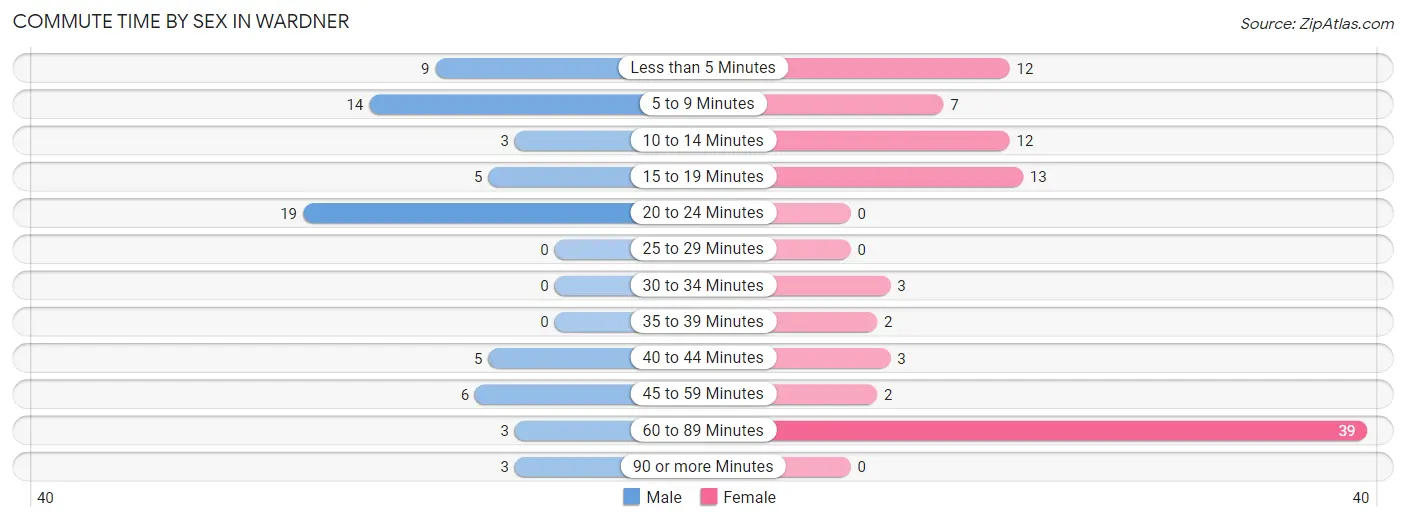
| Commute Time | Male | Female |
| Less than 5 Minutes | 9 (13.4%) | 12 (12.9%) |
| 5 to 9 Minutes | 14 (20.9%) | 7 (7.5%) |
| 10 to 14 Minutes | 3 (4.5%) | 12 (12.9%) |
| 15 to 19 Minutes | 5 (7.5%) | 13 (14.0%) |
| 20 to 24 Minutes | 19 (28.4%) | 0 (0.0%) |
| 25 to 29 Minutes | 0 (0.0%) | 0 (0.0%) |
| 30 to 34 Minutes | 0 (0.0%) | 3 (3.2%) |
| 35 to 39 Minutes | 0 (0.0%) | 2 (2.1%) |
| 40 to 44 Minutes | 5 (7.5%) | 3 (3.2%) |
| 45 to 59 Minutes | 6 (9.0%) | 2 (2.1%) |
| 60 to 89 Minutes | 3 (4.5%) | 39 (41.9%) |
| 90 or more Minutes | 3 (4.5%) | 0 (0.0%) |
Time of Departure to Work by Sex in Wardner
The most frequent times of departure to work in Wardner are 12:00 PM to 3:59 PM (19, 28.4%) for males and 6:00 AM to 6:29 AM (39, 41.9%) for females.
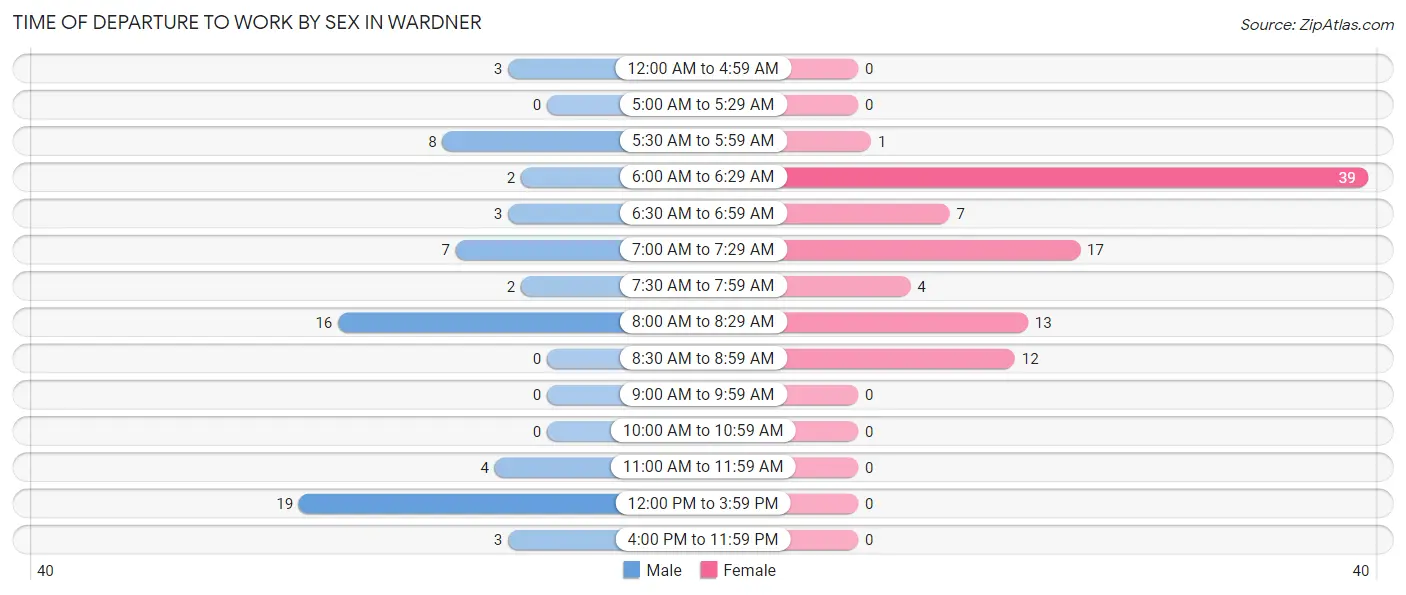
| Time of Departure | Male | Female |
| 12:00 AM to 4:59 AM | 3 (4.5%) | 0 (0.0%) |
| 5:00 AM to 5:29 AM | 0 (0.0%) | 0 (0.0%) |
| 5:30 AM to 5:59 AM | 8 (11.9%) | 1 (1.1%) |
| 6:00 AM to 6:29 AM | 2 (3.0%) | 39 (41.9%) |
| 6:30 AM to 6:59 AM | 3 (4.5%) | 7 (7.5%) |
| 7:00 AM to 7:29 AM | 7 (10.4%) | 17 (18.3%) |
| 7:30 AM to 7:59 AM | 2 (3.0%) | 4 (4.3%) |
| 8:00 AM to 8:29 AM | 16 (23.9%) | 13 (14.0%) |
| 8:30 AM to 8:59 AM | 0 (0.0%) | 12 (12.9%) |
| 9:00 AM to 9:59 AM | 0 (0.0%) | 0 (0.0%) |
| 10:00 AM to 10:59 AM | 0 (0.0%) | 0 (0.0%) |
| 11:00 AM to 11:59 AM | 4 (6.0%) | 0 (0.0%) |
| 12:00 PM to 3:59 PM | 19 (28.4%) | 0 (0.0%) |
| 4:00 PM to 11:59 PM | 3 (4.5%) | 0 (0.0%) |
| Total | 67 (100.0%) | 93 (100.0%) |
Housing Occupancy in Wardner
Occupancy by Ownership in Wardner
Of the total 132 dwellings in Wardner, owner-occupied units account for 70 (53.0%), while renter-occupied units make up 62 (47.0%).
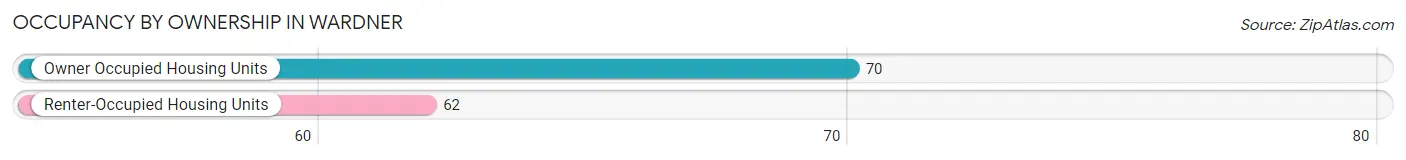
| Occupancy | # Housing Units | % Housing Units |
| Owner Occupied Housing Units | 70 | 53.0% |
| Renter-Occupied Housing Units | 62 | 47.0% |
| Total Occupied Housing Units | 132 | 100.0% |
Occupancy by Household Size in Wardner
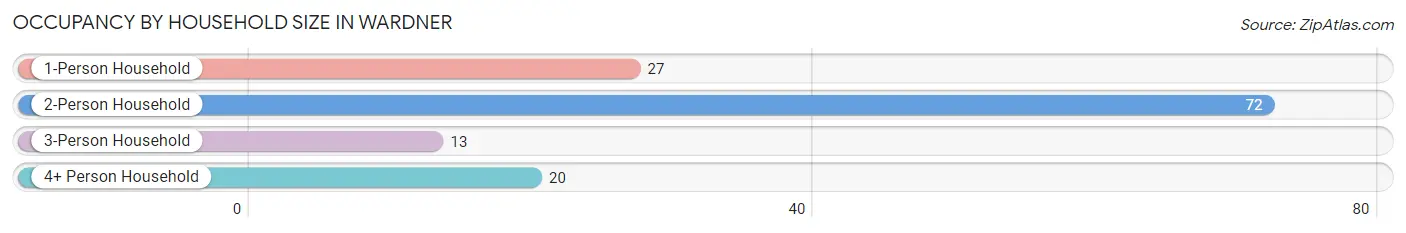
| Household Size | # Housing Units | % Housing Units |
| 1-Person Household | 27 | 20.4% |
| 2-Person Household | 72 | 54.5% |
| 3-Person Household | 13 | 9.9% |
| 4+ Person Household | 20 | 15.1% |
| Total Housing Units | 132 | 100.0% |
Occupancy by Ownership by Household Size in Wardner
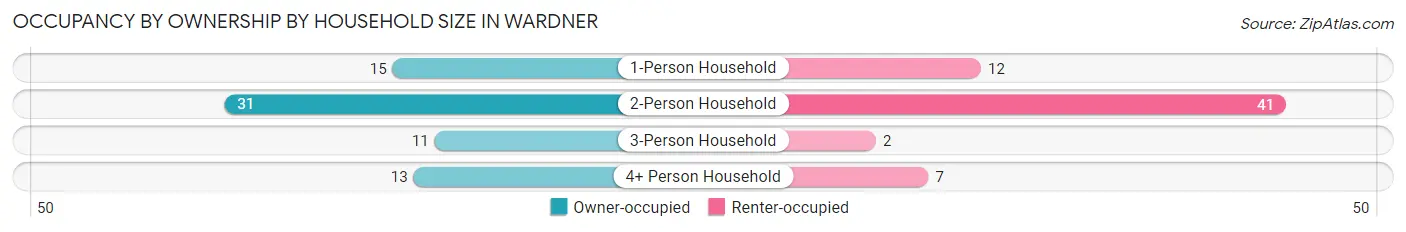
| Household Size | Owner-occupied | Renter-occupied |
| 1-Person Household | 15 (55.6%) | 12 (44.4%) |
| 2-Person Household | 31 (43.1%) | 41 (56.9%) |
| 3-Person Household | 11 (84.6%) | 2 (15.4%) |
| 4+ Person Household | 13 (65.0%) | 7 (35.0%) |
| Total Housing Units | 70 (53.0%) | 62 (47.0%) |
Occupancy by Educational Attainment in Wardner
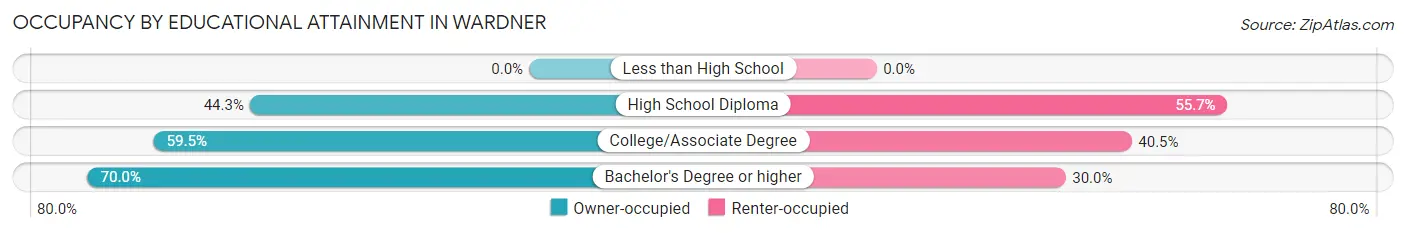
| Household Size | Owner-occupied | Renter-occupied |
| Less than High School | 0 (0.0%) | 0 (0.0%) |
| High School Diploma | 31 (44.3%) | 39 (55.7%) |
| College/Associate Degree | 25 (59.5%) | 17 (40.5%) |
| Bachelor's Degree or higher | 14 (70.0%) | 6 (30.0%) |
Occupancy by Age of Householder in Wardner
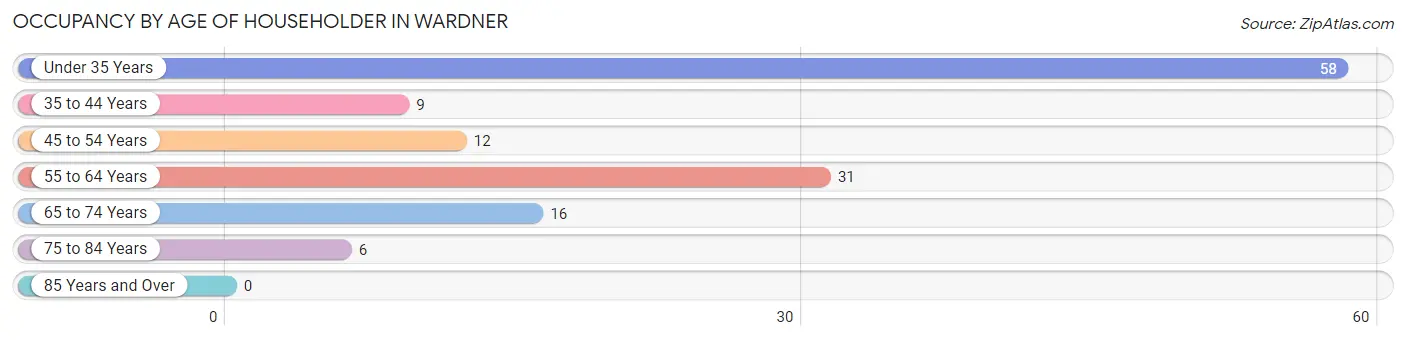
| Age Bracket | # Households | % Households |
| Under 35 Years | 58 | 43.9% |
| 35 to 44 Years | 9 | 6.8% |
| 45 to 54 Years | 12 | 9.1% |
| 55 to 64 Years | 31 | 23.5% |
| 65 to 74 Years | 16 | 12.1% |
| 75 to 84 Years | 6 | 4.5% |
| 85 Years and Over | 0 | 0.0% |
| Total | 132 | 100.0% |
Housing Finances in Wardner
Median Income by Occupancy in Wardner
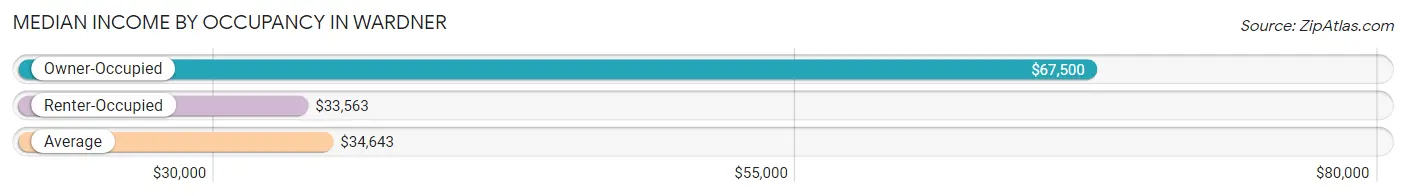
| Occupancy Type | # Households | Median Income |
| Owner-Occupied | 70 (53.0%) | $67,500 |
| Renter-Occupied | 62 (47.0%) | $33,563 |
| Average | 132 (100.0%) | $34,643 |
Occupancy by Householder Income Bracket in Wardner
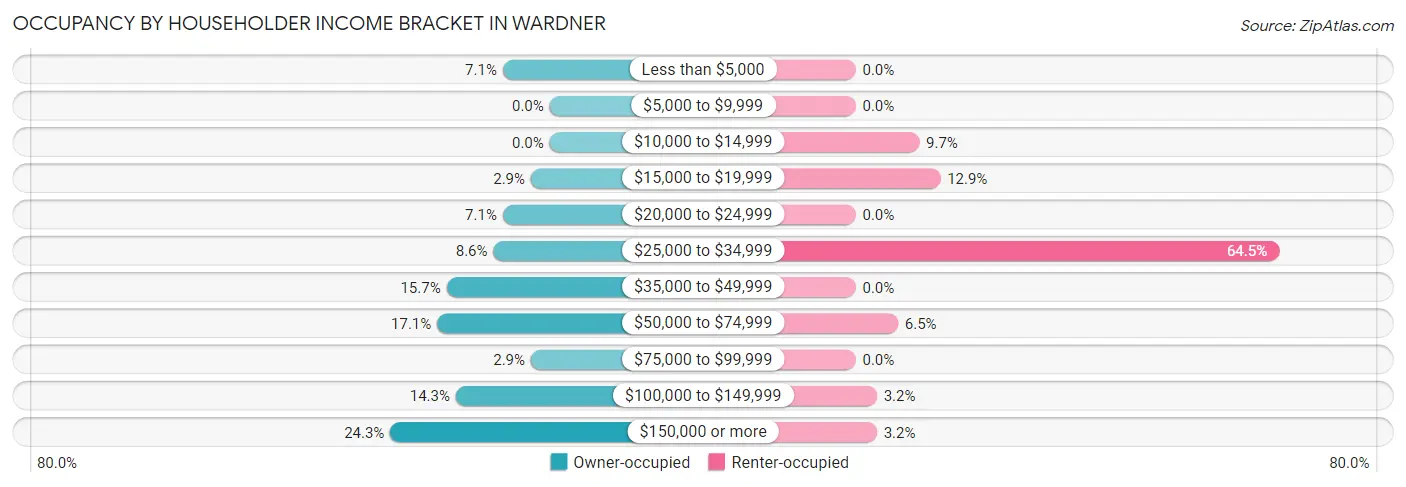
| Income Bracket | Owner-occupied | Renter-occupied |
| Less than $5,000 | 5 (7.1%) | 0 (0.0%) |
| $5,000 to $9,999 | 0 (0.0%) | 0 (0.0%) |
| $10,000 to $14,999 | 0 (0.0%) | 6 (9.7%) |
| $15,000 to $19,999 | 2 (2.9%) | 8 (12.9%) |
| $20,000 to $24,999 | 5 (7.1%) | 0 (0.0%) |
| $25,000 to $34,999 | 6 (8.6%) | 40 (64.5%) |
| $35,000 to $49,999 | 11 (15.7%) | 0 (0.0%) |
| $50,000 to $74,999 | 12 (17.1%) | 4 (6.5%) |
| $75,000 to $99,999 | 2 (2.9%) | 0 (0.0%) |
| $100,000 to $149,999 | 10 (14.3%) | 2 (3.2%) |
| $150,000 or more | 17 (24.3%) | 2 (3.2%) |
| Total | 70 (100.0%) | 62 (100.0%) |
Monthly Housing Cost Tiers in Wardner
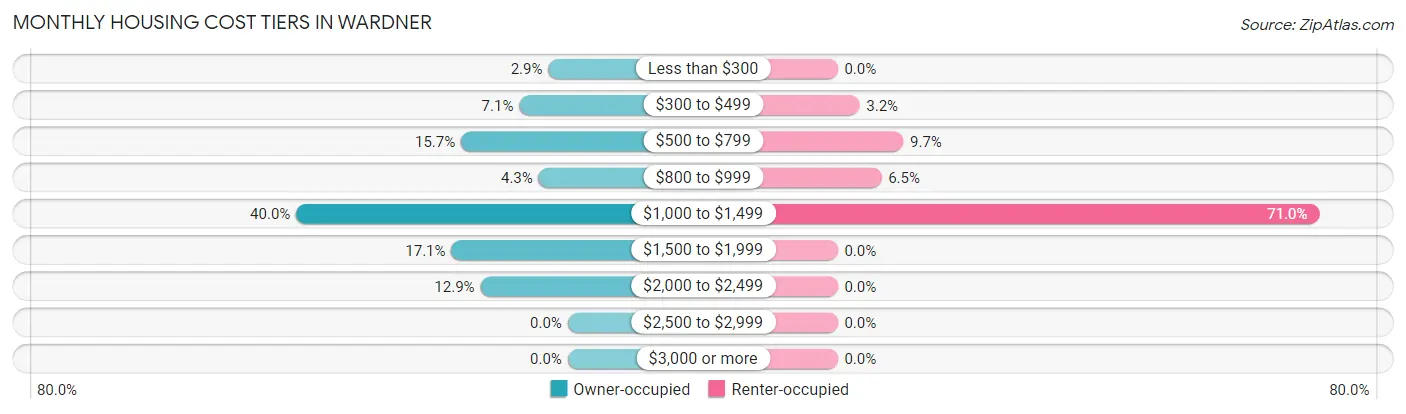
| Monthly Cost | Owner-occupied | Renter-occupied |
| Less than $300 | 2 (2.9%) | 0 (0.0%) |
| $300 to $499 | 5 (7.1%) | 2 (3.2%) |
| $500 to $799 | 11 (15.7%) | 6 (9.7%) |
| $800 to $999 | 3 (4.3%) | 4 (6.5%) |
| $1,000 to $1,499 | 28 (40.0%) | 44 (71.0%) |
| $1,500 to $1,999 | 12 (17.1%) | 0 (0.0%) |
| $2,000 to $2,499 | 9 (12.9%) | 0 (0.0%) |
| $2,500 to $2,999 | 0 (0.0%) | 0 (0.0%) |
| $3,000 or more | 0 (0.0%) | 0 (0.0%) |
| Total | 70 (100.0%) | 62 (100.0%) |
Physical Housing Characteristics in Wardner
Housing Structures in Wardner
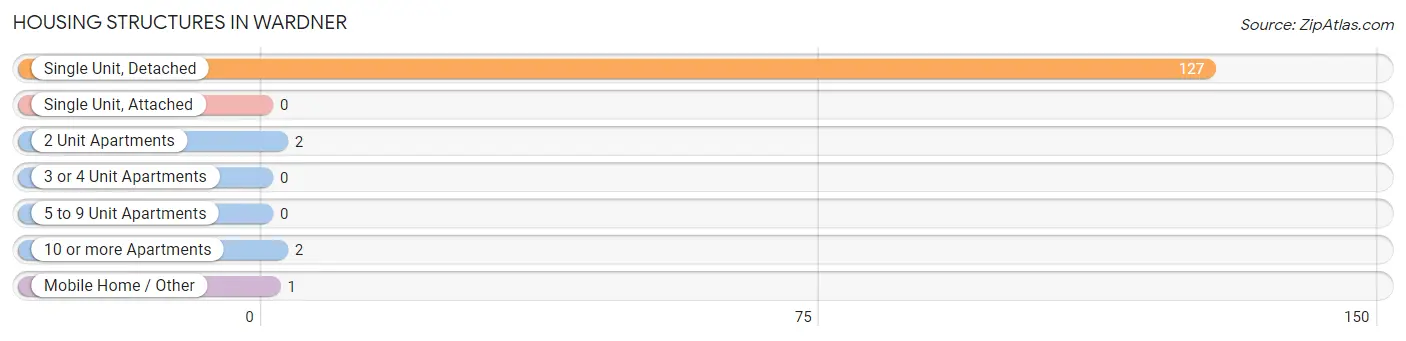
| Structure Type | # Housing Units | % Housing Units |
| Single Unit, Detached | 127 | 96.2% |
| Single Unit, Attached | 0 | 0.0% |
| 2 Unit Apartments | 2 | 1.5% |
| 3 or 4 Unit Apartments | 0 | 0.0% |
| 5 to 9 Unit Apartments | 0 | 0.0% |
| 10 or more Apartments | 2 | 1.5% |
| Mobile Home / Other | 1 | 0.8% |
| Total | 132 | 100.0% |
Housing Structures by Occupancy in Wardner
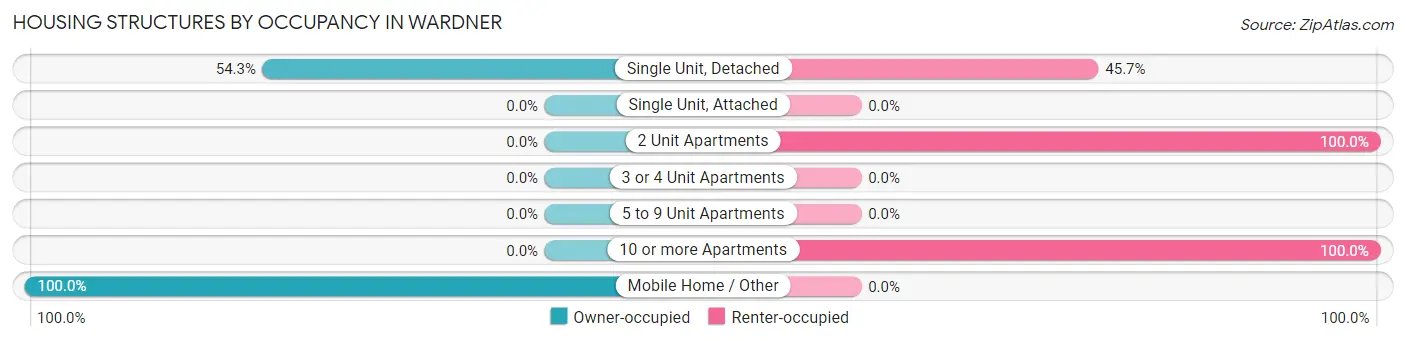
| Structure Type | Owner-occupied | Renter-occupied |
| Single Unit, Detached | 69 (54.3%) | 58 (45.7%) |
| Single Unit, Attached | 0 (0.0%) | 0 (0.0%) |
| 2 Unit Apartments | 0 (0.0%) | 2 (100.0%) |
| 3 or 4 Unit Apartments | 0 (0.0%) | 0 (0.0%) |
| 5 to 9 Unit Apartments | 0 (0.0%) | 0 (0.0%) |
| 10 or more Apartments | 0 (0.0%) | 2 (100.0%) |
| Mobile Home / Other | 1 (100.0%) | 0 (0.0%) |
| Total | 70 (53.0%) | 62 (47.0%) |
Housing Structures by Number of Rooms in Wardner
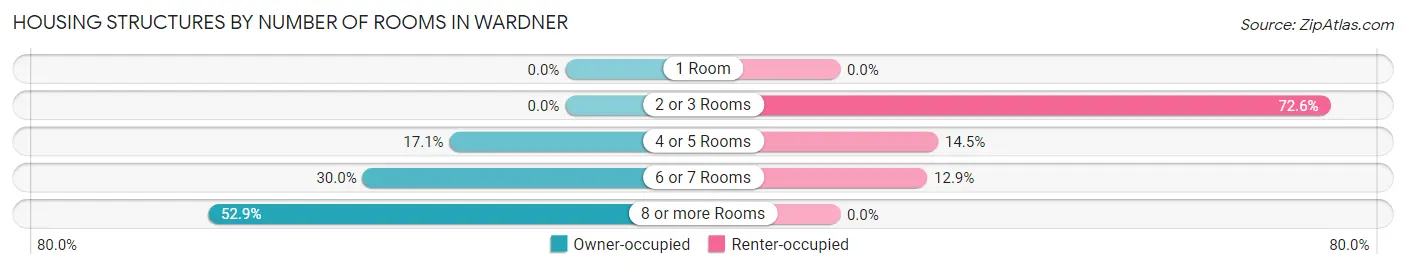
| Number of Rooms | Owner-occupied | Renter-occupied |
| 1 Room | 0 (0.0%) | 0 (0.0%) |
| 2 or 3 Rooms | 0 (0.0%) | 45 (72.6%) |
| 4 or 5 Rooms | 12 (17.1%) | 9 (14.5%) |
| 6 or 7 Rooms | 21 (30.0%) | 8 (12.9%) |
| 8 or more Rooms | 37 (52.9%) | 0 (0.0%) |
| Total | 70 (100.0%) | 62 (100.0%) |
Housing Structure by Heating Type in Wardner
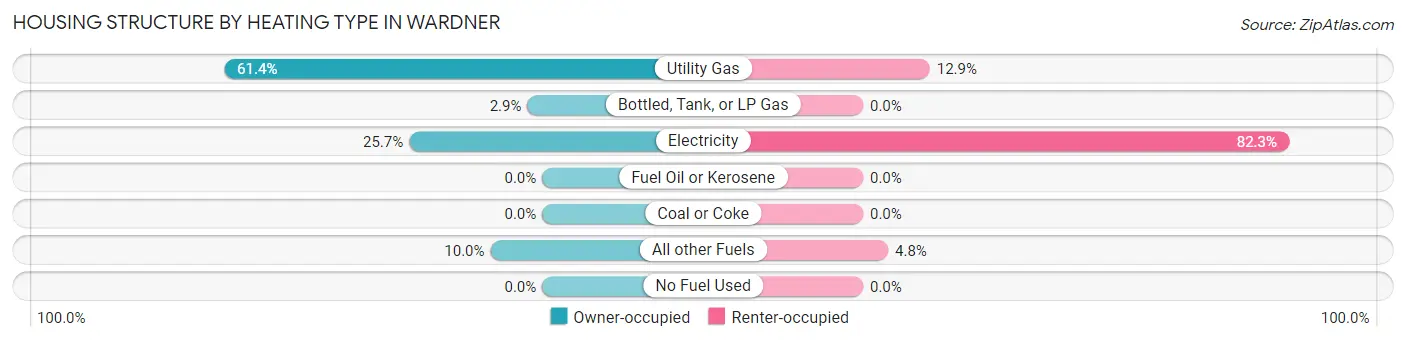
| Heating Type | Owner-occupied | Renter-occupied |
| Utility Gas | 43 (61.4%) | 8 (12.9%) |
| Bottled, Tank, or LP Gas | 2 (2.9%) | 0 (0.0%) |
| Electricity | 18 (25.7%) | 51 (82.3%) |
| Fuel Oil or Kerosene | 0 (0.0%) | 0 (0.0%) |
| Coal or Coke | 0 (0.0%) | 0 (0.0%) |
| All other Fuels | 7 (10.0%) | 3 (4.8%) |
| No Fuel Used | 0 (0.0%) | 0 (0.0%) |
| Total | 70 (100.0%) | 62 (100.0%) |
Household Vehicle Usage in Wardner
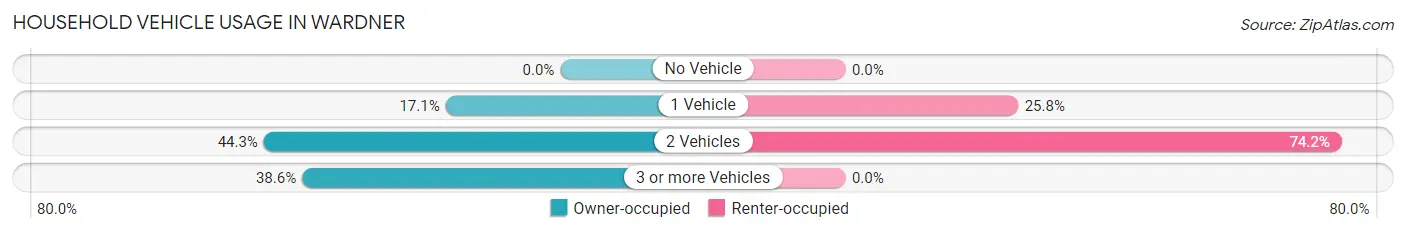
| Vehicles per Household | Owner-occupied | Renter-occupied |
| No Vehicle | 0 (0.0%) | 0 (0.0%) |
| 1 Vehicle | 12 (17.1%) | 16 (25.8%) |
| 2 Vehicles | 31 (44.3%) | 46 (74.2%) |
| 3 or more Vehicles | 27 (38.6%) | 0 (0.0%) |
| Total | 70 (100.0%) | 62 (100.0%) |
Real Estate & Mortgages in Wardner
Real Estate and Mortgage Overview in Wardner
| Characteristic | Without Mortgage | With Mortgage |
| Housing Units | 13 | 57 |
| Median Property Value | $225,000 | $315,600 |
| Median Household Income | - | - |
| Monthly Housing Costs | $525 | $0 |
| Real Estate Taxes | $1,875 | $0 |
Property Value by Mortgage Status in Wardner
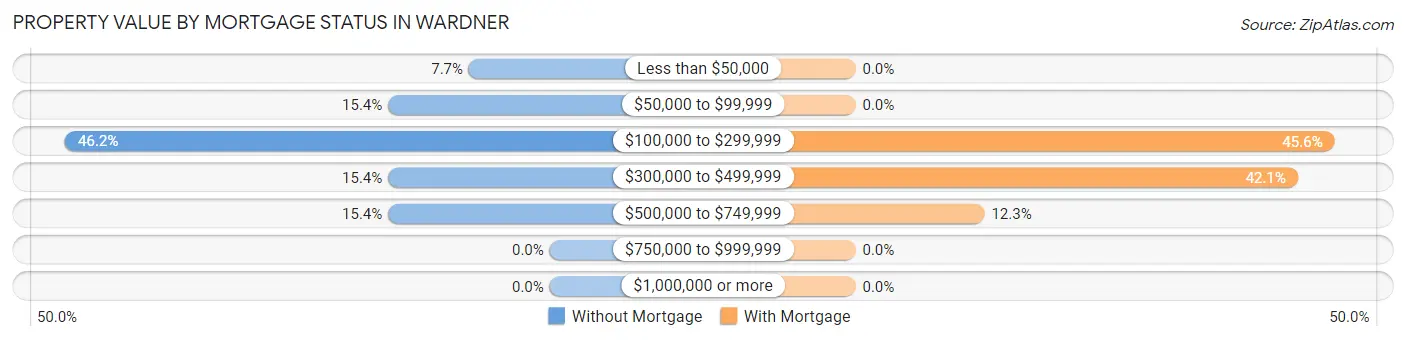
| Property Value | Without Mortgage | With Mortgage |
| Less than $50,000 | 1 (7.7%) | 0 (0.0%) |
| $50,000 to $99,999 | 2 (15.4%) | 0 (0.0%) |
| $100,000 to $299,999 | 6 (46.2%) | 26 (45.6%) |
| $300,000 to $499,999 | 2 (15.4%) | 24 (42.1%) |
| $500,000 to $749,999 | 2 (15.4%) | 7 (12.3%) |
| $750,000 to $999,999 | 0 (0.0%) | 0 (0.0%) |
| $1,000,000 or more | 0 (0.0%) | 0 (0.0%) |
| Total | 13 (100.0%) | 57 (100.0%) |
Household Income by Mortgage Status in Wardner
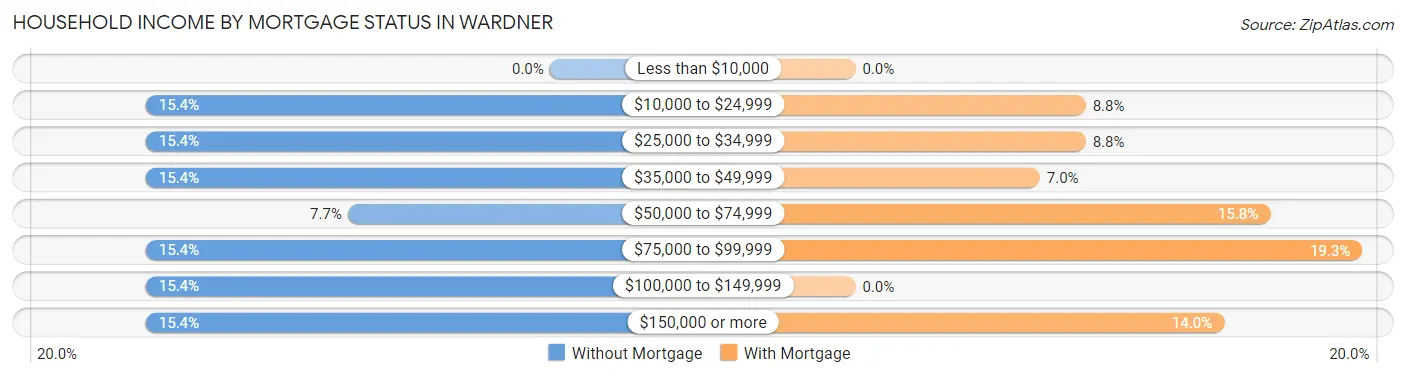
| Household Income | Without Mortgage | With Mortgage |
| Less than $10,000 | 0 (0.0%) | 0 (0.0%) |
| $10,000 to $24,999 | 2 (15.4%) | 5 (8.8%) |
| $25,000 to $34,999 | 2 (15.4%) | 5 (8.8%) |
| $35,000 to $49,999 | 2 (15.4%) | 4 (7.0%) |
| $50,000 to $74,999 | 1 (7.7%) | 9 (15.8%) |
| $75,000 to $99,999 | 2 (15.4%) | 11 (19.3%) |
| $100,000 to $149,999 | 2 (15.4%) | 0 (0.0%) |
| $150,000 or more | 2 (15.4%) | 8 (14.0%) |
| Total | 13 (100.0%) | 57 (100.0%) |
Property Value to Household Income Ratio in Wardner
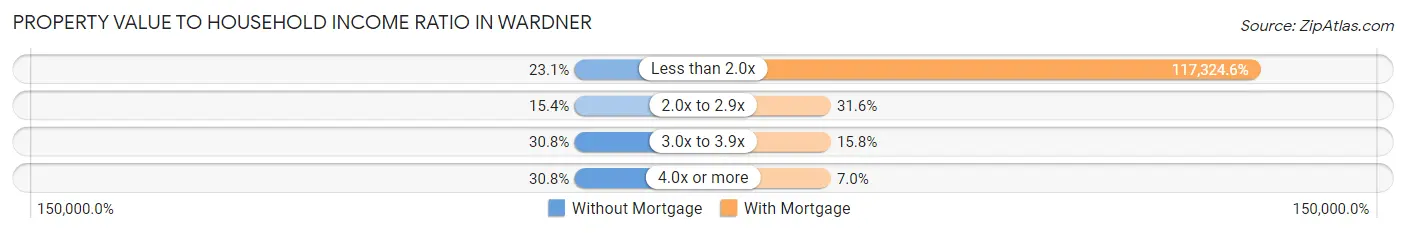
| Value-to-Income Ratio | Without Mortgage | With Mortgage |
| Less than 2.0x | 3 (23.1%) | 66,875 (117,324.6%) |
| 2.0x to 2.9x | 2 (15.4%) | 18 (31.6%) |
| 3.0x to 3.9x | 4 (30.8%) | 9 (15.8%) |
| 4.0x or more | 4 (30.8%) | 4 (7.0%) |
| Total | 13 (100.0%) | 57 (100.0%) |
Real Estate Taxes by Mortgage Status in Wardner
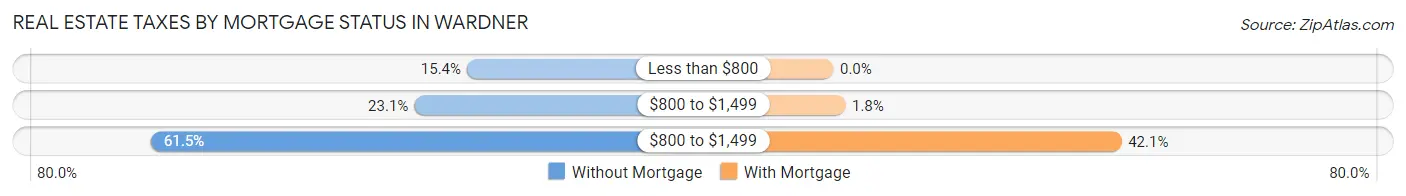
| Property Taxes | Without Mortgage | With Mortgage |
| Less than $800 | 2 (15.4%) | 0 (0.0%) |
| $800 to $1,499 | 3 (23.1%) | 1 (1.8%) |
| $800 to $1,499 | 8 (61.5%) | 24 (42.1%) |
| Total | 13 (100.0%) | 57 (100.0%) |
Health & Disability in Wardner
Health Insurance Coverage by Age in Wardner
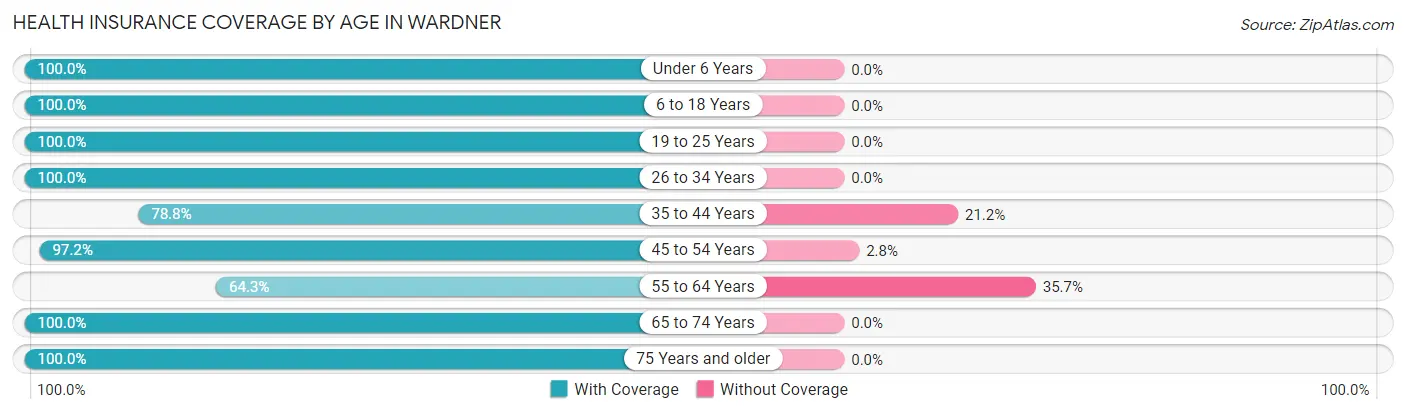
| Age Bracket | With Coverage | Without Coverage |
| Under 6 Years | 18 (100.0%) | 0 (0.0%) |
| 6 to 18 Years | 43 (100.0%) | 0 (0.0%) |
| 19 to 25 Years | 3 (100.0%) | 0 (0.0%) |
| 26 to 34 Years | 103 (100.0%) | 0 (0.0%) |
| 35 to 44 Years | 26 (78.8%) | 7 (21.2%) |
| 45 to 54 Years | 35 (97.2%) | 1 (2.8%) |
| 55 to 64 Years | 27 (64.3%) | 15 (35.7%) |
| 65 to 74 Years | 36 (100.0%) | 0 (0.0%) |
| 75 Years and older | 16 (100.0%) | 0 (0.0%) |
| Total | 307 (93.0%) | 23 (7.0%) |
Health Insurance Coverage by Citizenship Status in Wardner
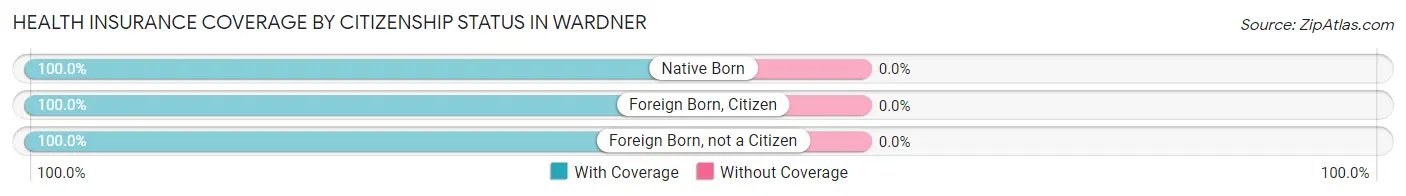
| Citizenship Status | With Coverage | Without Coverage |
| Native Born | 18 (100.0%) | 0 (0.0%) |
| Foreign Born, Citizen | 43 (100.0%) | 0 (0.0%) |
| Foreign Born, not a Citizen | 3 (100.0%) | 0 (0.0%) |
Health Insurance Coverage by Household Income in Wardner
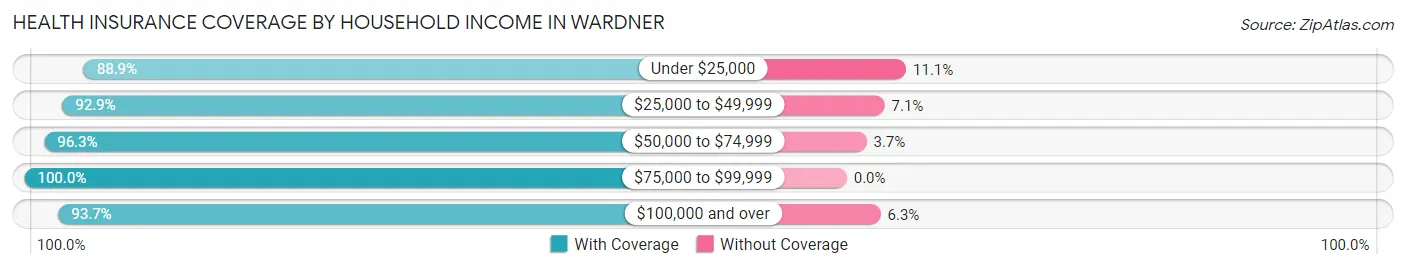
| Household Income | With Coverage | Without Coverage |
| Under $25,000 | 40 (88.9%) | 5 (11.1%) |
| $25,000 to $49,999 | 105 (92.9%) | 8 (7.1%) |
| $50,000 to $74,999 | 26 (96.3%) | 1 (3.7%) |
| $75,000 to $99,999 | 3 (100.0%) | 0 (0.0%) |
| $100,000 and over | 133 (93.7%) | 9 (6.3%) |
Public vs Private Health Insurance Coverage by Age in Wardner
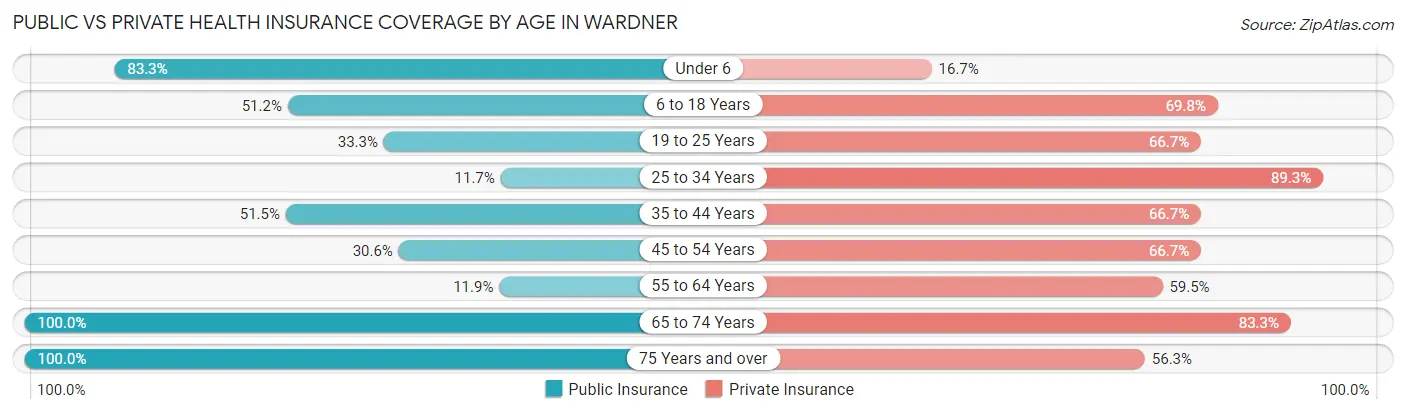
| Age Bracket | Public Insurance | Private Insurance |
| Under 6 | 15 (83.3%) | 3 (16.7%) |
| 6 to 18 Years | 22 (51.2%) | 30 (69.8%) |
| 19 to 25 Years | 1 (33.3%) | 2 (66.7%) |
| 25 to 34 Years | 12 (11.7%) | 92 (89.3%) |
| 35 to 44 Years | 17 (51.5%) | 22 (66.7%) |
| 45 to 54 Years | 11 (30.6%) | 24 (66.7%) |
| 55 to 64 Years | 5 (11.9%) | 25 (59.5%) |
| 65 to 74 Years | 36 (100.0%) | 30 (83.3%) |
| 75 Years and over | 16 (100.0%) | 9 (56.2%) |
| Total | 135 (40.9%) | 237 (71.8%) |
Disability Status by Sex by Age in Wardner
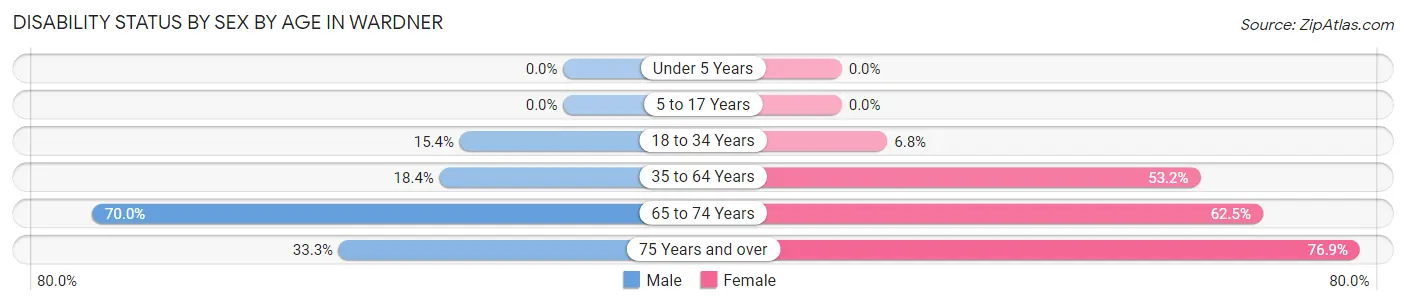
| Age Bracket | Male | Female |
| Under 5 Years | 0 (0.0%) | 0 (0.0%) |
| 5 to 17 Years | 0 (0.0%) | 0 (0.0%) |
| 18 to 34 Years | 6 (15.4%) | 5 (6.8%) |
| 35 to 64 Years | 9 (18.4%) | 33 (53.2%) |
| 65 to 74 Years | 14 (70.0%) | 10 (62.5%) |
| 75 Years and over | 1 (33.3%) | 10 (76.9%) |
Disability Class by Sex by Age in Wardner
Disability Class: Hearing Difficulty
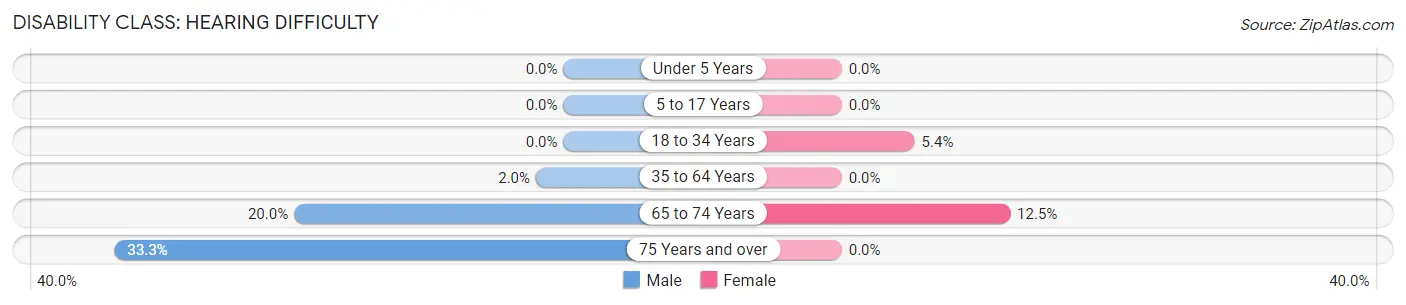
| Age Bracket | Male | Female |
| Under 5 Years | 0 (0.0%) | 0 (0.0%) |
| 5 to 17 Years | 0 (0.0%) | 0 (0.0%) |
| 18 to 34 Years | 0 (0.0%) | 4 (5.4%) |
| 35 to 64 Years | 1 (2.0%) | 0 (0.0%) |
| 65 to 74 Years | 4 (20.0%) | 2 (12.5%) |
| 75 Years and over | 1 (33.3%) | 0 (0.0%) |
Disability Class: Vision Difficulty
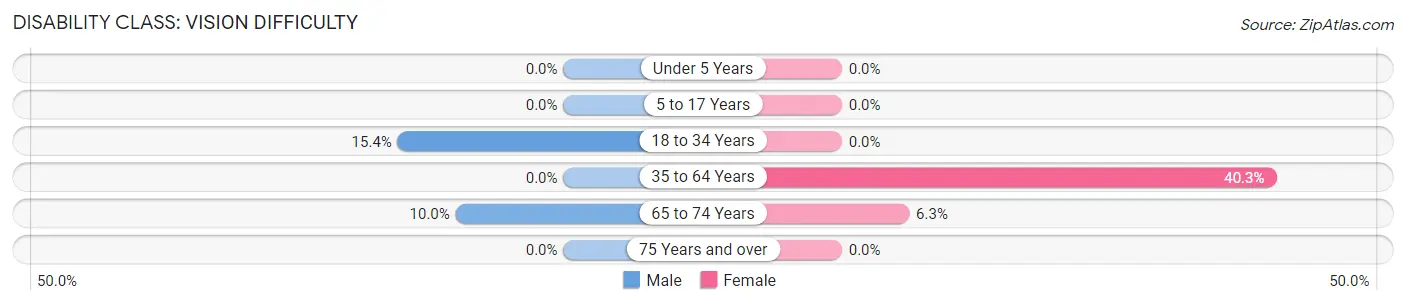
| Age Bracket | Male | Female |
| Under 5 Years | 0 (0.0%) | 0 (0.0%) |
| 5 to 17 Years | 0 (0.0%) | 0 (0.0%) |
| 18 to 34 Years | 6 (15.4%) | 0 (0.0%) |
| 35 to 64 Years | 0 (0.0%) | 25 (40.3%) |
| 65 to 74 Years | 2 (10.0%) | 1 (6.2%) |
| 75 Years and over | 0 (0.0%) | 0 (0.0%) |
Disability Class: Cognitive Difficulty
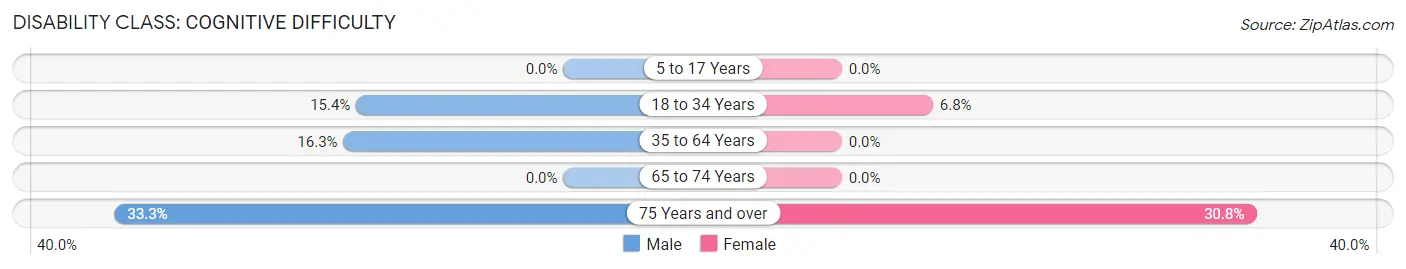
| Age Bracket | Male | Female |
| 5 to 17 Years | 0 (0.0%) | 0 (0.0%) |
| 18 to 34 Years | 6 (15.4%) | 5 (6.8%) |
| 35 to 64 Years | 8 (16.3%) | 0 (0.0%) |
| 65 to 74 Years | 0 (0.0%) | 0 (0.0%) |
| 75 Years and over | 1 (33.3%) | 4 (30.8%) |
Disability Class: Ambulatory Difficulty
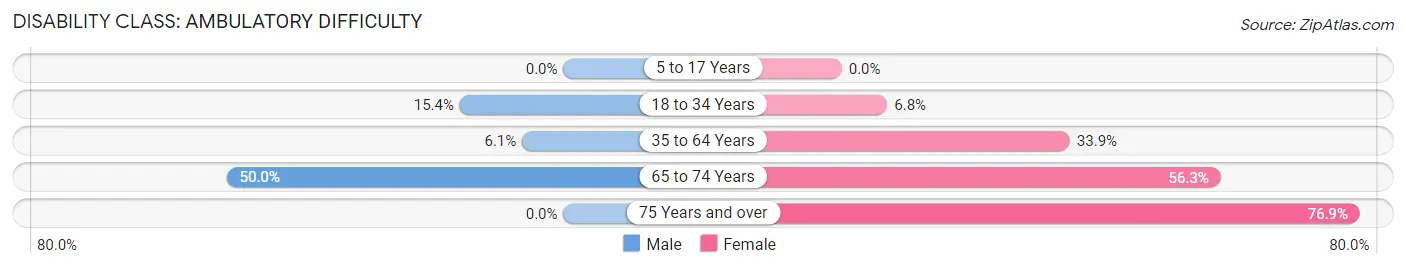
| Age Bracket | Male | Female |
| 5 to 17 Years | 0 (0.0%) | 0 (0.0%) |
| 18 to 34 Years | 6 (15.4%) | 5 (6.8%) |
| 35 to 64 Years | 3 (6.1%) | 21 (33.9%) |
| 65 to 74 Years | 10 (50.0%) | 9 (56.2%) |
| 75 Years and over | 0 (0.0%) | 10 (76.9%) |
Disability Class: Self-Care Difficulty
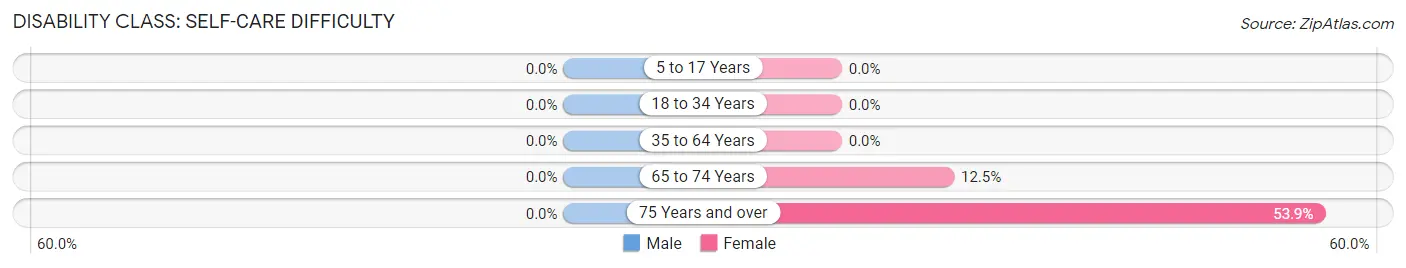
| Age Bracket | Male | Female |
| 5 to 17 Years | 0 (0.0%) | 0 (0.0%) |
| 18 to 34 Years | 0 (0.0%) | 0 (0.0%) |
| 35 to 64 Years | 0 (0.0%) | 0 (0.0%) |
| 65 to 74 Years | 0 (0.0%) | 2 (12.5%) |
| 75 Years and over | 0 (0.0%) | 7 (53.8%) |
Technology Access in Wardner
Computing Device Access in Wardner
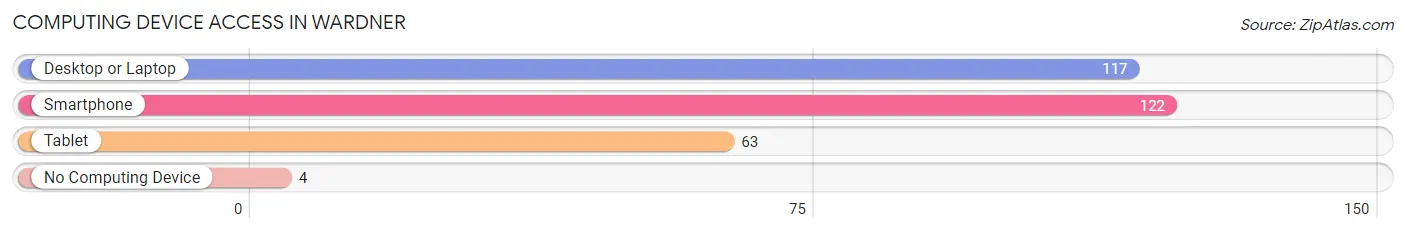
| Device Type | # Households | % Households |
| Desktop or Laptop | 117 | 88.6% |
| Smartphone | 122 | 92.4% |
| Tablet | 63 | 47.7% |
| No Computing Device | 4 | 3.0% |
| Total | 132 | 100.0% |
Internet Access in Wardner
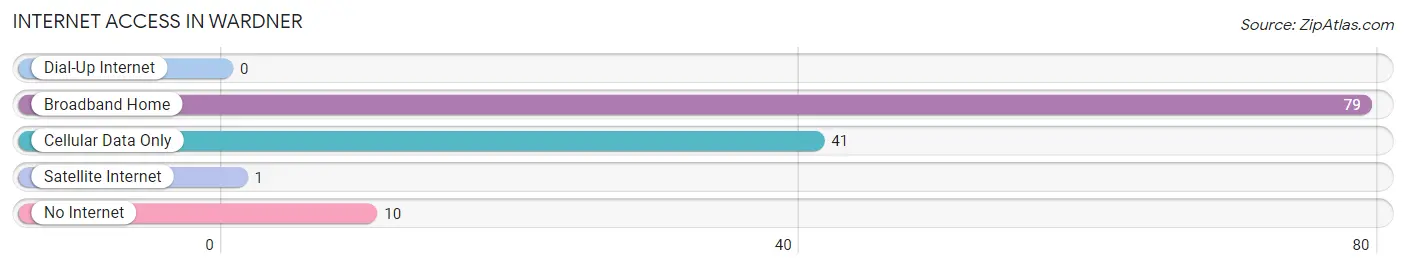
| Internet Type | # Households | % Households |
| Dial-Up Internet | 0 | 0.0% |
| Broadband Home | 79 | 59.9% |
| Cellular Data Only | 41 | 31.1% |
| Satellite Internet | 1 | 0.8% |
| No Internet | 10 | 7.6% |
| Total | 132 | 100.0% |
Wardner Summary
Wardner is a small town located in the northern part of the state of Idaho, in the United States. It is situated in the panhandle region of the state, in the county of Shoshone. The town is located on the banks of the Coeur d'Alene River, and is surrounded by the Coeur d'Alene National Forest. The town has a population of approximately 500 people, and is a popular tourist destination due to its proximity to the nearby ski resorts.
History
Wardner was founded in 1883 by a group of miners who were searching for gold in the area. The town was named after one of the miners, William Wardner, who was the first to discover gold in the area. The town quickly grew in size and by the early 1900s, it had become a bustling mining town. The town was home to several saloons, hotels, and stores, and was a popular destination for miners and prospectors.
In the early 1900s, the town began to decline as the gold rush ended and the mines closed. The town was nearly abandoned by the 1930s, but was revived in the 1950s when the nearby ski resorts began to attract tourists. The town has since become a popular tourist destination, and is home to several restaurants, shops, and hotels.
Geography
Wardner is located in the northern part of the state of Idaho, in the panhandle region. The town is situated on the banks of the Coeur d'Alene River, and is surrounded by the Coeur d'Alene National Forest. The town is located at an elevation of 2,890 feet, and has a total area of 0.6 square miles. The town is located approximately 25 miles south of the city of Coeur d'Alene, and is accessible via Highway 95.
Economy
The economy of Wardner is largely based on tourism. The town is home to several restaurants, shops, and hotels, which cater to the tourists who visit the nearby ski resorts. The town is also home to several small businesses, including a lumber mill, a sawmill, and a general store. The town is also home to a small airport, which serves the local area.
Demographics
As of the 2010 census, the population of Wardner was 498 people. The town has a population density of 830 people per square mile. The median age of the population is 44.7 years, and the median household income is $37,500. The town is predominantly white, with 95.2% of the population identifying as white. The town also has a small Hispanic population, with 4.8% of the population identifying as Hispanic or Latino.
Common Questions
What is the Total Population of Wardner?
Total Population of Wardner is 330.
What is the Total Male Population of Wardner?
Total Male Population of Wardner is 142.
What is the Total Female Population of Wardner?
Total Female Population of Wardner is 188.
What is the Ratio of Males per 100 Females in Wardner?
There are 75.53 Males per 100 Females in Wardner.
What is the Ratio of Females per 100 Males in Wardner?
There are 132.39 Females per 100 Males in Wardner.
What is the Median Population Age in Wardner?
Median Population Age in Wardner is 32.9 Years.
What is the Average Family Size in Wardner
Average Family Size in Wardner is 2.7 People.
What is the Average Household Size in Wardner
Average Household Size in Wardner is 2.5 People.
What is Per Capita Income in Wardner?
Per Capita income in Wardner is $36,148.
What is the Median Family Income in Wardner?
Median Family Income in Wardner is $34,970.
What is the Median Household income in Wardner?
Median Household Income in Wardner is $34,643.
What is Income or Wage Gap in Wardner?
Income or Wage Gap in Wardner is 56.2%.
Women in Wardner earn 43.8 cents for every dollar earned by a man.
What is Inequality or Gini Index in Wardner?
Inequality or Gini Index in Wardner is 0.54.
How Large is the Labor Force in Wardner?
There are 181 People in the Labor Forcein in Wardner.
What is the Percentage of People in the Labor Force in Wardner?
62.6% of People are in the Labor Force in Wardner.
What is the Unemployment Rate in Wardner?
Unemployment Rate in Wardner is 6.6%.